


Servicios Personalizados
Revista
Articulo
 texto en
  Artículo en XML
 Referencias del artículo
 Enviar artículo por email
Indicadores
-
 Citado por SciELO
 -
 Accesos
Links relacionados
-
 Similares en
SciELO
Similares en
SciELO
Compartir

 Permalink
Tecnología y ciencias del agua
versión On-line ISSN 2007-2422
Tecnol. cienc. agua vol.10 no.5 Jiutepec sep./oct. 2019 Epub 15-Feb-2020
https://doi.org/10.24850/j-tyca-2019-05-05
Articles
Temporal analysis of droughts (1922-2016) in the upper Nazas River Basin using SPI and its relationship with ENSO
1
 http://orcid.org/0000-0002-5043-817X
2
http://orcid.org/0000-0002-1528-5139
1Instituto Nacional de Investigaciones Forestales, Agrícolas y Pecuarias-Centro Nacional de Investigación Disciplinaria en Relación Agua, Suelo, Planta, Atmósfera, Gómez Palacio, México, esquivel_ag3@hotmail.com
2Instituto Nacional de Investigaciones Forestales, Agrícolas y Pecuarias-Centro Nacional de Investigación Disciplinaria en Relación Agua, Suelo, Planta, Atmósfera, Gómez Palacio, México, cerano.julian@inifap.gob.mx
3Instituto Nacional de Investigaciones Forestales, Agrícolas y Pecuarias-Centro Nacional de Investigación Disciplinaria en Relación Agua, Suelo, Planta, Atmósfera, Gómez Palacio, México, sanchez.ignacio@inifap.gob.mx
4Instituto Nacional de Investigaciones Forestales, Agrícolas y Pecuarias, México, Campo Experimental Saltillo, Saltillo, México, velasquez.miguel@inifap.gob.mx
5Stockholm Environment Institute, SEI US, Davis, United States, francisco.flores@sei-us.org
6Instituto Nacional de Investigaciones Forestales, Agrícolas y Pecuarias-Centro Nacional de Investigación Disciplinaria en Relación Agua, Suelo, Planta, Atmósfera, Gómez Palacio, México, bueno.palmira@inifap.gob.mx
The Standardized Precipitation Index (SPI) allows measuring the severity of the drought during a given period. The main objective of this was to generate SPI series for the upper Nazas River Basin and to analyze the ENSO (El Niño-Southern Oscillation), climatic phenomenon influence on the modulation of the SPI variability. The monthly precipitation data of 17 stations distributed in the basin were taken into account. The SPI was generated for a 12-month time scale of the 17 stations where a common variability was determined in15 out of the 17 series. A regional series of SPI for the period 1922-2016 was generated, in wich the most severe drought in the basin was recorded in the 1950s and 2000s. The spectral coherence of waves analysis between the SPI and the El Niño 3.4 index indicates a relationship for the dry and wet periods recorded in 1920-1930, 1950 and from 1980 to 2005 with a statistically significant influenced (p<0.05) due to occurrence of ENSO in periods of 2 to 7 years, 2 to 3 years and 10 to 14 years, respectively. The knowledge of the ENSO influence on the modulation of the climatic variability at the basin level, represents critical information to implement water resources management strategies and to prevent short-term risks in the activities destined to the inputs’ production.
Keywords: Drought index; severity; hydrology; climatic risk
El Índice Estandarizado de Precipitación (SPI) permite medir la severidad de la sequía durante un periodo de tiempo determinado. El objetivo general de este trabajo fue generar series del SPI para la cuenca alta del río Nazas y analizar la influencia del fenómeno climático El Niño-Oscilación del Sur (ENSO, por sus siglas en inglés) en la modulación de la variabilidad del SPI. Se consideraron los datos mensuales de precipitación de 17 estaciones distribuidas en la cuenca. Se generó el SPI a escala temporal de 12 meses para las 17 estaciones; se determinó una variabilidad común para 15 de las 17 series. Se logró generar una serie regional de SPI para el periodo 1922-2016, de la cual las sequías de mayor severidad en la cuenca se registraron en las décadas de 1950 y 2000. El análisis espectral de coherencia de ondeletas entre el SPI y el índice de El Niño 3.4 indica una relación en fase para los periodos secos y lluviosos registrados en 1920-1930, 1950 y de 1980 a 2005, los cuales han sido influenciados de manera significativa (p < 0.05) por la ocurrencia de ENSO en periodos de 2 a 7 años, 2 a 3 años y de 10 a 14 años, respectivamente. El conocimiento de la influencia del ENSO en la modulación de la variabilidad climática a nivel de cuenca representa información esencial para implementar estrategias de manejo de los recursos hídricos y prevenir riesgos a corto plazo en las actividades destinadas a la producción de insumos.
Palabras clave: índice de sequía; severidad; hidrología; riesgo climático
Introduction
The upper watershed of the Nazas River in the state of Durango is one of several closed basins located in the north central part of Mexico. It is part of the hydrologic region No. 36 (RH 36) of the Nazas and Aguanaval Rivers. This along the hydrologic regions No. 35 and 37 are grouped within the administrative region No. VII, which administrates the hydraulic resources of the three of them. The RH 36 is developed in the eastern part of the Sierra Madre Occidental (SMO) in direction west - east; it accounts for a surface area of 50,493 km2 and has 1, 573,446 inhabitants. Seventy two percent of the inhabitants (1, 132,881) are located in the lower part of the watershed where all the water that runs off from the upper part of the watershed of the Nazas River, is used (Estrada et al., 2014).
The geographic location of the watershed and the variation in the atmospheric patterns are the basis for the analysis of climatic variables such as rainfall which has impact of wet and dry spells (droughts) having a cascade impact towards the parts of the watershed were the hydraulic resources are used. Droughts are originated because a diminishing in rainfall below the historic average that occurs in a given area for a long period, commonly from one to several years originating deficit in the providing of water for an activity a group or an ambient sector (Campos, 2014). When this drought last for a greater period, rainfall is not enough to fulfill water demands of society and the environment, in this way, drought should be considered as a relative state rather than an absolute state (OMM, 2012).
For its analysis, droughts have been grouped in different categories: meteorological, hydrologic, agricultural, and underground growths, which makes reference either to the moment that occurs and the length for effect perception, by different sectors (Pereira, Cordery, & Iacovides, 2009). Among the available indexes, the Standardized Precipitation Index (SPI) is the most appropriate for drought monitoring (McKee, Doesken, & Kleist, 1993), because it allows comparing objectively dry and wet conditions in regions with different hydrologic regimes. The SPI is a standardized and multi-scalar index widely used in studies of drought characterization in watersheds (Heim, 2002).
Several studies have analyzed the temporal and spatial evolution of the SPI to different time scales in different regions as Turkey, China and Europe (Sönmez, Kömüscü, Erkan, & Turgu, 2005; Vicente-Serrano, 2006; Zhai et al., 2010; Bonaccorso, Peres, Cancelliere, & Rossi, 2013). Other studies have identified trends and periodicity of wet and dry spells trough dry - wet indexes in other regions of the world (Bordi, Fraedrich, & Sutera, 2009; Raziei, Bordi, Pereira, & Sutera, 2010; Santos, Pulido-Calvo, & Portela, 2010; Fischer, Gemmer, Su, & Scholten, 2013; Telesca, Vicente-Serrano, & López, 2013). On the other side, several studies have used the SPI to analyze dry and wet spells analyzing the relationships with climatic indexes as the El Niño (ENSO) (Siggdel e Ikeda, 2010; Paredes, Barbosa, & Guevara, 2015; Raziei et al., 2014; Biabanaki et al., 2014). The El Niño event refers to an exceptional warming of the sea surface in the tropical Pacific, which it is tied to big atmospheric changes through the phenomena known as South Oscillation (SO), from there the name ENSO (Trenberth, 2013).
In Mexico Escobar, González, Sánchez, Muñoz and Villa (2012) obtained the SPI to a three-month time scale for the Sardinas hydrologic station in the upper watershed of the Nazas River. They reported that the intensity of wet and dry spells have an increasing trend in recent years probably by influence of the ENSO. Castillo, Ibañez, Valdés, Arteaga and Vázquez (2017), and Serrano, Vicente, Flores, Tijerina and Vázquez (2016) utilized the SPI from a watershed context incorporating a Precipitation-Standardized Evaporation Index (SPEI) which additionally to precipitation includes the temperature and demonstrated a clear increasing trend in the number, intensity and severity of droughts. Nevertheless, spite of the few research developed in the country about the SPI generation, the main focus of the studies has been to obtain directly the drought indexes and there is no an analysis of the common variability among climatic stations that allows the generation of a regional SPI; also there is a lack of studies of the influence of atmospheric phenomena that may influence the SPI variability to a watershed level. Within this context, the general objective of this study was to generate SPI series for the upper Nazas River watershed and to analyze the influence of the ENSO in the SPI variation.
Materials and methods
Study area
The Nazas River upper watershed it is located in the central - north of the state of Durango in northern Mexico. The watershed is one of the most important watersheds within the RH 36 for its surface area and for the runoff volumes that it generates. The watershed is a closed basin with a surface area of 18,321 km2 (INEGI, 2017). The watershed encompasses the Ramos River (with the Tepehuanes and Santiago affluent) and the del Oro or Sextin River; its surface runoff flows in to the Lazaro Cardenas dam. The highest altitude is 3300 meters above the sea level (masl) and the lowest point is 1400 (masl), Figure 1.

Rainfall data
The climatic stations included within the study were those located within the watershed boundaries with an additional area of 20 km. A total of 37 climatic stations were included, 22 within the boundaries of the watershed and 15 outside. The criteria for selecting the climatic stations included at least 30 years of continuous record, no more of 10% of missing information and being in use no less than the year 2005. To determine the quality of the information, an exploratory graphic analysis was executed, as well as tests of homogeneity of variances. The selected climatic stations are shown in Table 1.
Table 1 Climatic stations analyzed.
| No. | Station | Elevation (masl) |
Annual average precipitation (mm) |
Latitude | Longitude | Information period available |
|---|---|---|---|---|---|---|
| 1 | Santiago Papasquiaro | 1716 | 553 | -105.433 | 25.033 | 1922-2016 |
| 2 | Guanaceví | 2300 | 629 | -105.952 | 25.933 | 1922-2016 |
| 3 | El Palmito | 1600 | 370 | -105.004 | 25.614 | 1941-2016 |
| 4 | Cendradillas | 2500 | 617 | -106.017 | 26.300 | 1961-2014 |
| 5 | Chinacates | 2040 | 427 | -105.067 | 25.017 | 1963-2014 |
| 6 | Otinapa | 2400 | 669 | -105.017 | 24.083 | 1963-2013 |
| 7 | Rosario | 1790 | 457 | -105.650 | 26.600 | 1963-2008 |
| 8 | El Tarahumar | 2435 | 926 | -106.324 | 25.617 | 1964-2009 |
| 9 | Navíos viejos | 2492 | 786 | -105.05 | 23.833 | 1964-2014 |
| 10 | Ciénega de escobar | 2144 | 559 | -105.746 | 25.601 | 1965-2008 |
| 11 | Santa María del Oro | 1700 | 564 | -105.367 | 25.953 | 1967-2016 |
| 12 | Tejamen | 1980 | 691 | -105.133 | 24.800 | 1969-2014 |
| 13 | Sardinas | 1639 | 503 | -105.566 | 26.084 | 1970-2016 |
| 14 | Los altares | 2490 | 827 | -105.867 | 25.000 | 1973-2016 |
| 15 | San Bernardo | 1700 | 575 | -105.527 | 26.004 | 1976-2008 |
| 16 | General Escobedo | 1580 | 476 | -105.250 | 25.500 | 1979-2016 |
| 17 | Inde | 1900 | 357 | -105.220 | 25.576 | 1979-2009 |
Monthly rainfall data for each climatic station were obtained from the net of the National Weather Service (SMN, 2017); the National Water Commission provided updated information. Monthly missing data were computed by the US National Weather Service (NWS) method, which has been successfully utilized in this type of computations (Toro, Arteaga, Vázquez, & Ibáñez, 2015).
Standardized precipitation index
For the computing of the SPI the method described by McKee et al. (1993) was utilized by means of the computer program SPI SL.exe of free source code (NDMC, 2017). With this software, the SPI for the 17 climatic stations of the watershed was computed to a temporal scale of 12 months. According to the World Meteorological Organization (OMM) the 12 and 24 months computations of the SPI reflects the long-term precipitation patterns allowing detecting clearly the dry spells. For instance, the temporal scale of 12 months represent the cumulated rainfall behavior for the month of interest and during the 11 months before that (Ortega, 2012). Given that these temporal scales are the cumulated result of shorter periods that may be above or below the normal, the SPI to longer periods tend to be around cero unless that there is a wet or dry characteristic trend. The three months SPI is related to soil water content and the 6, 12 and 24 SPI periods are related to runoff, basins water level and moreover, with subsurface water levels to longer time scales (OMM, 2012). The SPI indexing was computed according the OMM classification shown in Table 2.
SPI series variability
For determining the co-variability of wet and dry spells within the watershed, a correlation analysis was performed (p<0.01) with a principal components analysis (PCA) for the 17 SPI series of 12 months; a common period between climatic stations was considered from 1980 through 2008 (29 years). This analysis allowed to determine the common variability among climatic stations and to integrate a regional SPI, which was obtained averaging the SPI values of the analyzed climatic stations in chronological order.
ENSO influence on the SPI variability
For analyzing the influence of the ENSO phenomenon on the climatic variability in the upper watershed of the Nazas River, the regional SPI (1922 - 2016) was related to the El Niño 3.4 index reconstructed from 2, 222 tree ring chronologies worldwide (Li et al., 2013). For this, annual resolution graphics were utilized and their potential spectra of wavelets using the MATLAB 6.5 software (MathWorks, 2002).
Results and discussion
Rainfall variability in the watershed
The average annual precipitation in the Nazas river watershed ranges from 350 through 900 mm/year (Figure 2). The climatic stations with the higher regimes belongs to the climatic stations El Tarahumar (8) located at 2435 (masl), Navios Viejos (9) located at 2492 (masl) and Los Altares (14) which belongs to the west part of the watershed within the additional area considered. Generally, the mean annual rainfall within the climatic stations decreases with the distance from the Pacific Ocean towards the Mexican plateau which can be demonstrated in the climatic stations of El Palmito (3), General Escobedo (16) and Indé (17) which are located in the lowest areas within the study region with the lowest rainfall values within the watershed (Figure 2).

Figure 2 Annual average precipitation in the upper watershed of the Nazas river (left) and schematization of the spatial distribution of the stations and their altitudinal gradient (right).
These results highlights a regular diminishing of rainfall from the upper part of the watershed down to the lower part and agrees with Descroix, González and Estrada (2004), that mention that there exist a clear opposition with respect to rainfall variability between the east part of the watershed (the majority of the climatic stations) and west (climatic stations 8, 9 and 14) from the SMO; the west part clearly beneficiate of a greater rainfall presenting a higher spatial variability; this can be appreciated in the climatic station El Tarahumar (8) which present extreme events (Figure 3) as a consequence of a highly rough topography.

Figure 3 Box diagram of the average annual precipitation for each climatic station. The values corresponding to the median are indicated with a horizontal line in black color at the center, standard deviations with horizontal lines at the ends and crosses indicate extreme or anomalistic values.
Always it is confuse to look for local factors to explain the spatial variability of rainfall patterns. Nevertheless, the first look with respect to the rainfall pattern of Figure 2 allows appreciating the impact of altitude and the distance to the ocean on rainfall amounts as Descroix et al. (2004) and Velasquez et al. (2013) pointed out. In fact, this situation is more evident for the east part of the watershed, meanwhile for the pacific realm the evolution is more complex because the altitude increases with the distance to the ocean making that both factors being in opposition (Descroix et al., 2004).
Standardized precipitation index
The SPI was generated for a 12 months temporal scale for the 17 climatological stations (Figure 4). The Santiago Papasquiaro (1) and Guanacevi (2) stations have the longest database from 1922 through 2016. Both stations shows the same trend of moderate drought events for the period of 1920 - 1940. The Palmito station (3) whose operation dates back to 1942 represents the third data series with longer information (1941 - 2016). The fist severe drought according the SPI (Table 2) it was recorded in the 1950’s and it is evident in the three stations (Figure 4). The station 2 it is located in the upper part of the watershed (2181 masl), the station No. 1 it is located in the middle part (1822 masl) and the station 3 in the lower part of the watershed (1545 (masl) from where it may be inferred that the impact of that drought affected all the study area. The station 3 in the lower part of the watershed had the lowest SPI value (-3.21) for the year 1953 (Figure 4).

Figure 4 SPI series on a 12 month scale indicating the droughts registered in the climatic stations of the upper watershed of the Nazas River. The shaded area in light gray denotes droughts and in dark gray color wet periods. The vertical bars in gray color show the synchrony of drought events.
The second drought considered from moderated to extremely dry occurred from 1974 through 1976 which is evident in 14 of the 17 climatic stations analyzed; the reminder stations (3) had no record at that time (Figure 4). The Santiago Papasquiaro station (1) is the one with the lowest SPI value in the year 1974 (-4.62). Another severe dry spell occurred in the period 1988 - 1991 which it was registered in 16 out of the 17 climatic stations analyzed (Figure 4).
Escobar et al. (2012) generated the SPI to a temporal scale of three months for the Sardinas station (13); they performed a drought classification of 5 years period, they findings shows that the higher frequency of moderate droughts occurred from 1996 through 2000, severe droughts occurred from 1976 through 1980 and extreme droughts occurred from 1991 through 1995. The results obtained to an annual scale showed that the first drought occurred at the beginning of 1970 and severe droughts occurred from 1988 through 1991 and from 1994 through 1996. It is worth to mention that to a three months scale the SPI values fluctuates very rapidly switching from negative to positive values given the short period; to a bigger scale it reflect a larger rainfall pattern (Castillo et al., 2017). Escobar et al. (2012) verify this when comparing the obtained events for the extreme droughts category that showed a frequency of 10 events whereas to an annual scale the frequency was reduced to a three events.
Paleoclimate studies based on tree rings in the upper part of the Nazas river watershed reconstructed the rainfall variability for the period 1599-2008 (Cerano et al., 2012). This reconstruction determined the presence of severe droughts out of which the drought of the 1950´s represents one of the more severe with important impacts since the hydrological and social point of view. In addition, Sthale et al. (2009) pointed out that the wide and persistent drought over northwest Mexico begun in the 1990´s through 2009, which was generalized in the most part of the country that is replicated within the climatic stations with more recent data.
Droughts have been analyzed recently considering the SPI in other watersheds of Mexico, for instance, Castillo et al. (2017) computed the SPI to a different time scales for the watershed of the Rio Fuerte in the northwest part of Mexico for the period of 1961-2012. The SPI values variated from -2.0 through 2.5 showing that moderate drought period are more frequent to the end of the data series. Three and six months scales showed drought events form moderate to extreme of short and average duration; on the other side, to a scale of 12 and 24 months showed moderate and extreme droughts with a duration up to 61 months. For a watershed in the north pacific of Mexico for a period of 1961 through 2010, both the SPI and the SPEI were computed; the main drought events occurred in the 1980´s and 2000; in the year 1982 the biggest drought intensity is registered; nevertheless, the 2003 drought showed a bigger duration and magnitude (Serrano et al., 2016). This variability in the SPI and the drought’s synchrony in different watersheds of the country shows a climatic variability similar to an extensive geographic scale which can be influenced by general circulation events.
Variability of SPI series
The PCA determined that out of the 17 climatic stations analyzed 15 stations are grouped in the PC1 (Figure 5); the PC1 explains 49.60% of the rainfall variability. A positive meaningful correlation (p<0.01) was determined among the 15 stations from where there exist a common variation of rainfall for 88.2% of the climatic stations. After finding a common variability among the climatic stations, the SPI values were averaged out of the analyzed climatic stations in chronological order and then a regional series of SPI (1922 - 2016) was generated for the upper watershed of the Nazas River (Figure 6).

Figure 5 Principal Components Analysis (PCA) that indicates a common variability for most of the stations analyzed (15 of 17 stations). The numbers correspond to the climatic station presented in Table 2.
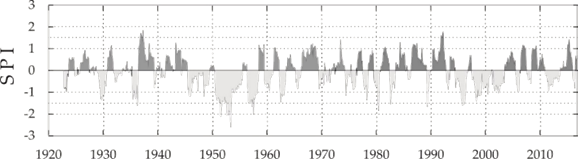
Figure 6 Regional Standardized Precipitation Index (1922-2016) for the upper watersheds of the Nazas River.
The regional SPI shows the main dry and wet spells that have occurred in the watershed in the last nine decades. The droughts form moderate to severe categories have occurred from the 1950´s (Figure 7). Nevertheless this event cannot be compared with the results of Castillo et al. (2017) and Serrano et al. (2016) given that their analysis begun in the 1960´s. The timeframe with the largest duration of droughts for the watershed were registered in August 1945 through August 1949 (49 months) returning a drought that begins in August 1950 through 1955 (61 months) and finally in September 1956 a diminishing in rainfall is presented that expands up through August 1958.

Figure 7 Relation between regional SPI (continuous line) and extreme events of Niño 3.4 index Niño 3.4 (dashed line).
Results obtained by Cerano et al. (2012) in a reconstruction of rainfall for the upper part of the Nazas River documented the same events of diminishing of rainfall in the decade of 1950. The second drought period with the highest extension occurred at the end of 1990, specifically during 1997; this drought extended for a period of 43 months ending the first trimester of the year 2001. Other dendroclimatic studies have reported these interval of heavy rainfall diminishing (Cerano, Villanueva, Valdez, Arreola, & Constante, 2011; Chávez et al., 2017). The most recent drought event was registered in the period 2011-2013 with a duration of 33 months that coincides with the results of Chávez et al. (2017) who documented a strong diminishing of rainfall for the period 2011-2017.
ENSO influence in the SPI variation
The relationship between the regional annual SPI and the El Niño 3.4 present a correlation coefficient of r = 0.27 (p<0.05). For specific period’s as1922 and through the end of the decade of 1940, from 1953 to 1960 and from 1980 through 2004, it is observed a similar trend. Among the years with no synchrony are 1952, 1967 and 1983 (Figure 7). The ENSO data files 1950 - 2016 reported events of La Niña and El Niño of different intensity (NOAA, 2016). The positive and negative indexes for the periods of 1953 - 1960, the decade of 1970 and from 1980 - 2004 synchronizes with ENSO event in it phase EL NIÑO and LA NIÑA respectively.
An spectral analysis of the annual SPI and the EL NIÑO 3.4 indexes, determined that the wavelength spectrum for the SPI shows significant areas (p<0.05) that correspond to one and two years for the periods 1932 - 1935, 1957 - 1962, 1979 - 1983 and from 25 to 30 years for the 1938 - 1988 period (Figure 8a). The EL NIÑO spectrum registered an irregular frequency from one to 7 years for the periods 1930 - 1935, 1964 -1967, 1969 - 1973 and 1983 - 2005 (Figure 8b). The analysis of coherence of wavelengths determined a significant relationship (p < 0.05) between the SPI and EL NIÑO 3.4 during the period 1922 - 1928 in frequencies of two and three years, from 1922 - 1935 in frequencies of 6 to 7 years, from 1956 - 1962 in frequencies of 2 and 3 years, from 1980 - 2000 to 4 and 7 years and from 1991 to date to a frequencies of 10 and 14 years (Figure 8c). There exist a relationship between both indexes, the dry and rainy intervals registered in 1920-1930, 1950, 1970 and from 1980 to 2005, have been influenced significantly by the ENSO occurrence in periods from 2 to 7 years, 2 to 3 years, 4 to 5 years and from 10 to 14 years respectively.

Figure 8 Spectral analysis of wavelets between SPI and ENSO. The most intense spots (grey to black) delimited by a continuous line, indicate the presence of a significant relationship (p<0.05) between both variables. The horizontal arrows to the right indicate that both phenomena are in phase or that they present a positive relationship; on the contrary, the arrows to the left indicate antiphase or negative relationship and the arrows in vertical orientation show that the variables are out of phase.
The climate variability in northern Mexico is tempered in great extent by the ENSO signal either in their LA NIÑA or in EL NIÑO phases (Stahle & Cleaveland, 1993; Magaña, Pérez, Vázquez, Carrizosa, & Pérez, 2009). The reconstruction of the rainfall variability for the last 400 years in the upper part of the Nazas watershed based on dendrochronological series has documented a significant influence of EL NIÑO in rainfall variability, increments of rainfall in the EL NIÑO phase and strong droughts during the LA NIÑA phase (Cerano et al., 2011).
Other studies at global level have analyzed the El NIÑO influence in the rainfall using the SPI, for instance Sigdel and Ikeda (2010) characterized droughts using the SPI for Nepal to a temporal scales of 3 and 12 months analyzing the connection between the SPI and the climatic indexes Southern Oscillation Index (SOI) and Indian Ocean Dipole Mode Index (DMI). They concluded that one cause of summer droughts is the El NIÑO, meanwhile fall droughts may be related positively wit DMI. Lovino, García and Baethgenc (2014) related the values of SPI for northeast Argentina finding synchrony with La NIÑA events. Sarricolea and Meseguer (2015) characterized drought in central Chile associating them with the ENSO 3.4 index, the results were significant (p < 0.05), showing a direct relationship between the EL NIÑO and abundant rainfall events and La NIÑA and drought events.
The upper part of the Nazas River watershed provides the runoff for the Lazaro Cardenas dam and the conveyance to the Francisco Zarco dam downslope. This couple of dams sustains the living to the lower part of the watershed known as Comarca Lagunera. The knowledge of the influence of general circulation climatic events as the El NIÑO on the climatic variability to a regional scale represents crucial information for implementing better management strategies of hydraulic resources and prevent in the short run risks in agricultural activities
Conclusions
A regional series of SPI was achieved for the period 1922 - 2016 for the upper part of the Nazas River watershed to a temporal scale of 12 months. The more severe drought events and higher magnitude were registered in the decades of 1950, 2000 and 2010. Moderate droughts were registered in the decades 1970 and 1980. An spectral analysis of wavelets coherence determined a significant relationship between the SPI variability an the El NIÑO index, also a relationship with negative index with La NIÑA and indexes with higher positive values related with the El NIÑO. In the past 9 decades, an important modulation of the SPI is observed by the ENSO. It is recommended for future studies to analyze the influence of the PDO and the Monsoon in the upper part watershed of the Nazas River; this phenomenon may be influencing water resources variability of this important region that allows delineating a crop pattern that maximizes irrigation water productivity in these areas of the country.
Acknowledgements
An acknowledgment to the Central North Watershed Council of the National Water Commission by their support in the climatic data acquisition for the climatic stations considered in the study.
REFERENCES
Biabanaki, M., Eslamian S. S., Koupai, J. A., Cañón, J., Boni, G., & Gheysari, M. (2014). A principal components/singular spectrum analysis approach to ENSO and PDO influences on rainfall in western Iran. Hydrology Research, 45(2), 250-262. DOI: 10.2166/nh.2013.166 [ Links ]
Bonaccorso, B., Peres, D. L., Cancelliere, A., & Rossi, G. (2013). Large-scale probabilistic drought characterization over Europe. Water Resources Management, 27, 1675-1692. [ Links ]
Bordi, I., Fraedrich, F., & Sutera, A. (2009). Observed drought and wetness trends in Europe: An update. Hydrology and Earth System Sciences, 13, 1519-1530. [ Links ]
Campos, D. F. (2014). Comparación de tres métodos estadísticos para detección y monitoreo de sequías meteorológicas. Agrociencia, 48, 463-476. [ Links ]
Castillo, C. M., Ibañez, C. L. A., Valdés J. B., Arteaga R. R., & Vázquez, P. M. A. (2017). Análisis de sequías meteorológicas en la cuenca del Río Fuerte, México. Tecnología y ciencias del agua, 8(1), 35-52. [ Links ]
Cerano, P. J., Villanueva, D. J., Valdez, C. R. D., Arreola, A. J. G., & Constante, G. V. (2011). El Niño Oscilación del Sur y sus efectos en la precipitación en la parte alta de la cuenca del río Nazas. Revista Chapingo Serie Ciencias Forestales y del Ambiente, 18, 207-215. DOI: 10.5154/r.rchscfa.2010.09.076. [ Links ]
Cerano, P. J., Villanueva, D. J., Valdez, C. R. D., Constante, G. V., González, B. J. L., & Estrada, A. J. (2012). Precipitación reconstruida para la parte alta de la cuenca del río Nazas, Durango. Revista Mexicana de Ciencias Forestales, 3(10), 7-23. [ Links ]
Chávez, G. M. P., Cerano, P. J., Nájera, L. J. A., Pereda, B. V., Esquivel, A. G., Cervantes, M. R., Cambrón, S. V. H., Cruz, C. F., & Corral, R. S. (2017). Reconstrucción de la precipitación invierno-primavera con base en anillos de crecimiento de árboles para la región de San Dimas, Durango, México. Bosque, 38(2), 387-399, DOI: 10.4067/S0717-92002017000200016 [ Links ]
Descroix, L., González, B. J. L., & Estrada, A. J. (eds.). (2004). La Sierra Madre Occidental una fuente de agua amenazada. Gómez Palacio, México: Instituto Nacional de Investigaciones Forestales, Agrícolas y Pecuarias- 'Institut de Recherche pour le Développement. [ Links ]
Escobar, P. J. J., González, B. J. L., Sánchez, C. I., Muñoz, V. A., & Villa, C. M. (2012). Análisis de la lluvia y su relación con fenómenos del cambio climático; estudio de caso en estación meteorológica Sardinas (San Bernardo, Durango). Revista Chapingo Serie Zonas Áridas, 11(2), 75-84. [ Links ]
Estrada, A. J., Delgado, R. G., Palomo, R. M., Rivera, G. M., Jacobo, S. M. R., & Villanueva, D. J. (2014). La cuenca del río Nazas en el norte de México: condición e iniciativas en la conservación de sus recursos naturales. Agrofaz, 14(2), 123-135. [ Links ]
Fischer, T., Gemmer, M., Su, B., & Scholten, T. (2013). Hydrological long-term dry and wet periods in the Xijiang River basin, South China. Hydrology and Earth System Sciences , 17, 135-148. [ Links ]
Heim, R. R. Jr. (2002). A review of twentieth-century drought indices used in the United States. Bulletin of the American Meteorological Society, 83, 1149-1165. [ Links ]
INEGI, Instituto Nacional de Estadística y Geografía. (2017). Simulador de flujos de agua de cuencas hidrográficas (SIATL) V. 3.2 recuperado de http://antares.inegi.org.mx/analisis/red_hidro/siatl/# [ Links ]
Li, J., Shang-Ping, X., Cook, E. R., Morales, M. S., Christie, D. A., Johnson, N. C., Chen, F., D’Arrigo, R., Fowler, A. M., Gou, X., & Fang, K. (2013). El Niño modulations over the past seven centuries. Nature Climate Change, 3, 822-825. DOI: 10.1038/NCLIMATE1936 [ Links ]
Lovino, M., García, N. O., & Baethgenc, B. (2014). Spatiotemporal analysis of extreme precipitation events in the Northeast region of Argentina (NEA). Journal of Hydrology: Regional Studies, 2, 140-158. Recuperado de http://dx.doi.org/10.1016/j.ejrh.2014.09.001 [ Links ]
Magaña, V., Pérez, J. L., Vázquez, J. L., Carrizosa, E., & Pérez, J. (1999). Los impactos de El Niño en México. México, DF, México: Secretaría de Educación Pública, Consejo Nacional de Ciencia y Tecnología. [ Links ]
MathWorks. (2002). Software matemático. MATLAB Versión 6.5. [ Links ]
McKee, T. B., Doesken, N. J., & Kleist, J. (1993). The relationship of drought frequency and duration to time scale. In: Proceedings of the Eighth Conference on Applied Climatology (pp. 179-184), Anaheim, California, American Meteorological Society, Boston. [ Links ]
NDMC, National Drought Mitigation Center. (2017). SPI SL 6.exe Program to Calculate Standardized Precipitation Index.National Drought Mitigation Center. Recuperado de https://drought.unl.edu/droughtmonitoring/SPI/SPIProgram.aspx [ Links ]
NOAA, National Oceanic and Atmospheric Administration - National Weather Service, Climate Prediction Center. (2016). Historical El Nino/ La Nina episodes (1950-present). Recuperado de https://origin.cpc.ncep.noaa.gov/products/analysis_monitoring/ensostuff/ONI_v5.php [ Links ]
OMM, Organización Meteorológica Mundial. (2012). Índice normalizado de precipitación. Guía del usuario. Ginebra, Suiza: Organización Meteorológica Mundial. Recuperado de http://www.droughtmanagement.info/literature/WMO_standardized_precipitation_index_user_guide_es_2012.pdf. [ Links ]
Ortega, G. D. (2012). Sequía en Nuevo León: vulnerabilidad, impactos y estrategias de mitigación. Apodaca, México: Instituto del Agua del Estado de Nuevo León. [ Links ]
Paredes, F. J., Barbosa, A. H., & Guevara, E. (2015). Análisis espacial y temporal de las sequías den el nordeste de Brasil. Agriscientia, 32 (1), 1-14. [ Links ]
Pereira, L. S., Cordery, I., & Iacovides, I. (2009). Coping with water scarcity: Addressing the challenges. Dordrecht, The Netherlands: Springer. [ Links ]
Raziei, T., Martins, D. S., Bordi, I., Santos, J. F., Portela, M. M., Pereira, L. S., & Sutera, A. (2014). SPI Modes of drought spatial and temporal variability in Portugal: Comparing observations, PT02 and GPCC gridded datasets. Water Resources Management , 29(2), 487-504. DOI 10.1007/s11269-014-0690-3 [ Links ]
Raziei, T., Bordi, I., Pereira, L., & Sutera, A. (2010). Space-time variability of hydrological drought and wetness in Iran using NCEP/NCAR and GPCC datasets. Hydrology Earth System Sciences, 14, 1919-1930. [ Links ]
Santos, J., Pulido-Calvo, I., & Portela, M. (2010). Spatial and temporal variability of droughts in Portugal. Water Resources Research, 46 (3), W03503, 1-13. Recuperado de http://dx.doi.org/10.1029/2009WR008071 [ Links ]
Sarricolea, P., & Meseguer, R. O. (2015). Sequías en Chile central a partir de diferentes índices en el periodo 1981-2010. Investigaciones Geográficas Chile, 50, 19-32. [ Links ]
Serrano, B. L., Vicente, S. S. M., Flores, M. H., Tijerina, C. L., & Vázquez, S. D. (2016). Variabilidad espacio-temporal de las sequías en la cuenca pacífico norte de México (1961-2010). Cuadernos de Investigación Geográfica, 42(1), 185-204. DOI: 10.18172/cig.2857 [ Links ]
Sigdel, M., & Ikeda, M. (2010). Spatial and temporal analysis of drought in Nepal using Standardized precipitation index and its relationship with climate indices. Journal of Hydrology and Meteorology, 7(1), 59-74. [ Links ]
SMN, Servicio Meteorológico Nacional. (2017). Normales climatológicas del estado de Durango. Recuperado de http://smn.cna.gob.mx/es/informacion-climatologica-ver-estado?estado=dgo [ Links ]
Sönmez, F., Kömüscü, A., Erkan, A., & Turgu, E. (2005). An analysis of spatial and temporal dimension of drought vulnerability inturkey using the standardized precipitation index. Natural Hazards, 35(2), 243-264. [ Links ]
Sthale, D. W., Cook, E. R., Villanueva, D. J., Fye, F. K., Burnette, R. D., Griffin, R. D., Acuña, S. R., Seager, R., & Heim, Jr. (2009). Early 21st-Century Drought in México. EOS, Transactions, American Geophysical Union, 90(11), 89-100. [ Links ]
Sthale, D. W., & Cleaveland, M. K. (1993). Southern Oscillation extremes reconstructed from tree-rings of the Sierra Madre Occidental and Southern Great Plains. Journal of Climate, 6, 129-140. [ Links ]
Telesca, L., Vicente-Serrano, S., & López, M. J. (2013). Power spectral characteristics of drought indices in the Ebro river basin at different temporal scales. Stochastic Environmental Research Risk Assessment, 27, 1155-1170. [ Links ]
Toro, T. A. M., Arteaga, R. R., Vázquez, P. M. A., & Ibañez, C. L. A. (2015). Relleno de series diarias de precipitación, temperatura mínima, máxima de la región norte del Urabá Antioqueño. Revista Mexicana de Ciencias Agrícolas, 6(2), 577-588. [ Links ]
Trenberth, K. E. (2013). El Niño Southern Oscillation (ENSO). Reference Module in Earth Systems and Environmental Sciences, 1, 1-12. Recuperado de http://www.cgd.ucar.edu/cas/Trenberth/website-archive/trenberth.papers-moved/2013ElNinoSouthernOscillation(ENSO)-Elsevier.pdf [ Links ]
Velásquez, V. M. A., Medina, G. G., Sánchez, C. I., Oleschko, L. K., Ruíz C. J. A., & Korvin, G. (2013). Spatial variability of the hurst exponent for the daily scale rainfall series in the state of Zacatecas, Mexico. Journal of Applied Meteorology and Climatology, 52, 2771-2780. Recuperado de https://doi.org/10.1175/JAMC-D-13-0136.1 [ Links ]
Vicente-Serrano, S. (2006). Spatial and temporal analysis of droughts in the Iberian Peninsula (1910-2000). Hydrological Sciences Journal, 51(1), 83-97. [ Links ]
Zhai, J., Su, B., Krysanova, V., Vetter, T., Gao, C., & Jiang, T. (2010). Spatial variation and trends in PDSI and SPI indices and their relation to streamflow in 10 large regions of China. Journal of Climate, 23, 649-663. [ Links ]
Received: December 30, 2017; Accepted: March 19, 2019
 Este es un artículo publicado en acceso abierto bajo una licencia Creative Commons
