


 texto en
  Inglés (pdf)
 Artículo en XML
 Referencias del artículo
 Enviar artículo por email
 Citado por SciELO
  Similares en
SciELO
Similares en
SciELO 
 Permalink
Highlights:
Suppression of N, P, K, Ca, Mg, S, B and cationic microelements was evaluated in Ochroma pyramidale.
P and N suppression generated negative consequences on O. pyramidale growth.
N and P suppression caused yellowing and necrosis, respectively, in leaves.
Influence by suppression of K, Mg, cationic microelements, S, Ca, and B was low.
B suppression showed no visual symptoms of deficiency.
Introduction
The establishment of forest plantations represents one of the activities with the greatest potential to contribute to the reduction and mitigation of tropical forest deforestation (Cubillos et al., 2016; Hall, Ashton, Garen, & Jose, 2011). These reforestation activities contribute to supporting ecosystem services, such as greenhouse gas reduction and carbon sequestration (Keller & Fox, 2019). Usually, in forest plantations, the use of fast-growing exotic species has dominated (Hall et al., 2011; Peláez-Silva, León-Peláez, & Lema-Tapias, 2019), because the lack of knowledge of the technical management of native forest species, from their initial stages of development, limits their use (Hall et al., 2011).
The success of native species in reforestation activities depends partially on the quality and nutritional status of nursery-produced plant material (Gregorio, Herbohn, Harrison, & Smith, 2015; Oliet, Planelles, Artero, & Domingo-Santos, 2016; Wulandari, Cheng, & Tawaraya, 2016). Plants produced under precise fertilization management will offer greater guarantees of survival and development in the field (Clark & Zheng, 2015; Grossnickle & Macdonald, 2018), as a result of improved quality and vigor (Allen, Harper, Bayer, & Brazee, 2017; Ashiono, Kamiri, & Kinyanjui, 2019; Mack, Owen, Niemiera, & Sample, 2019). Unfortunately, these fertilization practices often fail to address the specific plant requirements (Camacho, Camara, & Rodriguez-Zardin, 2014).
Despite Colombia's potential for commercial reforestation (24.8 million ha), only about 450 000 ha are occupied by forest plantations (Unidad de Planificación Rural Agropecuaria [UPRA], 2014). Among the native species with the greatest employment potential, we found Ochroma pyramidale (Cav. ex Lam.) Urb., characterized by its rapid growth and high survival (Miyajima, Barreto, de Oliveira, Batistela, & Simões, 2018). Its wood, the lightest in the market (Borrega & Gibson, 2015; Miyajima et al., 2018), is distinguished by high mechanical yield in structural panels, sports equipment, boats and airplanes, which has determined high demand and value of its wood and, therefore, great interest in plantation expansion (Cañadas-López et al., 2019; Miyajima et al., 2018). However, the level of knowledge of nursery nutritional management of O. pyramidale is low, which may limit the success of planting.
The objectives of this study were to identify the key nutrients for growth and development of O. pyramidale plants at nursery stage and to characterize visual deficiency symptoms associated with the suppression of each nutrient element.
Materials and Methods
Study site
The study was carried out in a greenhouse at the Piedras Blancas Forestry Station of the Universidad Nacional de Colombia (Medellín; 6° 15' 38” N and 75° 30' 23” W). This site is located at an altitude of 2 400 m, with average annual precipitation of 1 815 mm, mean annual temperature of 14.9 °C and relative humidity of 85 %. Bioclimatic conditions correspond to the low montane moist forest (bh-MB) life zone (Holdridge, 1987).
Establishing the experiment
Seeds were obtained from 15 seedling trees (at least 100 m away from each other) located in open areas of Southwestern Antioquia, characterized by high phenotypic and sanitary quality (Medina-Macedo et al., 2016). Seeds were sown in sterilized sand and watered daily until plants developed two true leaves (mean height = 2.70 ± 0.67 cm; mean diameter = 2.84 ± 0.63 mm; mean biomass = 0.09 ± 0.02 g), it was at this moment when the transplanting to the growth substrate was carried out.
The substrate consisted of a volumetric mixture of soil and river sand previously washed (3:2). The Andosol soil (Bw horizon, 30 to 50 cm) was sieved with a 4 mm mesh and air-dried. Subsequently, the substrate was disinfected with Basamid® (active ingredient: dazomet [tetrahydro-3,5-dimethyl-2H-1,3,5-thiadiazine-2-thione]) at a dose of 200 g∙m-3 covered with plastic for 10 days and aerated for five days to eliminate toxic residues of the product.
Experimental design
The experiment was composed of 10 treatments: one treatment included complete fertilization (CF), seven with macro and microelements suppression (N, P, K, Ca, Mg, S and B), one without cationic microelements (Fe, Mn, Cu and Zn) and one without fertilization (control). Each treatment had 10 repetitions assigned completely at random to the experimental units (one plant). The amount of each nutrient applied to the substrate of the CF treatment was estimated based on average theoretical values of soil fertility as references, which allow proper implementation of tropical forest species in nursery (Sepúlveda, Diez, Moreno, León, & Osorio, 2014). Nutrient sources and amounts applied to the substrate, according to the fertilization treatment, are shown in Table 1.
Table 1 Nutrient sources and amounts applied to the substrate according to the corresponding fertilization treatment for growing Ochroma pyramidale.
| Nutrient sources | Fertilization treatments | ||||||||
|---|---|---|---|---|---|---|---|---|---|
| CF | -Ca | -Mg | -K | -S | -N | -P | -B | -CM | |
| CaCl2∙2H2O (g) | 2.28 | - | 2.28 | 2.28 | 2.28 | 2.28 | 2.28 | 2.28 | 2.28 |
| MgCl26H2O (g) | 2.22 | 2.22 | - | 2.22 | 2.22 | 2.22 | 2.22 | 2.22 | 2.22 |
| KCl (g) | 0.42 | 0.42 | 0.42 | - | 0.42 | 0.42 | 0.42 | 0.42 | 0.42 |
| (NH4)2SO4 (g) | 0.06 | 0.06 | 0.06 | 0.06 | - | - | 0.06 | 0.06 | 0.06 |
| MgSO47H2O (g) | - | - | - | - | - | 7.34 | - | - | - |
| CO(NH2)2 (g) | 0.15 | 0.15 | 0.15 | 0.15 | 0.15 | - | 0.15 | 0.15 | 0.15 |
| H3PO4 (mL) | 4.3 | 4.3 | 4.3 | 4.3 | 4.3 | 4.3 | - | 4.3 | 4.3 |
| H3BO3 (g) | 0.01 | 0.01 | 0.01 | 0.01 | 0.01 | 0.01 | 0.01 | - | 0.01 |
| ZnSO4∙H2O (mg) | 0.01 | 0.01 | 0.01 | 0.01 | - | 0.01 | 0.01 | 0.01 | - |
| FeSO4 (mg) | 0.01 | 0.01 | 0.01 | 0.01 | - | 0.01 | 0.01 | 0.01 | - |
| MnSO4 (mg) | 0.01 | 0.01 | 0.01 | 0.01 | - | 0.01 | 0.01 | 0.01 | - |
| CuSO4 (mg) | 0.01 | 0.01 | 0.01 | 0.01 | - | 0.01 | 0.01 | 0.01 | - |
| EDTA-Zn-Na2 (mg) | - | - | - | - | 0.03 | - | - | - | - |
| EDTA-Fe-Na (mg) | - | - | - | - | 0.03 | - | - | - | - |
| EDTA-Mn-Na2 (mg) | - | - | - | - | 0.03 | - | - | - | - |
| EDTA-Cu-Na2 (mg) | - | - | - | - | 0.03 | - | - | - | - |
CF: Complete fertilization; -CM: suppression of cationic micronutrients.
Nutrient application in each treatment was performed on a single occasion before filling the plastic bags (10 x 22 cm, 2 kg). N dose was fractionated and supplied 15 and 30 days after transplanting. CM were supplied at the beginning and 15 days after transplanting. The fractionation of the fertilization dose of these nutrients was intended to reduce toxicity and risks of nutritional imbalance (Raj, Rajamani, & Kumara, 2020). No additional nutrient applications were made to those indicated; in addition, a physicochemical analysis of the substrate was made before and after fertilization (Table 2).
Table 2 Physical and chemical characteristics of the substrate for growing Ochroma pyramidale. The fertilized substrate corresponds to the complete fertilization treatment.
| Parameters | Unfertilized substrate | Fertilized substrate |
|---|---|---|
| pH (1:1, water) | 6 | 5.8 |
| Cation exchange capacity (cmolc∙kg-1) | 2.8 | 4 |
| Sand (%) (Bouyoucos) | 96 | 96 |
| Silt (%) (Bouyoucos) | 2 | 2 |
| Clay (%) (Bouyoucos) | 2 | 2 |
| Ca (cmolc∙kg-1) (ammonium acetate 1 N) | 2.4 | 3 |
| Mg (cmolc∙kg-1 soil) (ammonium acetate 1 N) | 0.3 | 1.1 |
| K (cmolc∙kg-1 soil) (ammonium acetate 1 N) | 0.1 | 0.3 |
| S (mg∙kg-1) (calcium phosphate, 0.008 M) | 14 | 15 |
| N (%) (Micro-Kjeldahl) | 0.2 | 0.3 |
| P (mg∙kg-1) (Bray II) | 4.6 | 78.4 |
| B (mg∙kg-1) (hot water. Azomethine) | 0.2 | 1 |
| Cu (mg∙kg-1) (Olsen-EDTA) | 0.6 | 5.4 |
| Fe (mg∙kg-1) (Olsen-EDTA) | 41 | 41 |
| Mn (mg∙kg-1) (Olsen-EDTA) | 2 | 13.5 |
| Zn (mg∙kg-1) (Olsen-EDTA) | 1.1 | 6.2 |
Bags were filled with the substrate corresponding to each treatment. Homogeneous plants, previously selected, were placed in the bags and kept in the greenhouse for six months after transplanting, guaranteeing substrate moisture between 50 and 60 % of the maximum retention capacity, which coincides approximately with the moisture retained at field capacity. The maximum retention capacity was determined by placing sample (2 g) in humid chamber for total saturation by capillarity, subsequent drying at 105 °C for 12 h and weighted (Jaramillo, 2011). The bags were placed on growth tables inside plastic containers with disinfected gravel to allow drainage.
Evaluation of variables
The variables evaluated were height (H), from the cotyledon scar to the highest bud, and root collar diameter (RCD) measured with a digital caliper or caliper gauge (PCE Inst, DCP 600N, Spain). Measurements were taken monthly; in addition, visual symptoms of deficiency were described, and corresponding images were taken.
At harvest (t = 6 months) aboveground and root parts of each plant were separated. Leaf area (LA, cm2) of fresh leaves was determined with a LICOR LI-3000A meter (USA). Subsequently, both aboveground and root parts were oven-dried (60 °C, 72 h) until constant biomass. Aboveground dry biomass (ADB, g) and root dry biomass (RDB, g) were measured for each plant.
Data processing
Growth (area under the curve) and quality indices (Birchler, Royo, & Pardos, 1998; Dickson, Leaf, & Hosner, 1960) and functional traits (specific leaf area and relative growth rate) of the plant (Pérez-Harguindeguy et al., 2013) were estimated based on the values determined for the variables.
The area under the curve (AUC) represents the height gain of plants in the growing season:
where,
n = number of periods evaluated
ti = i-th day after transplanting
hti = height recorded on the i-th day after transplanting (cm).
Plant quality index (PQI) integrates diameter and height with ratio between total plant dry weight (g) and aboveground/root part ratio (Dickson et al., 1960):
where,
H = height at harvest (cm)
DRC = diameter at root collar at harvest (mm)
ADB = aboveground dry biomass (g)
RDB = root dry biomass (g)
TDB = total dry biomass (g).
Relative growth rate (RGR) measures increase in plant size during a given time interval:
where,
TDB1 = initial total dry biomass (g)
TDB2 = total dry biomass at harvest (g)
t2 = time between transplanting and harvesting (days)
t1 = initial time (0 days).
To establish comparisons between nutrient suppression treatments and the complete fertilization treatment, relative yields were calculated: RR = Vi (suppression treatment) / Vi (CF), where Vi is the biometric variable (i: H, DRC, ADB, RDB) and CF is the complete fertilization treatment.
Finally, the degree of limitation generated by the treatments was classified, considering both the effect on each variable and the effect on all of them. The degree of limitation was determined based on the RR values of the variables H, PQI, RGR and LA of each suppression treatment, with respect to the values corresponding to these variables in the CF treatment. The four limitation groups were: low (RR ≥ 75 %), intermediate (50 % ≤ RR < 75 %), high (25 % ≤ RR < 50 %) and very high (RR < 25 %). Nutrients within each limitation group were established according to the homogeneous groups as a result of the application of the Tukey's test (P = 0.05).
Statistical Analysis
Treatment effects were determined with a one-way analysis of variance and multiple comparisons were made with the Tukey's test (P = 0.05). Joint relationships between variables and differences between treatments were established with a principal component analysis. Analyses were programmed using the R language (R Core Team, 2019).
Results and Discussion
Biometric performance of plants
According to Table 3, nutrient suppression produced differential responses compared to CF. Plants in the -P treatment showed the lowest biometric performance with similar results to the control plants, but with statistically significant differences (P < 0.05) compared to other treatments. Consequently, P was the most limiting nutrient for O. pyramidale.
Similar negative effects of P suppression have been reported for other forest species, because of the impact of its role in crucial functions such as the synthesis of molecules (DNA, RNA, ATP and NADPH), participation in physiological processes such as photosynthesis and respiration, and activation of proteins by means of phosphorylation (Raij, 2017). Souza, Tucci, Silva, and Ribeiro (2010) studied Swietenia macrophylla King plants without P application and found relative yields of 23 % in ADB and 35 % in RDB. Similarly, Carlos, Venturin, Macedo, and Higashikawa (2013) obtained relative yields close to 40 % in height and 5 % in ADB of Stryphnodendron adstringens (Mart.) Coville. Moreover, seedlings of Amburana acreana (Ducke) A. C. Sm achieved yields lower than 10 % for RDB (Vieira, Weber, Scaramuzza, Costa, & de Souza, 2011).
Table 3 Nutrient suppression effects on Ochroma pyramidale growth after six months in nursery.
| Treatment | H (cm) | DRC (mm) | ADB (g) | RDB (g) | AUC (cm2) |
|---|---|---|---|---|---|
| CF | 12.47 ± 0.36 b | 9.10 ± 0.31 a | 8.21 ± 0.28 ab | 4.99 ± 0.15 a | 786.90 ± 41.40 bc |
| -Ca | 14.34 ± 0.47 a | 9.45 ± 0.23 a | 8.63 ± 0.24 a | 4.83 ± 0.18 a | 1041.90 ± 61.54 a |
| -Mg | 11.79 ± 0.40 b | 9.15 ± 0.27 a | 7.47 ± 0.21 bc | 4.68 ± 0.14 a | 803.09 ± 38.66 bc |
| -K | 12.65 ± 0.19 b | 8.65 ± 0.17 a | 6.67 ± 0.21 c | 3.53 ± 0.12 c | 892.65 ± 39.01 ab |
| -S | 12.19 ± 0.36 b | 9.52 ± 0.22 a | 8.66 ± 0.26 a | 3.80 ± 0.18 bc | 959.25 ± 52.42 ab |
| -N | 7.87 ± 0.27 c | 6.54 ± 0.20 b | 2.26 ± 0.15 d | 1.14 ± 0.12 d | 702.90 ± 24.92 c |
| -P | 2.34 ± 0.15 d | 2.65 ± 0.18 c | 0.14 ± 0.04 e | 0.10 ± 0.02 e | 235.46 ± 11.84 d |
| -B | 11.44 ± 0.30 b | 2.62 ± 0.28 a | 8.61 ± 0.20 a | 3.53 ± 0.13 c | 860.25 ± 38.64 abc |
| -CM | 12.50 ± 0.34 b | 9.67 ± 0.19 a | 8.42 ± 0.20 a | 4.51 ± 0.15 ab | 990.15 ± 49.03 a |
| Control | 3.61 ± 0.46 d | 3.30 ± 0.20 c | 0.64 ± 0.17 e | 0.21 ± 0.05 e | 293.46 ± 11.96 d |
± standard error of the mean (n = 10). Different letters in the column represent significant differences between treatments for each variable (Tukey, P = 0.05). H = height, DRC = diameter at root collar, ADB = aboveground dry biomass, RDB = root dry biomass, AUC = area under the curve, CF = complete fertilization, -CM = cationic micronutrient suppression.
After P, N was the element responsible for the lowest performance compared to the CF treatment (P < 0.05). Figure 1 shows that, although N suppression decreased relative height and DRC yields, its greatest impact occurred in dry biomass with relative yields of 28 % in ADB and 23 % in RDB. Similarly, other studies have shown how N suppression affects ADB and RDB of nursery forest species, because of its role in the synthesis of amino acids and nucleic acids necessary for plant production, in addition to participating in the composition of the chlorophyll molecule (Raij, 2017). Thus, N suppression has generated yields close to 13 % in ADB for Tectona grandis L. f. (Barroso, Figueiredo, Pereira, Mendonça, & Silva, 2005), and of 26 % and 20 % in RDB for Tabebuia chrysantha (Jacq.) G. Nicholson and Margaritaria nobilis L. f., respectively (Herrera-Ramírez et al., 2014). Other studies pointed out N as the most limiting for the development of Bombacopsis glabra (Pasq.) Robyns (Camacho et al., 2014), Betula alnoides Buch.-Ham. ex D. Don (Chen, Zeng, Xu, Zhao, & Guo, 2010) and Khaya ivorensis A. Chev. (Corcioli, Divino- Borges, & de Jesus, 2016).
As a general pattern, suppression of Ca, K, S, Mg, B and the CM had low influence on biometric performance of O. pyramidale with relative yields above 70 % for all variables (Figure 1).
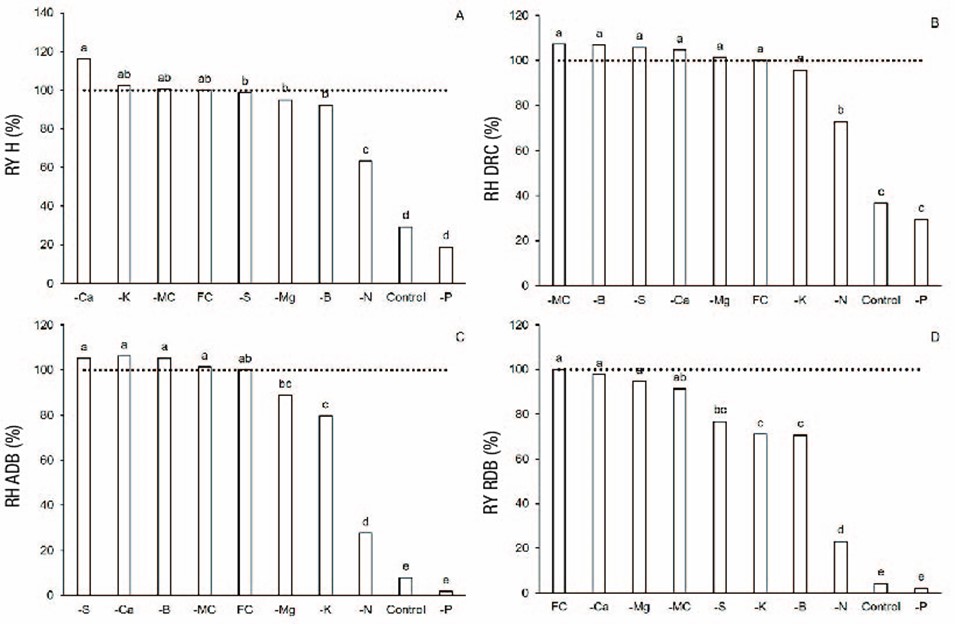
Figure 1 Relative yield (RY) of biometric variables of Ochroma pyramidale under nutrient suppression treatments after six months in nursery. Different letters represent significant differences in biometric variables between fertilization treatments (Tukey, P = 0.05). Dotted horizontal line represents the value of complete fertilization (CF). -CM = cationic micronutrient suppression, H = height, DRC = diameter at root collar, ADB = aerial dry biomass, RDB = root dry biomass.
CF and -Ca plants had the best biometric performance with no differences between them (P > 0.05), but differences were seen compared to the control (Table 3). Ca suppression, an element that contributes to cell wall stability, it is also important in the signaling and regulation of some enzymes (Pandey, 2015), but did not determine limitations. This was reflected in the high values of relative yield of variables, even higher than those of the CF treatment (>100 %), although Ca level in the growth substrate was relatively low (2.4 cmolc∙kg-1). Carlos et al. (2013) and Vieira, de Oliveira, and Weber (2015) had similar results, where plants in the absence of Ca had superior performances compared to plants under CF.
Plant functional traits and quality indices
Based on Table 4, treatments generated differences in quality indices (P < 0.05), as well as in functional traits. Again, P suppression was determinant, affecting quality and functional traits with similar performance to the control. Thus, P suppression determined relative yields, with respect to the highest performing group of treatments, of 18.1 % for RGR, 41.1 % for LA and 2.5 % for PQI. Regarding the latter, Carlos et al. (2013) obtained relative yields close to 30 % when comparing S. adstringens plants without P application with others that received CF formulas.
Table 4 Quality index and functional traits of Ochroma pyramidale under nutrient suppression treatments after six months in nursery.
| Treatments | PQI | LA (cm2) | RGR (g∙day-1) |
|---|---|---|---|
| CF | 4.36 ± 0.11 a | 156.73 ± 9.66 a | 0.0304 ± 0.0002 a |
| -Ca | 4.08 ± 0.16 a | 136.53 ± 8.46 a | 0.0305 ± 0.0002 a |
| -Mg | 4.20 ± 0.14 a | 138.79 ± 7.42 a | 0.0299 ± 0.0001 a |
| -K | 3.03 ± 0.09 b | 146.66 ± 6.67 a | 0.0290 ± 0.0001 a |
| -S | 3.50 ± 0.15 b | 153.79 ± 8.43 a | 0.0303 ± 0.0002 a |
| -N | 1.06 ± 0.10 c | 145.33 ± 11.61 a | 0.0232 ± 0.0005 b |
| -P | 0.11 ± 0.02 d | 64.42 ± 6.85 b | 0.0055 ± 0.0010 c |
| -B | 3.35 ± 0.14 b | 153.44 ± 6.49 a | 0.0299 ± 0.0002 a |
| -CM | 4.09 ± 0.13 a | 139.59 ± 8.04 a | 0.0303 ± 0.0002 a |
| Control | 0.20 ± 0.04 d | 91.89 ± 5.86 b | 0.0135 ± 0.0024 c |
± standard error of the mean (n = 10). Different letters in the column represent significant differences between treatments for each variable (Tukey, P = 0.05). PQI = plant quality index, LA = leaf area, RGR = relative growth rate, CF = complete fertilization, -CM = cationic micronutrient suppression.
Contrary to the effect of P suppression on plant quality and functional traits, the suppression of most of the other nutrients had less effect. Specially, for treatments CF, -Ca, -Mg and -CM, the highest PQI values (mean of 4.2) had differences with the rest of the treatments (P < 0.05). With respect to functional traits, plants from treatments CF, -Ca, -Mg, -CM, -K, -S and -B had the highest RGR values, with no differences among them (P > 0.05), but with differences compared to the control, -P and -N treatments. Although the latter treatment showed differences compared to the control and -P, the results identified N as the nutrient that determines, after P, the greatest limitations.
Relationship between the variables evaluated
The principal component analysis supports the determinant influence of P, followed by N, both on growth and development (Figure 2) and on plant functional traits and quality; moreover, the analysis reflected the low influence of suppressing most of the nutrients. This low influence can be attributed to the root morphology of fast-growing pioneer species such as O. pyramidale, whose branched root with abundant root-absorbing hairs allows it to be very efficient in nutrient absorption and thus less susceptible to nutrient suppression (Coll, Potvin, Messier, & Delagrange, 2008; Paz, 2003).
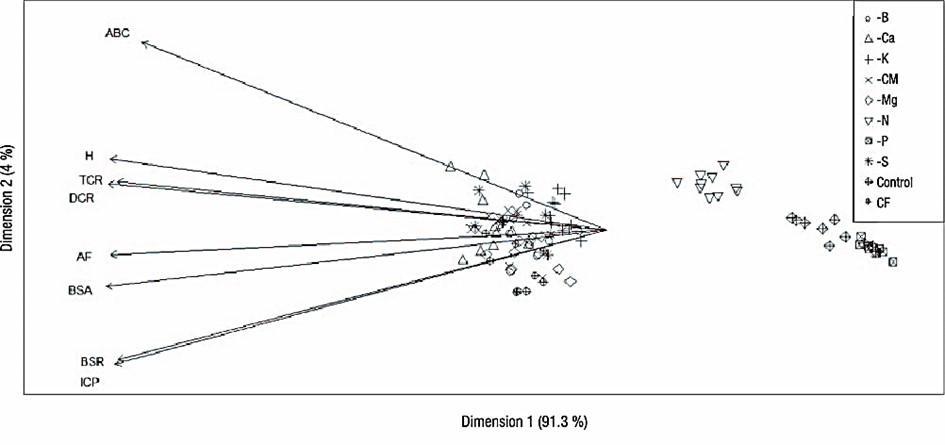
Figure 2 Principal component analysis of variables evaluated in Ochroma pyramidale after six months in nursery under nutrient suppression treatments. H = height, DRC = diameter at root collar, ADB = aboveground dry biomass, RDB = root dry biomass, AUC = area under the curve, CF = complete fertilization, -CM = cationic micronutrient suppression, PQI = plant quality index, RGR = relative growth rate, LA = leaf area.
Visual symptoms of nutritional deficiency
Figure 3 shows the deficiency symptoms, which began to appear after two months of growth, especially in height. After six months, differences between treatments were also evident in leaf coloration, shape, texture and size. Deficiencies found for each suppressed element are described below and illustrated in Figure 4.
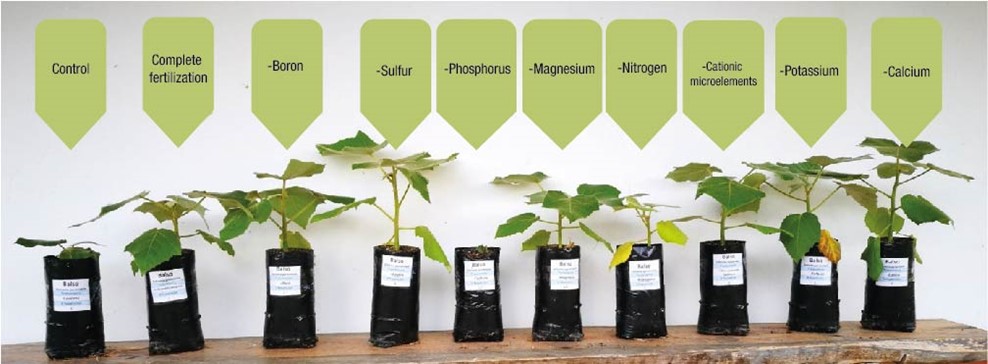
Figure 3 Appearance of Ochroma pyramidale seedlings after six months in nursery under nutrient suppression
-Mg: Plants smaller than those of CF. Chlorosis in old leaves and necrotic spots from the apex. These deficiency symptoms are similar to those found in Tabebuia rosea (Bertol.) Bertero ex A. DC. (Higuita-Aguirre, León - Peláez, Osorio, & Correa, 2021) and Plathymenia reticulata Benth (Vieira et al., 2015).
-K: Plants of smaller size and biomass than those of CF. Burnt edges were found on old leaves, similar to those in T. rosea and P. reticulata (Higuita-Aguirre et al., 2021; Vieira et al., 2015).
-S: Plants smaller than those of CF. There was chlorosis from the base to the apex in young leaves, a symptom also found in Amburana acreana (Ducke) A. C. Sm and in T. rosea (Higuita-Aguirre et al., 2021; Vieira et al., 2011).
-N: Delayed growth compared to the CF treatment. Yellow coloration on leaves, more noticeable on young leaves. Similar symptoms were recorded for T. grandis and Quercus humboldtii Bonpl. (Barroso et al., 2005; Sepúlveda et al., 2014).
-P: Strong growth retardation. Leaf necrosis and subsequent death and detachment. Similar symptoms were found in other studies (Barroso et al., 2005; Camacho et al., 2014), old leaves showed red spots and curled ends.
-B: Decreased growth compared to CF. No clear deficiency symptoms were found.
-CM: Decreased growth and interveinal chlorosis.
Control: Very low development compared to CF plants. Very low leaf area, short internodes, necrosis and continuous leaf loss.

Classification of nutrient limitation degree
To synthesize the effect of nutrient suppression, four variables related to plant vigor and quality were selected, which can determine better field performance: H, PQI, RGR and LA. Height (H) is commonly used as an indicator for output of plant material from the nursery, because of its close relationship with photosynthetic capacity and competitive vigor (Pérez-Harguindeguy et al., 2013). However, regarding only this criterion, we can lose sight of key aspects such as proportionality of development according to structural components (aboveground and root biomass) or functional traits that can determine better performance in terms of ability to acquire resources (water and light). Therefore, three variables from the latter two groups (PQI, RGR and LA) were additionally included. Thus, PQI allows choosing balanced plants according to their quality and aboveground and root dry biomass (Pérez-Harguindeguy et al., 2013). RGR identifies plants with the capacity to acquire greater biomass in less time (Kołodziejek, 2019), while LA allows the selection of plants with greater photosynthetic capacity and consequently, better growth and productivity (Pérez-Harguindeguy et al., 2013).
Figure 5 shows a proposed classification of degree of limitation determined by nutrient suppression treatments, considering both the effect generated on each of the variables, and that produced on the set of variables as a whole. Based on the average of the four variables, degree of limitation imposed by the nutrient set followed the decreasing pattern: P > N > K, Mg, CM, S, Ca, B. The two most limiting nutrients coincided with those reported for the species T. rosea (Higuita-Aguirre et al., 2021) and Cedrela fissilis Vell. (Souza et al., 2009).

Conclusions
P and N suppression drastically limited growth and development of Ochroma pyramidale, while suppression of the remaining nutrients had little effect on the biometric performance of seedlings in the nursery, probably due to the root system, characterized by high branching and abundant absorbing hairs. Such characteristics allow this species to be very efficient in the absorption of some nutrients, despite the low contents of the soil used as substrate. Average relative yields were higher than 80 % for Ca, Mg, K and cationic microelements, compared to those obtained in seedlings supplied with complete fertilization. This study highlights the importance of obtaining knowledge of special nutritional requirements of each species, for the optimization of fertilization practices in the nursery and the production of high vigor and quality plants.

