Servicios Personalizados
Revista
Articulo
Indicadores
-
 Citado por SciELO
 -
 Accesos
Links relacionados
-
 Similares en
SciELO
Compartir
Revista mexicana de ciencias pecuarias
versión On-line ISSN 2448-6698versión impresa ISSN 2007-1124
Rev. mex. de cienc. pecuarias vol.11 no.2 Mérida abr./jun. 2020 Epub 23-Oct-2020
https://doi.org/10.22319/rmcp.v11i2.4813
Technical notes
Genetic analysis of live weight and pregnancy rate at first calving in Brahman cattle from Venezuela
a Universidad Autónoma de Baja California Sur, Departamento de Ciencia Animal y Conservación del Hábitat, La Paz, B.C.S., México.
b Unidad Territorial Yaracuy. Ministerio del Poder Popular para Ciencia, Tecnología e Innovación. Venezuela.
c Universidad del Mar, Cuerpo Académico “Ciencias Agropecuarias”, Puerto Escondido, Oaxaca. México.
d Departamento de Genética, Universidad de Córdoba, España.
The live weight (LW) of 2,777 animals (1,377 females and 1,400 males with 53,258 individual data between 30 and 600 days of age), born between February 2000 and June 2011, was analyzed using a random regression (RR) model to estimate the genetic components of (co)variance throughout the age-sex scale. The pregnancy rate (PR) and the LW adjusted to 548 days of age (WA548) were studied using a multitrait (MT) model, an increase in the heritability (h2) estimates for PR compared to the classical univariate model (0.08 ± 0.03 vs. 0.11 ± 0.02) was observed, increasing the accuracy of the genetic value (GV) for PR in 15.7 %. The genetic correlation (rg) between the PR and the WA548 was 0.31 ± 0.11. The RR showed that, through time, the LW could not be considered as an expression of the same trait in both sexes, as the rg were less than 0.60. The principal component analysis showed that there are important changes in the animal growth on the age scale represented in these data. A prominent dimorphism of genetic origin manifested, estimated as the difference between the male and female GVs in LW, which shows a positive relationship with the GVs of PR.
Key words Heritability; Genetic correlations; Multitrait model; Random regression model; Sexual dimorphism
El peso vivo (PV) de 2,777 animales (1,377 hembras y 1,400 machos con 53,258 datos individuales entre 30 y 600 días de edad), nacidos entre febrero de 2000 y junio del 2011, se analizaron con un modelo de regresión aleatoria (RA) para estimar los componentes genéticos de (co)varianza a lo largo de la escala edad-sexo. La tasa de gestación (TG) junto con el peso vivo ajustado a 548 días de edad (PA548) se estudiaron mediante un modelo multicaracter (MT) obteniéndose un incremento en los estimados de heredabilidad (h2) para TG respecto al clásico modelo univariado (0.08 ± 0.03 vs 0.11 ± 0.02), aumentando la precisión del valor genético (VG) para TG en 15.7 %. La correlación genética (rg) entre TG y PA548 fue 0.31 ± 0.11. El RA mostró que el PV a través de la edad no puede considerarse como expresión del mismo rasgo en ambos sexos, ya que las rg fueron inferiores a 0.60. El análisis de componentes principales mostró que existen cambios importantes en la forma de crecimiento de los animales en la escala de edad representada en estos datos. Se manifestó un importante dimorfismo de origen genético, estimado como diferencia de los VG de machos y hembras en PV, el cual presenta una relación positiva con los VG de la TG.
Palabras clave Heredabilidad; Correlaciones genéticas; Modelos multivariados; Regresión aleatoria; Dimorfismo sexual
A general breeding program for the reproductive traits of the Brahman breed is carried out in the experimental station “La Cumaca”, Facultad de Ciencias Veterinarias of the Universidad Central de Venezuela, this represents a valuable source of genes for this population1.
The methodology used for genetic evaluations has different crucial elements. First, the WA548, used to estimate the genetic values (GVs), may be biased, since it assumes growth is linear. The results published 2,3,4,5 for B. indicus show growth variations throughout the behavioral tests. Furthermore, the sex of the animal is generally considered a fixed effect in the model, which implicitly assumes that the (co)variance components are the same in both sexes. This approach can incorporate another biased source for the GVs estimation, decreasing their accuracy and thus, affecting the breeding program development6,7,8. The exposed elements can affect the genetic correlations of the same trait between both sexes (rFM), which could manifest genotype-sex interaction effects.
The LW has been generally expressed at a fixed point, although it seems quite reasonable to examine these relationships throughout the age. If the information is available, the (co)variance components can be estimated using multitrait (MT) models, or, preferably, random regression (RR) models. Previous studies have compared the MT and RR models for the LW in Bos indicus cattle2,4; their results show the advantages of RR. However, this longitudinal approach has not examined the relationships between the sex of the animals. Therefore, more evidence is required, particularly when considering possible relationships between LW and female reproductive behavior (RB).
The importance of RB in the beef cattle economy is well known. However, the seemingly low h2 of most of the reproductive traits9,10,11 has been a limiting factor for its use as a direct selection criterion. As an alternative, previous studies have reported the scrotal circumference (SC) or the measured LW in young males, and its response correlated with the RB of females measured by services per pregnancy, days to calving, and the PR at the first service. These encouraging results12,13 correspond to a fixed age, but the evolution of these trends throughout the age and until first calving remains unknown.
This study aimed to estimate the heritabilities and genetic correlations between the WA548 and the PR of heifers in their first breeding season using a MT model; as well as the genetic (co)variance components of the LW of both sexes regarding age using a RR model; and to compare the genetic values for each ith age (GVi), based on the RR, with the MT-based GVs.
The experimental station “La Cumaca”, located at 472 m asl., near San Felipe City, Yaracuy State, Venezuela, has an extension of 433 ha, with 300 ha cultivated with Guinea, Star, Swazzi, Pará, and Wire grasses. The annual mean precipitation is 1,650 mm, with a mean temperature of 24 to 31.9 °C, and a mean relative humidity of 84 %14. It has a herd of pure, registered Brahman cattle, with approximately 180 cows in production.
The LW adjusted to 548 d of age (WA548) of 3,120 animals, born between February 2000 and June 2011, was modified, eliminating records with pedigree inconsistencies, absence, or problems in the date of birth. Finally, there were 2,777 animal records available (1,377 females and 1,400 males). These animals were born from 984 mothers (729 in the data vector) and 107 sires (48 in the data vector). The pedigree file included 3,977 animals. A total of 94,752 individual LW records from 1,776 females and 1,864 males, born between February 1978 and June 2011, were used. These animals were born from 1,291 mothers (929 in the data vector) and 128 sires (58 in the data vector), and the pedigree file included 4,070 animals. These data were edited, eliminating those records with pedigree inconsistencies, absence or problems in the date of birth, and data recorded less than 30 or more than 570 d of age. Data outside the range of ± 3.2 standard deviations within a 30-d range age classes were removed. Finally, a total of 53,258 individual data were available from 1,737 females and 1,803 males.
Several models were analyzed using the SAS GLM procedure15. Table 1 shows some indicators of the studied data.
Table 1 Live weight indicators of Brahman animals in the experimental station “La Cumaca”, Venezuela
| Trait | Female sample size |
Females | Male sample size |
Males |
|---|---|---|---|---|
| Birth weight | 1,776 | 29.5 ± 4.5 | 1864 | 31.9 ± 4.9 |
| Weaning weight | 1,639 | 165.8 ± 26.2 | 1630 | 177.3 ± 28.3 |
| Weight at 365 d | 1,396 | 209.9 ± 29.8 | 1410 | 231.8 ± 34.9 |
| Weight at 450 d | 1,378 | 235.6 ± 32.0 | 1392 | 271.2 ± 38.9 |
| Weight at 548 d | 1,340 | 290.0 ± 34.1 | 1385 | 326.3 ± 42.2 |
| Number of live weight records | 25,781 | 25781 | 27477 | 27477 |
| Pregnancy rate | 1,377 | 0.67 ± 0.37 |
There were completed three block analyses using the ASReml3 program16:
Block 0. Multivariate (MU) model for WA548 and PR.
Where:
yiis a vector that corresponds to the WA548 and the PR analyzed at the same time;
biis a fixed-effects vector of the jk th combination of sex-year-month (with 275 levels for WA548 and 124 for PR);
aiis a random correlated vector due to the genetic additive effect of the i th animal with data and its predecessors without records (4,070 levels) for WA548 and PR;
eilis a random residual vector correlated between trait 1 and 2;
X and Z are incidence matrices that connect the fixed and random effects with the vector of observations.
This model assumes that:
Var
In which G
i
=
Accij =
Where: Pev is the prediction error variance (individual value for each animal and study trait), and
To analyze the LW at different ages, it was applied RR, using different models and without considering the maternal effects, which variated in the fitting order of the polynomial for random effects, as well as the estimates of the total or intrasexual (co)variance components of the animal. In total, two model blocks were made:
Block 1 - Assumes that the (co)variance components are the same in both sexes.
Block 2 - Assumes that the (co)variance components are not the same in both sexes.
In both blocks, Yijkl represents the different LW estimates in the l akth animal, of the jth sex. The fixed effects (fixedi) were year-month of control with 674 levels: sex-age at calving with 18 levels, represented in all the models, so that the results can be compared by applying the LogL information criteria; BIC and AIC. The six models only differ in the fitting order of the Legendre polynomial (
Where A is the numerator of the relationship matrix between the animals with data and their ancestors without records (n= 4,070 total animals). Ip is the identity matrix for the random effects of the individual permanent environment (p=3540 dimension for block 1 with
ASReml automatically produces the principal component analysis of this matrix, which facilitates the interpretation of the estimated (co)variances trajectories. Herein, KG is a symmetrical matrix that consists of four submatrices with the same (co)variance components for the genetic effects in females (Kh); males (Km), and their covariances (Khm), with their corresponding variances of the intercept (
Generally, the genetic parameters of h2 and rg can be determined using classical equations17. The GVs of LW are determined for each sex using the best model solution where, for the kth animal it will have:
and where
Table 2 shows the genetic parameters obtained from block 0, where the correlations between the estimated GVs determined by MU and MT were incorporated.
Table 2 (Co)variance components and heritability of live weight adjusted to 548 d and the pregnancy rate at first calving (Block 0 models)
| Genetic parameter | Live weight (kg) | Pregnancy rate (d) |
|---|---|---|
| Genetic variance-MU | 369.9 | 0.017588 |
| Genetic variance-MT | 375.3 | 0.02335 |
| Heritability-MU | 0.337±0.11 | 0.084±0.03 |
| Heritability-MT | 0.349±0.10 | 0.109±0.02 |
| Genetic correlation- Weight and pregnancy rate | 0.309±0.11 | |
| Accuracy, % of the MU genetic value (GV) | 63.5±12.1 | 34.2±8.9 |
| Accuracy, % of the MT genetic value | 64.1±12.1 | 39.6±9.8 |
| Correlation between MU x MT genetic values | 0.996 | 0.8971 |
| Correlation between MU pregnancy rate GV x MU weight GV | 0.286 | |
| Correlation between MU pregnancy rate GV x MT weight GV | 0.570 | |
For the WA548 there were no differences between MU and MT. For the PR, the MT increased the h2, improving the accuracy of the GVs. The rg between both traits was positive (rg =0.309), which indicates the absence of antagonism in the improvement of both traits. The correlations between the GVs, based on the models, were higher than 0.897, from which it is inferred that there will be no changes in the order of merit for both procedures. The MT model has additional advantages, manifested in a higher correlation with the GV for PR, as well as greater accuracy in the GV estimates for this last trait, whose h2 value was low.
The fitness of the six models in blocks 1 and 2 was determined using the LogL, AIC, and BIC criteria, all three agreed that the third-order polynomial for the genetic effect is the best fit to the data. Block 2 models present better results, which demonstrate that there is a significant variation between sexes for the (co)variance genetic components.
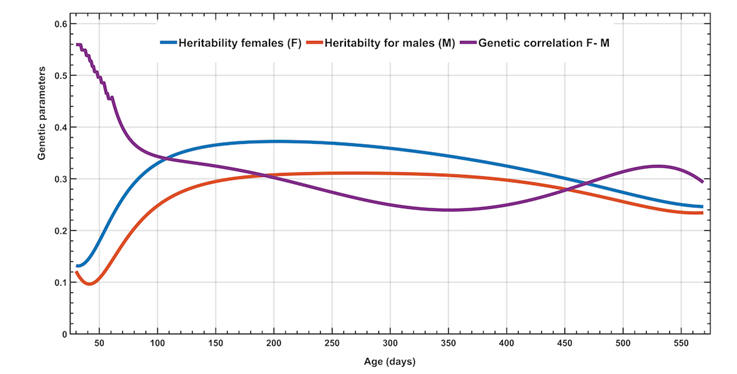
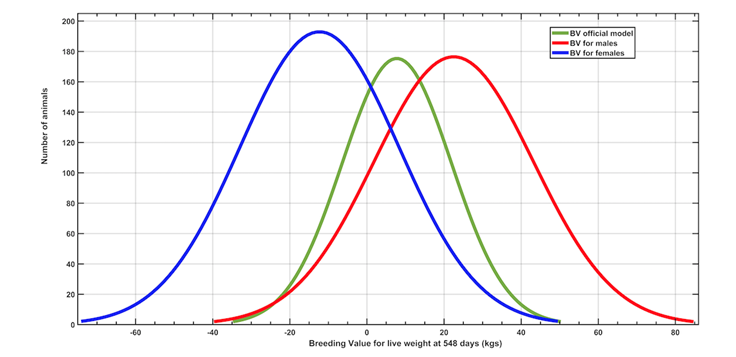
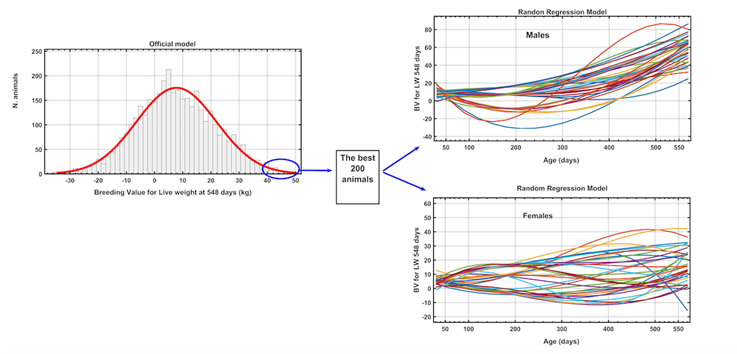
The LW h2 throughout the age in both sexes, as well as the genetic correlation between them is showed in Figure 1. The h2 trends show slight increases as age progresses, being higher for females. The rg reflect an inverse pattern with values ranging from 0.25 to 0.35. In contrast, the frequency distribution of the GVs for WA548, estimated according to block 0 models and RR, in Figure 2 shows an overlap of the three GVs estimates. The principal component analysis of the KG matrix for the chosen model 6 demonstrates that the first (vp1) and second (vp2) eigenvectors explained the 57 and 31 % of the genetic variation, respectively. The GVs of the best 200 animals in the MU (official current method) and the RR throughout age and for each sex are shown in Figure 3. This figure shows that in males the trend is positive, while in females we can find animals with negative GVs.

Figure 1 Heritability and genetic correlation estimates for live weight in females and males throughout the age scale in Brahman animals (model 6)

Figure 2 Frequency distribution of genetic values for weight at 548 days of age according to the current model and by means of random regression (model 6)

Figure 3 Evolution of the genetic values of Brahman animals of each sex and throughout the age scale, chosen based on the current evaluation model
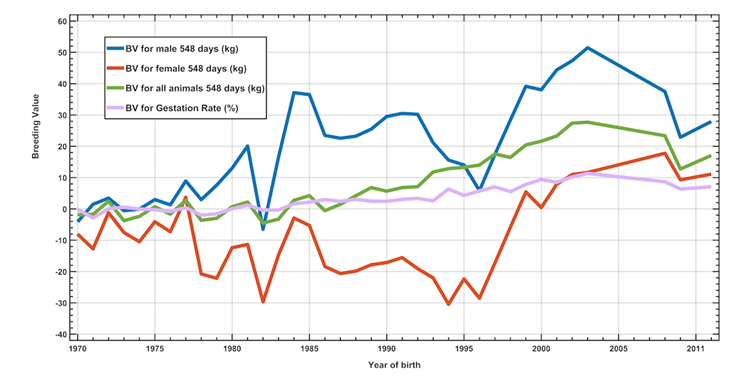
The merit evolution based on the year of birth of the animals is shown in Figure 4. The annual genetic progress was of 0.933 ± 0.021 kg/yr for the WA548, the principal trait in the applied breeding program; for the PR it was of 0.354 ± 0.010 %/yr.

Figure 4 Evolution of the genetic merit for live weight and pregnancy rate in Brahman animals in the experimental station “La Cumaca”
The h2 values for the WA548 are similar to several references published in Venezuela for this type of animal19,20, as well as with the results published for B. indicus in different Latin American countries21. Genetic progress for the WA548 was lower than that published by other authors20,22.
The h2 estimates with the MU for PR were low, which is similar to most of the publications about reproductive traits10,23. However, the h2 levels for PR with the MT increased, (h2=0.109 vs 0.087), which boosts the average accuracy of the GVs in 15.7 %. The rg levels between both traits suggest the absence of antagonism, which means that a selection process for LW and PR is possible, this approach has already been suggested in other studies11,12,24. The greatest genetic variability (Figure 2) and different h2 and rg levels for the WA548 throughout the age-sex scales (Figure 1) indicate that the expression of this trait should not be considered as an expression of the same trait in both sexes. The latter agrees with other published results7,8.
The sexual dimorphism (SD), evident in these data, has been studied in detail in the evolutionary context of the populations, creating a debate about the importance of the heterogeneous variance between sexes and its effects in the specialization and adaptability of the populations25, while there are previous statements about changes in SD as a correlated response to fertility selection. In relation to this last point of view, these results present a new approach, this study presents the GVs in each sex for the WA548M and WA548F (model 6 solution results, block 2), which makes possible to estimate a SD of genetic origin like SDg=GVWA548M - GVWPA548F, and these estimates of SDg can be related with the GVs of the same animals for the PR (MT model solution, block 0). The analysis results indicate that a quadratic equation (TG= 0.574 + 0.1045*SDg + 0.000765*SDg2 - 0 .0000244*SDg3, and R2= 96.1 %) was the best fit for the data, with an order increase of +1.2 % in PR for each 10 kg of SDg, with a maximum point when 40>SDg<60 with PR= +4.4 %. However, when -10>SDg<0, the PR was -1.4 %. These results are encouraging, but more research is required on this topic, which may have an important practical application in beef cattle production systems.
This study detected a wide genetic variety in the LW and PR of Brahman animals. It is suggested to use MT models, which allow substantial increases in h2 values and the accuracy of the estimated GVs, particularly in the PR. The RR analysis indicated that the h2 and rg levels between the LW of females and males vary throughout the age scale, which means that they should not be considered as expressions of the same trait. Finally, this study identified an important genetic variability in sexual dimorphism, which is related to the PR, although this suggestion requires further investigation with a larger number of animals.
Literatura citada
1. Plasse D, Verde O, Arango J, Camaripano L, Fossi H, Romero R, Rodriguez C, Rumbos J. (Co)variance components, genetic parameters and annual trends for calf weights in a Brahman herd kept on floodable savanna. Genet Mol Res 2002;1(4):282-297. [ Links ]
2. Menéndez BA, Guerra D, Planas T, Ramos F, Fernández L. Parámetros genéticos del peso vivo de machos Cebú en prueba de comportamiento en condiciones de pastoreo de Cuba, mediante modelo animal univariado, multicaracteres y regresiones aleatorias. Rev Cubana Cienc Agric 2006;40(4):397-408. [ Links ]
3. Martínez C, Elzo M, Manrique C, Jiménez A. Genetic parameters and breeding values for live weight using random regression models in a Bos taurus-Bos indicus multibreed cattle population in Colombia. Rev Colomb Cienc Pecu 2012;25:548-565. [ Links ]
4. Nobre P, Misztal I, Tsuruta S, Bertrand J, Silva L, Lopes P. Analyses of growth curves of Nellore cattle by multiple-trait and random regression models. J Anim Sci 2003;81:918-926. [ Links ]
5. Lopes F, Ulhôa C, Paulini F, Corrêa M, Sayuri E, Barbosa R. Analysis of longitudinal data of Nellore cattle from performance test at pasture using random regression model. Springer Plus 2012;1:49. [ Links ]
6. Garrick D, Pollak E, Quaas R, Van-Vleck L. Variance heterogeneity in direct and maternal weight traits by sex and percent purebred for Simmental-sired calves. J Anim Sci 1989;67:2515-2528. [ Links ]
7. Rodriguez AF, Van-Vleck L, Cundiff L, Kachman S. Heterogeneity of variance by sire breed, sex, and dam breed in 200- and 365-day weights of beef cattle from a top cross experiment. J Anim Sci 1995;73:2579-2588. [ Links ]
8. Pegolo N, Albuquerque L, Lobo R, Oliveira H. Effects of sex and age on genotype × environment interaction for beef cattle body weight studied using reaction norm models. J Anim Sci 2011;89:3410-3425. [ Links ]
9. Donoghue K. Genetic evaluation of female reproductive performance. http://www.bifconference.com/bif2002/Baker_Essay_pdfs/Donoghue_02BIF.pdf (02/04/2006). [ Links ]
10. Cammack K, Thomas M, ENNS R. Review: Reproductive traits and their heritabilities in beef cattle. Prof Anim Sci 2009;25:517-528. [ Links ]
11. Berry D, Evans R. Genetics of reproductive performance in seasonal calving beef cows and its association with performance traits. J Anim Sci 2014;92:1412-1422. [ Links ]
12. Mercadante M, Packer I, Razook A, Cyrillo J, Figueiredo L. Direct and correlated responses to selection for yearling weight on reproductive performance of Nelore cows. J Anim Sci 2003;81:376-3841. [ Links ]
13. Guerra D, González D, Rodríguez M, Ramos F. Relación entre el crecimiento y la reproducción en el ganado Cebú cubano. Ciencia y Tecnología Ganadera 2008;2 (3):147-152. [ Links ]
14. Ewel J, Madriz A. Zonas de vida de Venezuela. Ministerio de Agricultura y Cría. Dirección de Investigación. 1968. [ Links ]
15. SAS. SAS/STAT User´s Guide. Release 9.0. SAS. Inst. Inc., Cary, NC, USA. 2002. [ Links ]
16. Gilmour A, Gogel B, Cullis B, Thompson R. ASReml User Guide Release 3.0. VSN International Ltd, Hemel Hempstead, HP1 1ES, UK. 2009. [ Links ]
17. Falconer D, McKay F. Introduction to quantitative genetics. 4th ed. Burnt Mill, England. 1996. [ Links ]
18. Jamrozik J, Schaeffer L. Estimates of genetic parameters for a test day model with random regression for production of first lactation. J Dairy Sci 1997;80:762-770. [ Links ]
19. Plasse, D, Verde O, Fossi H, Romero R, Hoogesteijn R, Bastidas P, Bastardo J. (Co)variance components, genetic parameters and annual trends for calf weights in a pedigree Brahman herd under selection for three decades. J Anim Breed Genet 2002; 119:141-153. [ Links ]
20. Arias M, Romero R, Camaripano L, Arriaga L. Genetic and non-genetic parameters for growth traits in a registered Brahman herd. Rev Fac Cs Vet UCV 2013;54(2):78-88. [ Links ]
21. Giannotti J, Packer I, Zerlotti M. Meta-Análise para estimativas de herdabilidade para características de crescimento em bovinos de corte. Rev Bras Zootec 2005;34 (4):1173-1180. [ Links ]
22. Seprocebu, Seprocebu (Seprocebu, Seprocebu (http://www.seprocebu.com/GENETICO/ . Consultado Sep 15, 2017. [ Links ]
23. Donoghue K. Genetic evaluation of female reproductive performance. Beef Improvement Federation (BIF) annual conference. July 10-13, 2002, in Omaha, Neb., USA. http://www.bifconference.com/bif2002/ . Consultado 24 Abr, 2011. [ Links ]
24. Meyer K, Hammond K, Mackjnnon M, Pamel P. Estimates of covariances between reproduction and growth in Australian beef cattle. J Anim Sci 1991;69:3533-3543. [ Links ]
25. Poissant J, Wilson A, Coltman D. Sex-specific genetic variance and the evolution of sexual dimorphism: A systematic review of cross-sex genetic correlations. Evolution. 2010;64(1):97-107. [ Links ]
Received: March 16, 2018; Accepted: March 21, 2019


 texto en


