


Servicios Personalizados
Revista
Articulo
 texto en
  Artículo en XML
 Referencias del artículo
 Enviar artículo por email
Indicadores
-
 Citado por SciELO
 -
 Accesos
Links relacionados
-
 Similares en
SciELO
Similares en
SciELO
Compartir

 Permalink
Revista mexicana de ciencias agrícolas
versión impresa ISSN 2007-0934
Rev. Mex. Cienc. Agríc vol.12 no.7 Texcoco sep./nov. 2021 Epub 22-Mar-2022
https://doi.org/10.29312/remexca.v12i7.2327
Articles
Evaluation and prediction of infiltration in an Andosol under different land uses
1Facultad de Ciencias Forestales-Universidad Autónoma de Nuevo León. Carretera Nacional núm. 85 km 145, Linares, Nuevo León, México. CP. 67700. Tel. 821 2124895. (chivisjan@hotmail.com; inesyd@gmail.com; meranroka@hotmail.com).
Infiltration is an indicator of the ability of the soil to retain or drain water, it is influenced by the vegetation cover and type of soil, which when altered modifies its attributes. The objective of the research was to evaluate the behavior of infiltration in an Andosol. Plots of 100 m2 were established, in four areas under two land uses: a forest area and three agricultural areas [two plots of avocado cultivation (under organic and conventional management) and one more plot of macadamia with organic management], the reference year of the research was 2018. In situ infiltration was determined by means of the double-ring method by taking readings for a period of 150 minutes with variable recharges. The parameters of three empirical models were obtained to estimate infiltration: Horton, Kostiakov and Mezencev. Forest use presented the highest initial, final, basic and accumulated infiltration observed with values of 1 880, 863.47, 885.92 mm h-1 and 2 793.29 mm, while the avocado plot with conventional management showed the lowest values with 620, 248.27, 254.83 mm h-1 and 872.49 mm, respectively. The results of the fit of the models showed that Kostiakov’s model better predicts the infiltration process, this according to the values of NSE, r, MAE and R2. Changes from forest use to agricultural uses cause changes in the hydrological variables of the soil resource. Infiltration presented higher rates of speed under organic than conventional management.
Keywords: avocado; land-use change; macadamia; pine-oak forest
La infiltración es un indicador de la capacidad del suelo para retener o drenar el agua, se ve influenciada por la cubierta vegetal y tipo de suelo, que al ser alterada modifica sus atributos. El objetivo de la investigación fue evaluar el comportamiento de la infiltración en un Andosol. Se establecieron parcelas de 100 m2, en cuatro áreas bajo dos usos de suelo: un área forestal y tres agrícolas [dos parcelas de cultivo de aguacate (bajo manejo orgánico y convencional) y una parcela más de macadamia con manejo orgánico], el año de referencia de la investigación fue 2018. Se determinó la infiltración in situ por medio del método de doble anillo tomando lecturas por un período de 150 minutos con recargas variables. Se obtuvieron los parámetros de tres modelos empíricos para estimar la infiltración: Horton, Kostiakov y Mezencev. El uso forestal presentó la mayor infiltración inicial, final, básica y acumulada observadas con valores de 1 880, 863.47, 885.92 mm h-1 y 2 793.29 mm, mientras que la parcela de aguacate con manejo convencional mostro los valores más bajos con 620, 248.27, 254.83 mm h-1 y 872.49 mm, respectivamente. Los resultados del ajuste de modelos demostraron que el modelo de Kostiakov predice en mejor medida el proceso de infiltración, esto de acuerdo con los valores de NSE, r, MAE y R2. Los cambios de uso forestal a usos agrícolas provocan cambios en las variables hidrológicas del recurso suelo. La infiltración presentó mayores tasas de velocidad bajo manejos orgánicos que convencionales.
Palabras clave: aguacate; cambio uso del suelo; bosque pino-encino; macadamia
Introduction
The first stages of establishment of avocado crops in the state of Michoacán were on rainfed agricultural areas and to a lesser extent on forest areas (Burgos et al., 2012); however, during the last 15 years, the conversion of forest areas to avocado crops has been accelerating significantly, attributed mainly to its profitability (Chávez et al., 2012).
Specifically, vegetation and soil are two structural aspects sensitive to changes or disturbances in ecosystems, usually the hydrological cycle is one of the main processes affected, which causes changes in the availability of water in the ecosystem (Galicia, 2014). According to Regüés et al. (2012), land-use changes mainly cause short-term changes in the hydrological variables of the soil resource. The infiltration of water into the soil plays a fundamental role in the hydrological cycle. Depending on geological and ecological conditions, it can remain in the soil in the form of moisture, drain as a subsurface flow and emerge as an ephemeral spring; or recharge the aquifer, among others (Batres and Barahona, 2016).
In the control of the rate and capacity of infiltration, soil texture and structure, vegetation types, soil water content, soil temperature and precipitation intensity play an important role (Rivera and Dallatorre, 2018). In Mexico, the use of mathematical models to determine the rate of infiltration has been very little studied, most have been successful, depending on the type of model and soil characteristics to be evaluated (Green and Ampt, 1911; Singh et al., 2018). Mishra et al. (2003) indicate that, for the prediction of infiltration, different equations have been created, which can be classified into three types of models 1) physical, they are deduced from the law of conservation of masses and Darcy’s law; 2) semi-empirical; they consist of simple hypotheses about the infiltration rate and the infiltration ratio; and 3) empirical, they are based on field data and laboratory experiments.
The latter being considered for the modeling of infiltration in the Andosol-type soil. The objective of this study was to predict the infiltration process from data obtained in the field with the double-ring infiltrometer methodology, in four areas under two land uses: one area with a forest vocation and two agricultural crops under two types of management in an Andosol-type soil in Uruapan, Michoacán. Based on the observed data, the goodness of fit of three empirical models for the estimation of infiltration was evaluated and compared (Horton, Kostiakov and Mezencev), using statistical indicators.
Materials and methods
Study area
The research was carried out in the Ejido de Toreo El Alto in the municipality of Uruapan, Michoacán, located in the southern part of the Sierra Purépecha, between north latitude 19° 28’ 22.2” and west longitude 102° 00’ 19.7”. It is located on the Transversal Neo-volcanic Axis at an altitude of 1 890 meters above sea level and belongs to the Balsas River region. The climate in the area is temperate semi-warm humid, with abundant rainfall in summer and a percentage of winter rainfall less than 5% (A) C (m) (w) (García, 1981), with an average annual temperature of 16 °C and an average annual rainfall of 1 500 mm. The dominant soil is Andosol they have low bulk density and high water-holding capacity (Alcalá et al., 2001).
Experimental design
Four plots of 100 m2 were established under two land uses: one area with a forest vocation and two agricultural (two avocado cultivation plots [under organic and conventional management] and one more macadamia plantation plot with organic management). Which are described below: a) Forest: according to Rzedowski’s (2006) classification, the type of vegetation is a coniferous forest represented by a mixture of species of the genus Pinus and Quercus, among them stand out: Pinus devoniana Lindley, Pinus pseudostrobus Lindl, Pinus lawsonii Roezl, Pinus leiophylla Schl. & Cham, Quercus rugosa Neé, Quercus laurina Humb et Bonpl, Arbustus xalapensis Kunth and Fraxinus udheii (Wenz) Lingelsh, this corresponds to an unmanaged non-contemporary forest, with a density of 600 trees per hectare; b) Agricultural: two types of crops were evaluated, two avocado orchards (Persea americana Mill var. Hass) with conventional and organic management and one organic macadamia orchard (Macadamia integrifolia Maiden & Betche). The plantations have an average age of 60 years, although there are individuals 5-10 years of age after the health management in the areas. The plantation used for the three agricultural plots was of real-frame type (10 x 10) with a density of 100 trees per hectare and an average production of 15, 6.25 and 3.2 t ha-1, respectively.
Organic management does not involve the use of chemicals (fertilizers and pesticides) and only uses bovine compost, with a dose of 25 kg per tree (2 500 kg ha-1) placed in partial shade every three years. While conventional management includes the use of pesticides and practices such as pruning, agricultural tasks and chemical fertilization (copper sulfate pentahydrate [CuSO4.5H2O] and Urea [CO (NH2)2] with formula of foliar application 20N-30P-10K, complemented with macro and micronutrients (S-1.6%, Mg-0.8%, Fe-0.05%, Cu, Mn, B, Zn and Mo at 0.01%). Some important characteristics of the Andosol soil that influence hydrological processes are presented in Table 1.
Table 1 Average values of the characteristics of the Andosol soil in the evaluated plots.
| Plots | OM (%) | BD (g cm-3) | Textural class |
| Forest | 13.02 ±1.94 | 0.56 ±0.1 | CS |
| Conventional avocado | 16.41 ± 1.32 | 0.57 ±0.05 | CL |
| Organic avocado | 9.05 ± 1.2 | 0.82 ±0.12 | CS |
| Macadamia | 13.8 ± 2.32 | 0.69 ±0.06 | CS |
OM= percentage of organic matter; BD= bulk density, textural class; CS= sandy loam; CL= silty loam (Béjar et al., 2020).
Specifically, three repetitions were performed on each plot to measure infiltration in the field by the double-ring method; it should be noted that other studies have employed a similar number of repetitions (Landini et al., 2007; Tejedor, Neris and Jiménez, 2013; Weber and Apestegui, 2016; Luna et al., 2020). Infiltration tests were performed under the canopy at a minimum distance of 5 m from the stem. The size of the inner ring was 15 cm in diameter and 25 cm in height and the outer one 28 cm in diameter by 30 cm in height, the rings were inserted into the soil at a depth of 5 cm.
Once the test began, records (in cm) were made per minute for five minutes, every five minutes until the first hour of evaluation was completed, in the second hour, the measurements were made every 10 min, to finish, two readings every 15 min, for a total of 150 min (2.5 h). An initial sheet of 28 cm was used, when the water level reached 8 cm, the inner cylinder was recharged, depositing the water slowly, the outer cylinder was refilled when its level decreased. The measurement was made during the rainy season in June 2018, having averages of soil moisture of 60.6%.
Infiltration speed
The speed of infiltration is the ability with which water penetrates the soil. It is usually measured based on the depth (in mm) of the sheet of water that manages to penetrate the soil in an hour (Castellanos-Navarrete et al., 2013). To determine the infiltration rate, the following expression was used (Zhang et al., 2017; Yáñez-Díaz et al., 2019):
Where: f t is the infiltration rate (mm h-1), ∆I is the infiltration (cm), ∆t is the time during the infiltration period (min) and 600 is a conversion coefficient to mm h-1.
Accumulated infiltration
It considers the sum of the point values of infiltration obtained from the instantaneous infiltration speed curve. The equation of the accumulated infiltration is obtained by determining the area formed between this curve and the axes, that is, by integrating its equation between the limit values: tinitial= 0 and tfinal (Delgadillo and Pérez, 2016).
Basic infiltration
Initially, when applying water, the infiltration value is high and, as the water content in the soil increases, it gradually decreases until it reaches a constant value called the basic infiltration rate. The speed of water infiltration into the soil, at the moment in which the variation of this with respect to time is very slow and constant. Generally, this condition of infiltration is achieved when the soil has reached its field capacity (Delgadillo and Pérez, 2016). The basic infiltration was determined from the averages of the last three readings (120, 135 and 150 min) of the infiltration test (Yáñez-Díaz et al., 2019).
Infiltration models
After determining the rate of infiltration in the field (actual infiltration), three empirical models were fitted: Horton, Kostiakov and Mezencev, with the data obtained (Table 2). To determine the values of the parameters of the fitted models, the Microsoft Excel 2007 Solver add-in was used and by means of the least-squares method, the predictive values of the infiltration were calculated.
Table 2 Empirical models used for the determination of the infiltration rate.
| Model | Equation | Definition |
| Horton (1939) |
|
f t = instantaneous infiltration rate, t f b , f 0 and K f b are parameters determined by the model, in which f b is considered as infiltration capacity |
| Kostiakov (Weber and Apestegui, 2013) |
|
a and b are the determined parameters of the model, while t is time |
| Mezencev (Weber and Apestegui, 2013) |
|
a and b are parameters to be determined by the model, and b is the basic rate of infiltration |
In addition to determining the infiltration rate, the variables initial (Fi), final (Ff), basic (Fb) and accumulated (Fac) infiltration were also obtained. The Fi (mm h-1) corresponds to the infiltration rate at time 1, Ff (mm h-1) to the infiltration rate of minute 150, the Fb (mm h-1) was determined with the average of the last three readings of the infiltration rate and the Fac (mm) was calculated with the sum of the volume of infiltrated water of time 1 plus infiltrated water at time 2 until reaching time n.
Comparison and validation of models
The statistics for the comparison and validation of the models were the efficiency coefficient of the Nash-Sutcliffe model (NSE), Pearson’s coefficient (r) and mean absolute error (MAE). And they are expressed as follows: Efficiency coefficient of the Nash-Sutcliffe model (NSE):
Where: Obs i = observation data, SIM i = represents the simulation/model value and Obs = mean value of the observation. Pearson’s coefficient (r):
Where: n is the total set of data observed at the station, O and P are the observed data and the data model, respectively, and Pi y Oi are the average values of the model data and the observed data, respectively. Mean absolute error (MAE):
Where: n = the number of errors, |Oi - Pi| = absolute errors.
Statistical analysis
The data obtained from the field (Fi, Ff, Fb y Fac) were applied a test of normality (Shapiro-Wilk) and homogeneity of variance (Levene), meeting the assumptions, an analysis of variance of one factor (Anova) was carried out and then a comparison of means (Tukey p≤ 0.05) to determine significant differences in infiltration between the different land uses. All statistical analyses were performed using the version 13.0 of the SPSS software (SPSS Inc., Chicago, IL), with a confidence level of p≤ 0.05.
Results and discussion
Infiltration in the field
According to Anova between land uses, there were significant differences (p≤ 0.05) for the variables Fi, Ff, Fb and Fac with a significance level of 0.003, 0.000112, 0.000138 and 0.001, respectively. The variables were analyzed by a Tukey test (p≤ 0.05) to describe their behavior, where conventional avocado showed a decrease of 67, 71, 71 and 68% in the initial, final, basic and accumulated infiltration, with respect to forest use that had the highest values of the hydrological variables evaluated (Table 3).
Table 3 Mean values of the hydrological variables in the evaluated plots.
| Plots | Hydrological variables | |||
| Fi (mm h-1) | Ff (mm h-1) | Fb (mm h-1) | Fac (mm) | |
| Forest | 1 880 a | 863.47 a | 885.92 a | 2 793.29 a |
| Conventional avocado | 620 b | 248.27 b | 254.83 b | 872.49 b |
| Organic avocado | 800 bc | 404.4 bc | 413.63 bc | 1 242.26 bc |
| Macadamia | 1 460 ac | 506.53 c | 519.46 c | 1 756.72 ac |
Fi= initial infiltration; Ff= final infiltration; Fb= basic infiltration; Fac= accumulated infiltration. Different letters represent significant differences (Tukey p≤ 0.05).
The results present significant variations between the different land uses, particularly, decreases in infiltration of agricultural use with respect to the forest one is observed, Florez et al. (2009) found similar trends evaluating the behavior of infiltration under agricultural, livestock and native vegetation systems, defining that land-use changes affect the physical and hydrological variables of the soil resource in the short term.
According to the results, the agricultural use with conventional management presented the lowest values of infiltration (Table 3), and it can be attributed to the use of the different mechanized practices (sanitation pruning, fruit collection and mechanized fertilization), which increase the bulk density in the surface part of the soil, reducing the size of pores and thereby causing effects on infiltration, and other processes such as soil losses due to runoff (Bravo-Espinoza et al., 2014).
The results of the initial infiltration of the present investigation are similar to those obtained by García-Hernández et al. (2008), who found infiltration rates in pine forest and oak forest of 1920 and 1320 mm h-1, respectively, in the Sierra Gorda de Querétaro, noting that the speed with which water is infiltrated into the soil varies according to soil conditions and vegetation cover, so that changes in land use can have a more significant impact on variables related to infiltration such as bulk density, porosity, texture, among others. In this sense, Zemke et al. (2019) evaluated undisturbed and disturbed areas of pine forest and found infiltration values of 2 622 and 935 mm h-1, respectively, these reductions are mainly attributed to increases in the bulk density variable and modification of soil cover.
Land cover slows the speed of runoff and directly affects infiltration and surface runoff time (Panachuki et al., 2011). De Almeida et al. (2018) point out that infiltration depends directly on land use, finding that tillage activities have a greater effect. Specifically, infiltration tends to be lower in areas under bare soil than in areas under conservation systems, coinciding with infiltration rates of conventional use, where land cover is lower than in the other agricultural uses and forest area.
Table 4 shows the descriptive values of the infiltration process evaluated for each of the plots. In general, the order of the hydrological variables (Fi, Ff, Fb y Fac) for the different land uses was as follows: forest> macadamia> organic a.> conventional a.
Table 4 Descriptive values for the hydrological variables assessed in the evaluated plots.
| Variable | Plots | Median | Variance | SD | Min | Max |
| Fi | Forest | 1 920 | 15 600 | 124.9 | 1 740 | 1 980 |
| Conventional avocado | 600 | 1 200 | 34.6 | 600 | 660 | |
| Organic avocado | 840 | 15 600 | 124.9 | 660 | 900 | |
| Macadamia | 1 200 | 310 800 | 557.5 | 1 080 | 2 100 | |
| Ff | Forest | 891.2 | 5 876.7 | 76.7 | 776.8 | 922.4 |
| Conventional avocado | 254 | 193.7 | 13.9 | 232.4 | 258.4 | |
| Organic avocado | 407.2 | 1 786.7 | 42.3 | 360.8 | 445.2 | |
| Macadamia | 504.4 | 19 828.1 | 140.8 | 366.8 | 648.4 | |
| Fb | Forest | 907.5 | 5 318 | 72.9 | 804.6 | 945.6 |
| Conventional avocado | 260 | 155 | 12.5 | 240.6 | 263.9 | |
| Organic avocado | 419.6 | 2 034.5 | 45.1 | 365.8 | 455.5 | |
| Macadamia | 509.1 | 23 395.6 | 153 | 372 | 677.3 | |
| Fac | Forest | 2 660.2 | 6 914.7 | 26.6 | 262.8 | 309.9 |
| Conventional avocado | 868.6 | 2 513.3 | 15.5 | 85.5 | 89.6 | |
| Organic avocado | 1 311.1 | 1 714.3 | 13.4 | 109.7 | 132.1 | |
| Macadamia | 1 550.8 | 4 732.3 | 68.6 | 119.7 | 252.2 |
Fi= initial infiltration; Ff= final infiltration; Fb= basic infiltration; Fac= accumulated infiltration; SD= standard deviation; Min= minimum; Max= maximum.
Tomé et al. (2015) evaluated the influence of land-use change in Andosols in Tenerife, Canary Islands, where they compared with the natural vegetation, finding very high Fbs, fluctuating from 123 to 725 mm h-1. In the case of areas with modified covers, the Fb descreases from 98 to 91 mm h-1, these values, unlike those presented here, differ widely in units, but present the same decreasing trend when modifying the natural vegetation and therefore the important edhapic variables in hydrological processes such as bulk density, porosity and permeability.
The infiltration decreases as time passes, during the first minutes the infiltration is fast, in the 90 th minute it begins to reduce, where the greatest stability is appreciated; however, it is notable that the decrease of this is still active in smaller ranges, this can be associated with the period of taking readings (Figure 1).
Delgado et al. (2017) mention that the intervention of conservation activities in degraded areas represents an effective strategy for the improvement of the soil-water-vegetation resource. On the other hand, Yáñez-Díaz et al. (2019) evaluated the effect of land-use change on a Vertisol in northeastern Mexico, finding infiltration rates for an area of Tamaulipan thornscrub of 226.5 mm h-1, grassland 56.6 mm h-1, agriculture 347.9 mm h-1 and a eucalyptus plantation 269 mm h-1, they mention that anthropogenic activities determine the functioning of the soil system.
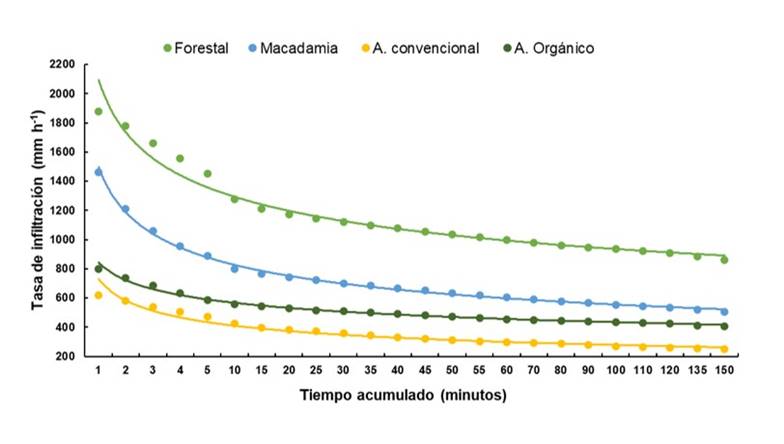
Figure 1 Curves of infiltration observed in the evaluated plots (a. conventional= conventional avocado and a. organic= organic avocado).
Moro et al. (2005) evaluated in Argentina the infiltration of a udic Argiustoll soil under different systems of use, in a natural forest and different management systems, observing that the infiltration rate decreases from the natural forest 324.2 mm h-1 to conventional tillage with 90.5 mm h-1. Leyva et al. (2018) measured infiltration in Cuba on a Luvisol under different systems of use grove (natural), natural and cultivated pastures and silvopastoral, finding an infiltration of 680, 590, 450 and 750 mm h-1, respectively. This demonstrates the negative impact generated by conventional management and the conversion of forest land to agricultural systems on any type of soil, reducing the capacity of infiltration in them.
Infiltration models
Of the models compared, Kostiakov is the one that best predicts the infiltration rate. In general, it presented values for R2 of 0.98, contrary to Horton’s model that presented R2 of 0.8 to 0.92 (Table 5). According to Haghighi et al. (2010), Horton’s model commonly presents the greatest errors in the calculation of the infiltration rate, and Kostiakov is the best fit in soils with high sand and silt contents. Zakwan et al. (2016) used various models for the determination of infiltration with the generalized reduced gradient (GRG) tool of Solver in sandy loam soils in Umuahia, Nigeria and document that the model with the best fit is Kostiakov, based on the data obtained from the field. Andosol soils generally have high content of sands and silts, therefore, the fit of Kostiakov’s model coincides with the above.
The Fb of the data observed for forest use in repetition I, II and III were 804.6, 907.5 and 945.6 mm h-1, the estimates with Horton presented values of 893.9, 935.2 and 1 010.9 mm h-1, observing that the model overestimates these values, Mezencev’s model uses both predictive variables and constant values, in this case, the value of Fb used for the calculation of infiltration was that determined by the observed data.
Table 5 Infiltration parameters obtained from the models.
| Plots | Repetition | Horton | Kostiakov | Mezencev | ||||||||||
| Fb | F0 | K | R2 | a | b | R2 | Fb | a | b | R2 | ||||
| Forest | I | 893.9 | 1904.4 | -0.09 | 0.9 | 1971.2 | -0.18 | 0.98 | 804.6 | 1293.7 | -0.51 | 0.94 | ||
| II | 935.2 | 1775.8 | -0.11 | 0.88 | 1748.7 | -0.15 | 0.98 | 907.5 | 980.3 | -0.6 | 0.91 | |||
| III | 1010.9 | 1838 | -0.04 | 0.91 | 2036.4 | -0.14 | 0.98 | 945.6 | 1180.2 | -0.42 | 0.96 | |||
| Conventional Avocado | I | 301.1 | 553.6 | -0.08 | 0.9 | 579.5 | -0.15 | 0.98 | 263.8 | 354.7 | -0.47 | 0.95 | ||
| II | 250.8 | 586.1 | -0.03 | 0.91 | 667.5 | -0.19 | 0.98 | 240.6 | 445.9 | -0.42 | 0.95 | |||
| III | 258.6 | 627 | -0.06 | 0.91 | 693.7 | -0.21 | 0.98 | 260 | 490.4 | -0.48 | 0.94 | |||
| Organic Avocado | I | 378.6 | 610.3 | -0.04 | 0.92 | 658.6 | -0.12 | 0.98 | 365.8 | 323.3 | -0.45 | 0.95 | ||
| II | 504.7 | 939.3 | -0.25 | 0.83 | 800.7 | -0.12 | 0.98 | 455.4 | 411.5 | -0.53 | 0.93 | |||
| III | 453.6 | 848.7 | -0.07 | 0.9 | 891.5 | -0.16 | 0.98 | 419.6 | 534.4 | -0.51 | 0.94 | |||
| Macadamia | I | 778.2 | 1770.3 | -0.05 | 0.92 | 1999.5 | -0.21 | 0.98 | 677.3 | 1454.8 | -0.48 | 0.94 | ||
| II | 412.3 | 1226.2 | -0.26 | 0.82 | 987.7 | -0.22 | 0.98 | 371.9 | 741.8 | -0.68 | 0.89 | |||
| III | 569.9 | 1475.7 | -0.35 | 0.8 | 1091.7 | -0.17 | 0.98 | 509.1 | 720.1 | -0.63 | 0.9 | |||
Fb= basic infiltration, K, a, b and F0= parameters determined by the models (where: F0 and a represent the initial infiltration determined by the model); R2= coefficient of determination.
According to the results, the three models can predict the infiltration process, fitting significantly; however, in Kostiakov’s model, the statistic of the coefficient of determination (R2) stands out in all infiltration tests, with values close to 1. It is notable that Kostiakov’s model is the one that predicts a better infiltration rate, since it represents the values closest to the actual infiltration, while Horton and Mezencev overestimate such values. This coincides with Luna et al. (2020), who fitted the same models to an Umbrisol-type soil subjected to forest management, obtaining coefficients of determination similar to those of the present study. Several authors use statistical indicators as an object of validation of simulation models for the evaluation of infiltration (Alega et al., 2016; Sihag and Singh, 2018; Suryoputro et al., 2018).
The NSE and r indices reached values above 0.9 for all models as well as land uses, while the MAE was high for all models, indicating a good fit of the observed data with respect to the simulated ones. The range in which the NSE statistic is located is considered optimal according to Zakwan et al. (2016). On the other hand, Kostiakov’s model presented the highest NSEs and r and the lowest MAE, which makes it the best prediction model for water infiltration in Andosol soils (Table 6).
Alega et al. (2016) mention that statistical indices make it possible to assess the accuracy of infiltration models. Suryoputro et al. (2018) evaluated the efficiency of the fit of infiltration models in different land uses: settlements, plantation, rice cultivation and forest, finding an NSE of 0.68, 0.73, 0.91 and 0.49, respectively, using the Kostiakov, Kostiakov-Lewis and Green-Ampt models, with R2 of 0.52 to 0.94.
Table 6 Mean values of the statistical indicators of the models in the evaluated plots.
| Models | Variable | Plots | |||
| Forest | Conventional a. | Organic a. | Macadamia | ||
| Horton | NSE | 0.95 | 0.95 | 0.93 | 0.92 |
| r | 0.98 | 0.97 | 0.96 | 0.96 | |
| MAE | 50.67 | 17 | 22.38 | 52.99 | |
| Kostiakov | NSE | 0.98 | 0.98 | 0.97 | 0.95 |
| R | 0.99 | 0.99 | 0.99 | 0.98 | |
| MAE | 32.73 | 12.75 | 11.09 | 33.77 | |
| Mezencev | NSE | 0.93 | 0.91 | 0.94 | 0.97 |
| r | 0.97 | 0.96 | 0.97 | 0.99 | |
| MAE | 61.92 | 27.32 | 20.85 | 33.5 | |
NSE= efficiency coefficient of the Nash-Sutcliffe model; r= Pearson’s coefficient and MAE= mean absolute error.
In general, the results of the present study yielded statistics that allow establishing the effectiveness of the models for the prediction of infiltration applied to the andosol-type soil. Sihag and Singh (2018) determined that Kostiakov’s model presents the best fit and NSE (0.99), coinciding with the values of the present study. On the other hand, Bayabil et al. (2019) found that Horton and Kostiakov models more efficiently predict infiltration, finding fit values of R2 and NSE of 0.97, compared to the present research, the values obtained are similar.
Conclusions
Changes from forest land use to agricultural uses caused changes in the hydrological variables of the soil resource. These changes are influenced by the different agricultural practices used and the edaphic characteristics of the evaluated plots. In this sense, the textural classes for the 2 organic plots and forest use were sandy loam, while conventional use presented a silty loam class, being particularly the area where low infiltration was present.
The hydrological variables of the infiltration process (Fi, Ff, Fb and Fac) presented the following decreasing order: forest> macadamia> organic avocado> conventional avocado. It is important to note that the change of land use from forest cover to agricultural crops generates negative impacts on infiltration, but the application of conservation activities, such as organic management, represents an alternative for the mitigation of this impact on the infiltration of water into the soil, regulating the soil-water-vegetation interaction.
According to the results obtained by the statistical indicators (NSE, r, MAE and R2), Kostiakov’s model is highly efficient in describing the behavior of infiltration in Andosol soils. However, Horton and Mezencev also adequately describe such parameters. Infiltration models can be considered as a tool for decision making, since the models comply with a degree of fit o the actual data and can be used for the prediction of infiltration in Andosol soils under different covers.
Literatura citada
Alcalá, M. J.; Ortiz, C. A. y Gutiérrez, M. D. C. 2001. Clasificación de los suelos de la meseta tarasca, Michoacán. Terra Latinoam. 19(3):227-239. [ Links ]
Alega, A. M. G. 2016. Evaluación de tres modelos en la estimación de la infiltración acumulada. Rev. Ingen. Agríc. 6(3):41-47. [ Links ]
Batres, C. A. y Barahona-Palomo, M. 2016. Comparación de tres métodos de infiltración para calcular el balance hídrico del suelo, en la cuenca del río suquiapa, El salvador. UNED research journal/cuadernos de investigación UNED. 9(1):23-33. [ Links ]
Bayabil, H. K.; Dile, Y. T.; Tebebu, T. Y.; Engda, T. A. and Steenhuis, T. S. 2019. Evaluating infiltration models and pedotransfer functions: implications for hydrologic modeling. Geoderma. 338:159-169. https://doi.org/10.1016/j.geoderma.2018.11.028. [ Links ]
Bejar, P. S. J.; Cantú, S. I.; Yáñez, D. M. I. y Luna, R. E. O. 2020. Curvas de retención de humedad y modelos de pedotransferencia en un Andosol bajo distintos usos de suelo. Rev. Mex. Cienc. Forest. 11(59):31-50. https://doi.org/10.29298/rmcf.v11i59.666. [ Links ]
Bravo‐Espinosa, M.; Mendoza, M. E.; Carlón Allende, T.; Medina, L.; Sáenz‐Reyes, J. T. and Páez, R. 2014. Effects of converting forest to avocado orchards on topsoil properties in the trans‐Mexican volcanic system, Mexico. Land Degradation & Development. 25(5):452-467. https://doi.org/10.1002/ldr.2163. [ Links ]
Burgos, A.; Anaya, C. y Cuevas, G. 2012. Impacto ecológico del Cultivo de Aguacate a nivel regional y de parcela en el estado de Michoacán: definición de una tipología de productores, etapa II. Informe final, Fundación Produce Michoacán. Centro de Investigaciones en Geografía Ambiental- Universidad Nacional Autónoma de México (UNAM). Morelia, Michoacán, 125 p. [ Links ]
Castellanos-Navarrete, A.; Chocobar-Guerra, A.; Cox, R.; Fonteyne, S.; Govaerts, B.; Jespers, N. y Verhulst, N. 2013. Infiltración: guía útil para comparar las prácticas de manejo de cultivo. Centro Internacional del Maíz y Trigo (CIMMYT). México, DF. 8 p. [ Links ]
Chávez, L. G.; Tapia, V. L. M.; Bravo, E. M.; Sáenz, R. J.; Muñoz, F. H. J.; Vidales F. I. y Mendoza C. M. 2012. Impacto de cambio de uso de suelo forestal a huertos de aguacate. (Ed.). Instituto Nacional de Investigaciones Forestales, Agrícolas y Pecuarias (INIFAP)- Centro de Investigación Pacífico Centro-Campo Experimental Uruapan. Libro técnico núm. 13. 76 p. [ Links ]
De Almeida, W. S.; Panachuki, E.; De-Oliveira, P. T. S.; Da-Silva, M. R.; Sobrio, T. A. and de Carvalho, D. F. 2018. Effect of soil tillage and vegetal cover on soil water infiltration. Soil Tillage Res. 175:130-138. http://dx.doi.org/10.1016/j.still.2017.07.009. [ Links ]
Delgadillo, O. y Pérez, L. 2016. Medición de la infiltración del agua en el suelo. Centro andino para la gestión y uso del agua. Centro agua. Facultad de Ciencias Agrícolas, Pecuarias y Forestales Universidad Mayor de San Simón. Cochabamba, Bolivia. 31 p. [ Links ]
Delgado, M. I.; Gaspari, F. J. y Senisterra, G. E. 2017. Respuesta a la infiltración en distintos complejos suelo-vegetación en las sierras de Ventania, Argentina. Rev. Tecnología. 16(1):157-168. http://hdl.handle.net/11336/56680. [ Links ]
Florez, F. H.; Triana, F. A. y Torrez, M. C. D. 2009. Efecto de actividades agropecuarias en la capacidad de infiltración de los suelos del páramo del sumapaz. Ingeniería de Recursos Naturales y del Ambiente. 8:29-38. https://www.redalyc.org/pdf/2311/ 231116390004.pdf. [ Links ]
Galicia, L. 2014. El cambio de uso de suelo: consecuencias en el ciclo hidrológico y la disponibilidad de agua. AZ. Rev. Educ. Cult. 82:15-18. [ Links ]
García-Hernández, M. A.; García-Hernández, M. A.; Castellano-Vargas, I.; Cano-Santana, Z. y Peláez-Rocha, C. M. 2008. Variación de la velocidad de infiltración media en seis ecosistemas inalterados. Terra Latinoam. 26(1):21-27. [ Links ]
Green, W. H. and Ampt, G. A. 1911. Studies on Soil Phyics. The J. Agric. Sci. 4(1):1-24. https://doi.org/10.1017/S0021859600001441 [ Links ]
Haghighi, F.; Gorji, M.; Shorafa, M.; Sarmadian, F. and Mohammadi, M. H. 2010. Evaluation of some infiltration models and hydraulic parameters. Spanish J. Agric. Res. 8(1):210-217. [ Links ]
Horton, R. E. 1939. Analysis of runoff-plot experiments with varying infiltration capacity, transactions American Goephysical union, Washington. 693-711. [ Links ]
Landini, A. M.; Martínez, D. A.; Días, H.; Soza, E.; Agnes, D. y Sainato, C. M. 2007. Modelos de infiltración y funciones de pedotransferencia aplicados a suelos de distinta textura. Rev. Cienc. Suelo. 25(2):123-131. [ Links ]
Leyva, R.; Laura, S.; Baldoquín, P. y Reyes, O. 2018. Propiedades de los suelos en diferentes usos agropecuarios, las tunas, Cuba. Rev. Cienc. Agríc. 35(1):36-47. http://dx.doi.org/10.22267/ rcia.183501.81. [ Links ]
Luna, R. E. O.; Cantú, S. I.; Yáñez, D. M. I.; González, R. H.; Marmolejo, M. J. G. y Béjar P. S. J. 2020. Ajuste de modelos empíricos de infiltración en un umbrisol bajo diferentes tratamientos silvícolas. Rev. Mex. Cienc. Forest. 11(57):132-152. https://doi.org/10.29298/ rmcf.v11i57.643. [ Links ]
Mishra, S. K.; Tyagi, J. V. and Singh, V. P. 2003. Comparison of infiltration models. Hydrological Processes. 17(13):2629-2652. https://doi.org/10.1002/hyp.1257. [ Links ]
Moro, E. C.; Ingaramo, O. E.; Venialgo, C. A. y Gutiérrez, N. C. 2005. Infiltración en un argiustol undico con diferentes sistemas de uso en el departamento 9 de Julio-Chaco. Agrotecnia. 14:14-18. [ Links ]
Panachuki, I.; Bertol, T.; Alves, P. T. S.; Oliveira, D. B. B. y Rodrigues, B. 2011. Perdas de solo e de água e infiltração de água em latossolo vermelho sob sistemas de manejo. Rev. Bras. Ciênc. Solo. 35(5):1777-1785. http://dx.doi.org/10.1590/S0100-06832011000500032. [ Links ]
Regüés, D.; Serrano-Muela, P.; Nadal-Romero, E. y Lana-Renault, N. 2012. Análisis de la variabilidad temporal de la infiltración en un gradiente de degradación de usos del suelo en el pirineo central. Cuaternario y Geomorfología. 26(1-2):9-28. [ Links ]
Rivera, J. S. Ú. y Dallatorre, Y. D. 2018. La infiltración del agua en los suelos y componentes artificiales y materia orgánica que se utilizan en ellos para la agricultura. Rev. Iberoamérica. Bioeconomía y Cambio Climático. 4(7):889-896. http://dx.doi.org/10.5377/ ribcc.v4i7.6299. [ Links ]
Rzedowski, J. 2006. Vegetación de México. 1ª Edición, Limusa (Ed). 382 p. [ Links ]
Sihag, P. and Singh B. 2018. Field evaluation of infiltration models. Sci. Technical J. 4(2):3-12. http://doi.org/10.5281/zenodo.1239447. [ Links ]
Singh, B.; Sihag, P. and Singh, K. 2018. Comparison of infiltration models in NIT Kurukshetra campus. Appl. Water Sci. 8(2):63-70. https://doi.org/10.1007/s13201-018-0708-8. [ Links ]
Suryoputro, N.; Soetopo, W.; Suhartanto, E. S. and Limantara, L. M. 2018. Evaluation of infiltration models for mineral soils with different land uses in the tropics. J. Water Land Development. 37(1):153-160. https://doi.org/10.2478/jwld-2018-0034. [ Links ]
Tejedor, M.; Neris, J. y Jiménez, C. 2013. Propiedades del suelo que controlan la infiltración en suelos volcánicos (Tenerife, España). Rev. Socied. Cienc. Suel. América. 77(1):202-212. https://doi.org/10.2136/sssaj2012.0132. [ Links ]
Tomé, J. N.; Cerezal, J. C. S.; Prieto, F. P.; Pérez, J. A. y Villegas, P. G. 2015. Hidrología, erosión y restauración de suelos volcánicos afectados por incendios forestales: experiencia en las islas canarias. In: restauración de la cubierta vegetal y de espacios degradados en la región de macaronesia. Colegio de Ingenieros de Montes. Madrid, España. 279-294 pp. [ Links ]
Weber, J. y Apestegui, L. 2013. Parámetros del modelo de infiltración de green y ampt en suelos de la ciudad de Córdoba, Argentina. Cuadernos del CURIHAM. 19:87-103. [ Links ]
Weber, J. F. y Apestegui, L. 2016. Relaciones entre parámetros de los modelos de infiltración de Kostiakov y Lewis-Kostiakov-Córdoba, Argentina. Tecnología y Ciencias del Agua. 7(2):115-132. [ Links ]
Yáñez‐Díaz, M. I.; Cantú‐Silva, I.; González‐Rodríguez, H. and Sánchez‐Castillo, L. 2019. Effects of land use change and seasonal variation in the hydrophysical properties in vertisols in northeastern Mexico. Soil Use and Management. 35(3):378-387. https://doi.org/10.1111/ sum.12500. [ Links ]
Zakwan, M.; Muzzammil, M. and Alam, J. 2016. Application of spreadsheet to estimate infiltration parameters. Perspec. Sci. 8:702-704. https://doi.org/10.1016/j.pisc.2016.06.064. [ Links ]
Zhang, J.; Lei, T.; Qu, L.; Chen, P.; Gao, X.; Chen, C. and Su, G. 2017. Method to measure soil matrix infiltration in forest soil. J. Hydrol. 552:241-248. http://dx.doi.org/10.1016/ j.jhydrol.2017.06.032. [ Links ]
Zemke, J. J.; Enderling, M.; Klein, A. and Skubski, M. 2019. The influence of soil compaction on run of formation. A case study focusing on skid trails at forested andosol sites. Geosciences. 9(204):2-14. https://doi.org/10.3390/geosciences9050204. [ Links ]
Received: July 01, 2021; Accepted: October 01, 2021
 Este es un artículo publicado en acceso abierto bajo una licencia Creative Commons
