


Servicios Personalizados
Revista
Articulo
 texto en
  Inglés (pdf)
 Artículo en XML
 Referencias del artículo
 Enviar artículo por email
Indicadores
-
 Citado por SciELO
 -
 Accesos
Links relacionados
-
 Similares en
SciELO
Similares en
SciELO
Compartir

 Permalink
Tecnología y ciencias del agua
versión On-line ISSN 2007-2422
Tecnol. cienc. agua vol.11 no.5 Jiutepec sep./oct. 2020 Epub 10-Jun-2024
https://doi.org/10.24850/j-tyca-2020-05-06
Articles
Effects of water rights allocation on water resources availability within the Ñuble River Basin, South Central Chile

1Departamento de Geografía, Universidad de Concepción, Concepción, Chile, ivanbelmarvejar@gmail.com
2Departamento de Geografía & Mountain Geoscience Group, Universidad de Concepción, Concepción, Chile, alfernandez@udec.cl
3Departamento de Geografía & Mountain Geoscience Group, Universidad de Concepción, Concepción, Chile, glealparra@gmail.com
In this study, we analyze water availability for allocation of water rights in the Ñuble River Basin, Chile. The methods include evaluation of the natural regime, determination of current water demand, and calculation of a water budget. Water availability was calculated using TRMM and instrumental records from rainfall and discharge gauges. Water demand was computed from a new inventory of water rights records developed for this study. Results reveal a hydrological deficit. More specifically, May and October showed the highest deficit, with 7.8 m3/s for permanent water rights and 63.7 m3/s for sporadic water rights. In order to reduce this deficit the method to allocate water right should include better estimations of hydrological balances by incorporating updated and validated water rights records and more hydrometeorological instrumentation in mountain watersheds. Furthermore, we assert that the government must play a bigger role in efficient water management, considering the present scenario of more frequent droughts.
Keywords: Water rights; water availability; hydrological balance
Se analiza la disponibilidad de agua para la constitución de derechos de aprovechamiento de la misma en la cuenca del río Ñuble, Chile, utilizando una metodología que evalúa el recurso en régimen natural, determina la demanda existente y genera un balance hídrico. Para el cálculo de la oferta hídrica se utilizaron registros de precipitación de la misión TRMM (por sus siglas en inglés, Misión de Medición de Precipitaciones Tropicales), a lo que se suman registros instrumentales de estaciones fluviométricas y pluviométricas. Para la demanda se realizó un análisis de la totalidad de los derechos concedidos en el área de estudio. Los resultados revelan la existencia de déficit hídrico. Específicamente, existe un sobreotorgamiento de derechos de agua entre los meses de octubre y mayo, con déficits de hasta 7.8 m³/s para derechos de ejercicio permanente y 63.7 m³/s, sumando los derechos de ejercicio eventual. Una mejora en el otorgamiento de derechos debiera contemplar estimaciones más confiables de balance hídrico, incorporando registros actualizados y validados de derechos de agua, y más estaciones hidrometeorológicas en cuencas de gran altitud. Además, se propone que es necesario que el Estado cuente con mayores atribuciones para una gestión eficiente del agua, en un escenario hidroclimático con sequías cada vez más recurrentes.
Palabras clave: derechos de agua; disponibilidad de agua; balance hídrico
Introduction
Since 2010, an extensive region of central Chile (~30°S to 39°S) has suffered one of its hottest and driest periods in the last 100 years (CR2, 2015), with a hydrological deficit that has strongly impacted agricultural and energy activity, and water availability for human consumption (Garreaud et al., 2017). Although it is known that droughts have regularly affected this region (Muñoz et al., 2016), there exists a high probability that a significant part of these droughts are consequence of anthropogenic climate change (Boisier, Rondanelli, Garreaud, & Muñoz, 2016). This suggests that in the future, these events may become part of the normal hydrological regime, exacerbating the deficit through evaporation from lakes, reservoirs and crops.
What was presented in the previous paragraph directly relates with the natural hydrological regime in which precipitation (both liquid and solid) feeds rivers and aquifers and, therefore, determine water supply. Another component of this problem is the water demand. In Chile, access to superficial water is dictated by the Water Code of 1981. This legal framework, in charge of regulating the use of water resources, has operated as a source of private rights over the territory (Bolados, Henríquez, Ceruti, & Sánchez, 2017), reinforcing productive use of the resource, and is guided by the free market theory, assigning a subsidiary role to the government (Ugarte, 2003). The Water Code defines Water Rights as the element that allows exploitation of Water: Water Rights are given free of charge; are perpetual, can be separated from the land ownership rights (Budds, 2012; Bolados et al., 2017), and can be traded within a water market (Vergara, 2015; Costa, 2016). In this sense, the concept of a consumptive Water Right is particularly relevant; according to the 13th article of the Chile’s Water Code (Ministerio de Justicia, 2018): “are those who allow their holder complete consumption of the allocated water”.
Today, a reform to this code is being discussed, where prioritization of water use for human consumption, the protection of areas of environmental importance, and the strengthening of administrative attributions are emphasized. However, critical matters in the proposed reform include effects over the current allocated Water Rights, the duration of concessions, causes to withdraw Water Rights, and the difficulty in the application of ecological flows (González, 2017).
On the other hand, Vergara (2015) recognizes a notable weakness in the current Chilean system, in which there still exists a large proportion of Water Rights that are recognized, yet not registered or regularized in the public cadaster. The former indicates that the method of assignation of the resource is inefficient due to uncertainty in the data (Bolados et al., 2017), which can generate errors in the granting of new Water Rights, directly impacting water availability.
An improvement in the Water Right databases would translate into a more precise availability analysis. This becomes indispensable in a reform context, since the goal is for the government to steward the existence of sufficient streamflow in natural sources, ensuring scenic, landscape, environmental and social functions.
This work aims to evaluate, based on information present in the sources of public entities in Chile, the availability for the assignation of new consumptive Water Rights in the Ñuble River Basin, in South-Central Chile. This analysis of the Water Rights indicates that some of them are not in the register of their constitution expedients, and therefore their existence is uncertain. This work develops a methodology that allows the inclusion of these possible Water Rights. This research used two flow scenarios of Water Rights: one in which only the Water Rights that contained verified flow information, and another in which these Water Rights were analyzed in conjunction with the Water Rights on which there is not certainty of their constitution. These two scenarios allow the evaluation of the sensibility of the Ñuble River Basin to an extreme situation where all the consumptive Water Rights are completely claimed, considering that an increase in water use while facing incremental shortages can generate conflicts (Valdés-Pineda et al., 2014).
Materials and methods
Study area
The study area encompasses the Ñuble River Basin, which contains 38.6% of the total area of the region where it is located. Its main economic activities are agriculture and silviculture (DGA, 2004b), and it is here where the 12th most populated city in Chile is found (about 200,000 inhabitants), the city of Chillan (MINVU, 2002). It is located between coordinates 36.29°S and 37.33°S and between 71°W and 72.46°W, in the Ñuble region, in south-central Chile (Figure 1).
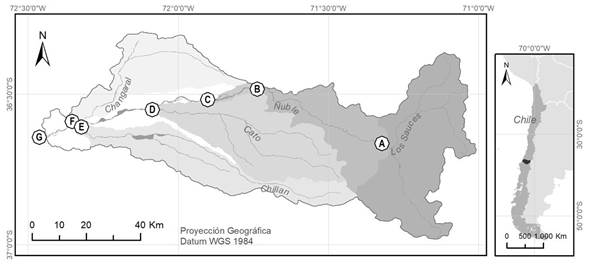
Figure 1 Study Area Ñuble River Basin, sub-basins and control points. The sub-basins are shown with grey tones and are labelled using the name of the corresponding river.
The Ñuble River, with a length of 155km, has a basin area of 5097 km² (DGA, 2004b).
The eastern part of the study area is situated in the Andes mountain, and the western part in the central valley, which is a strip in the Chilean topography that, due to its extension and as a continuous relatively flat area, facilitates the settlement of a great part of the population (Universidad de Chile, n.d.).
This basin, influenced by a Mediterranean climate, presents at least two consecutive months of summer with hydrological deficit, a period in which there is higher demand for water resources. In 1991, the basin presented a total of 1119 canals, which served for the irrigation of 562 km², equivalent to 11% of its total surface area (DGA, 2004b).
The area of study was divided into seven control points where water availability was determined: the mouths of the Cato, Chillan, Changaral, and Ñuble rivers (D, E, F y G in Figure 1), in addition to three additional points of interest in the Ñuble River (A, B y C in Figure 1). The points situated at the outlets were selected because they are the most influential affluents (DGA, 2004b); the points in the Ñuble River were chosen because they present Water Rights with conceded flows of great magnitude in its contributing sub-basins.
Water availability evaluation
For the evaluation, a balance between demand and supply of water must be conducted, which results in the availability of flow for the constitution of new Water Rights in the evaluated points (DGA, 2008). This was evaluated for the Water rights of permanent use and those of non-regular use. On the one hand, the article 17th of the Chilean water code (DFL, 2018) states that permanent use rights “are those that allow the use of water in a corresponding amount.” On the other hand, article 18th mentions Water rights of non-regular use as those that “only allow the use of water in periods in which the main flow presents a residual after the permanent use rights are met”.
Water surplus
To conduct the availability analysis it is necessary to estimate the superficial resources in a natural regime (DGA, 2004a), meaning that it must be considered the flow pass through the point assuming there is no human extraction or intervention.
For this purpose, the method of basin transposition by area and precipitation was applied, since this procedure is the one recommended by the manual of norms and procedures for the administration of water resources of the DGA (Dirección General de Aguas). Although not new, this method is highly recommended and adequate for the goals of this work. This is a widely used methodology to determine flows in non-instrumented basins (Álvarez-Sevilla, Brown-Manrique, & del Cid-Colindres, 2017; Duitama, Moreno, & Zamudio, 2015), where other methods, such as the flow-precipitation correlation or the water balance are impossible to apply due to lack of data. In effect, this methodology estimates the flow in a natural regimen that would pass through a point evaluated using records of reference gauging stations. Reference stations selected for the present study correspond to those that, due to their closeness to points in evaluation, present similarities in regime and that practically do not undergo water extractions in their contributing sub-basins, allowing calculation of the theoretical flows that would pass through the evaluated points. This method assumes that the evaluated point has the same flow regime as the reference station, and that the relation is established according to the size of the sub-basin that it conforms and its average annual precipitation. The equation that describes that calculation is the following:
Where
The application of equation 1 yields the water surplus, the average monthly flows in natural regimen at Q10PE, at Q85PE and at Q95PE, of each evaluated point, i.e. 10%, 85%, and 95% probability of exceedance respectively.
Rainfall processing
Analysis of precipitation of each sub-basin needs instrumental records. According to Table 1, compiled with records of the Center for Climate and Resilience Science (CR2, 2017), the study area only contains 24 gauging stations with a minimum of 80% of records during the interval 1991 to 2016 (see subsection about reference gauging stations) with a spatial distribution that difficults the study at the sub-basin scale.
Table 1 Rain gauges.
| ID | Name | Coordinates | Years observed | Elevation (masl) | Rainfall (mm/year) | ||
|---|---|---|---|---|---|---|---|
| West | South | Begin | End | ||||
| 1 | Nueva Aldea | 72.4561° | 36.6544° | 1956 | 2016 | 32 | 963 |
| 2 | Chillancito | 72.4239° | 36.7622° | 1954 | 2016 | 56 | 1 013 |
| 3 | Chillán Viejo | 72.1267° | 36.6319° | 1977 | 2017 | 115 | 941 |
| 4 | Ma. Dolores | 72.4225° | 37.4028° | 1951 | 2017 | 120 | 1 009 |
| 5 | San Agustín | 72.3944° | 36.4214° | 1993 | 2016 | 138 | 866 |
| 6 | Las Achiras | 72.3661° | 37.3806° | 1964 | 2016 | 144 | 933 |
| 7 | B. O’Higgins | 72.04° | 36.5872° | 1950 | 2017 | 151 | 891 |
| 8 | Millauquén | 72.04° | 36.3183° | 1992 | 2016 | 152 | 861 |
| 9 | Pemuco | 72.1008° | 36.9764° | 1971 | 2016 | 200 | 1 140 |
| 10 | Cholguán | 72.0669° | 37.1528° | 1956 | 2016 | 230 | 1 247 |
| 11 | San Manuel | 71.6494° | 36.3581° | 1956 | 2017 | 270 | 1 470 |
| 12 | Coihueco | 71.7989° | 36.6408° | 1900 | 2016 | 314 | 1 392 |
| 13 | Tucapel | 71.9519° | 37.2936° | 1975 | 2016 | 342 | 1 469 |
| 14 | Mayulermo | 71.8944° | 36.8189° | 1992 | 2016 | 371 | 1 462 |
| 15 | Digua | 71.5481° | 36.2558° | 1947 | 2017 | 390 | 1 280 |
| 16 | San Fabián | 71.5247° | 36.5836° | 1956 | 2016 | 465 | 1 512 |
| 17 | Trupán | 71.8228° | 37.2806° | 1963 | 2016 | 474 | 1 625 |
| 18 | Las Cruces | 71.765° | 37.1114° | 1993 | 2016 | 476 | 1 782 |
| 19 | Bullileo | 71.4142° | 36.285° | 1930 | 2017 | 600 | 1 985 |
| 20 | Caracol | 71.395° | 36.6511° | 1900 | 2016 | 610 | 2 287 |
| 21 | Caman | 71.2989° | 36.6731° | 1992 | 2016 | 670 | 2 131 |
| 22 | Diguillín | 71.6425° | 36.8686° | 1900 | 2016 | 670 | 2 042 |
| 23 | Fdo. Atacalco | 71.5814° | 36.9175° | 1930 | 2016 | 740 | 2 131 |
| 24 | Las Trancas | 71.4792° | 36.9108° | 1961 | 2016 | 1 242 | 1 755 |
For this reason, a regionalization method of regionalization of the precipitation based on instrumental and satellite records. The Tropical Precipitation Measurement Mission (TRMM) provides a product of a spatial resolution of 0.25° and with monthly periodicity (NASA, 2015). With these monthly data in raster format, obtained from the NASA web interface, Giovanni (Goddard Earth Sciences Data and Information Services Center Interactive Online Visualization and Analysis Infrastructure), that provides information from various satellites to every region of the world (NASA, 2017), annual totals were calculated for the 1998-2017 period. These precipitation values were compared with the records from the gauging stations presented in Table 1 to determine the bias and compute bias-corrected TRMM product using a linear regression correction method (Canavos, 1998).
Finally, the average annual precipitation of each sub-basin was determined through the precipitation average of each corresponding pixel of the corrected TRMM product localized in each sub-basin of the Ñuble River. This precipitation was used in the basin transposition formula (1).
Reference gauging stations
Based on the DGA (2004b) study, two stations showing a regime close to natural one were used for the analysis, with a regimen close to the natural one, and were obtained from the National Water Bank (DGA, 2017a): (a) Sauces station, for mountain sub-basins, with a mixed regime (A, B, C y G in Figure 2), and (b) Cholguán station, to determine the availability in the sub-basins with pluvial regime (D, E, F y G in Figure 2). These cases were considered to be in natural regime because there are no flow extractions upstream these stations.
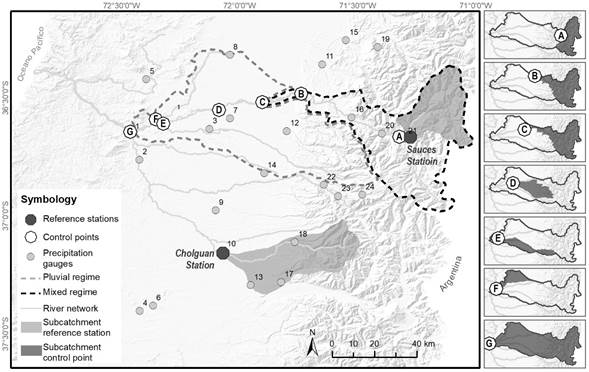
Figure 2 Stations, points and regimens in the study area. In the main panel the localization of the standard basins of the Cholguán and Sauces creeks in relation to the Ñuble River Basin can be seen. The side panels identify the sub-basins associated with each control point.
A special case occurs in G at the Ñuble River mouth, since it has a pluvial and mixed (pluvio-nival) regime (Table 2 and Figure 2). Due to this, this point utilized both reference stations. The zone of mixed regimen of point G was considered as the sub-basin of point C, which used station Sauces as reference. The rest of the basin was considered a zone of pluvial regime, using Cholguán station as reference.
Table 2 Coordinates and regime of gauging stations and locations evaluated in this study. Source: This study based on data from DGA (2004) and DGA (2017a).
| ID | Location | Coordinates | Elevation (masl) | Regime | ||
|---|---|---|---|---|---|---|
| S | W | |||||
| Reference station | Sauces | Confluence Sauces and Ñuble Rivers | 36.666° | 71.274° | 700 | Mixed |
| Cholguán | Río Itata at Cholguán | 37.157° | 72.068° | 225 | Pluvial | |
| Location evaluated | A | Upper Ñuble | 36.664° | 71.322° | 655 | Mixed |
| B | Mid Ñuble | 36.483° | 71.737° | 288 | Mixed | |
| C | Mid Ñuble | 36.519° | 71.902° | 191 | Mixed | |
| D | Cato River mouth | 36.552° | 72.086° | 114 | Pluvial | |
| E | Chillan River mouth | 36.601° | 72.332° | 53 | Pluvial | |
| F | Changaral River mouth | 36.601° | 72.344° | 49 | Pluvial | |
| G | Ñuble River mouth | 36.643° | 72.462° | 27 | Mixed/Pluvial | |
The time series of the monthly average flows of the last 25 years were used, from the hydrologic year of 1991-92 until 2016-17. The first year of the study period was selected because the El Niño phenomenon was not extreme that year according to data from NOAA (2018).
Probabilities of exceedance (PE) for each month were obtained using the FRECwin statistical analysis software, which determines PE for five flow frequency distributions (Weibull, Normal, Log- Normal, Gumbel, Gamma) employing the chi square test, to determine the best fit for each case, obtaining the monthly Q10PE, Q85PE and Q95PE average flows (DGA, 2004a).
Water demand
For the calculation of water demand, the water rights in the study area were analyzed, since the available flow depends on the difference between the existing flow in the river minus the rights that must be respected, considering the environmental demand (DGA, 2008).
An analysis of the available water rights records in the public water cadaster until 2017 was conducted (DGA, 2017b: DGA, 2008), in conjunction with records from the internal database of the Water Resource Information Center (CIRH). The records of the CIRH correspond to requested, but not necessarily constituted or granted, water rights by the DGA. In other words, the flow data of the water rights included in this database is less trustworthy. In order to determine which of those water rights were actually constituted, a thorough revision of the water rights expedients in the CIRH database was conducted.
833 water rights were found for the study area. 101 were eliminated for not being constituted in liters per second, and another 88 because it was proven through the revision of their expedient, that their constitution was denegated. As a result, 644 water rights records were utilized for the analysis.
It was detected that records of some expedients from the CIRH database do not exist. Due to this, two scenarios were generated with different flow distributions. The objective of this is to evaluate how the inaccuracy of a database can affect the water availability.
Scenario 1: Included the water rights flows from the oficial CPA database and those validated from the CIRH database.
Scenario 2: Considered the water right flows of scenario 1, in addition to those of the CIRH database that had a missing expedient.
Upon obtaining the totality of the flows of the area, the sub-basin sum was computed, permitting the calculation of the water demand for each scenario.
Water balance
The water balance of the evaluated flows was conducted according to the norm established by the DGA. The permanent available flow corresponds to the PE flow of 85% minus the ecological flow, minus the already constituted permanent water right according to the following equation:
The ecological flow is considered as 50% of the flow with 95% exceedance probability, with the restrictions that Decreet N°71 (Ministerio del Medio Ambiente, 2015) indicates, which are as follows:
For the months in which the 50Q95PE is less than the determined flow for 20% of the annual median flow (20Qma), the ecological flow will be 50Q95PE
For the months in which the 50Q95PE is more than the determined flow for the 20Qma, the ecological flow will be the 20Qma.
For the available flows of eventual use, according to Equation (3), the Q10Pe minus the Q85PE minus the flow of already constituted water rights of eventual use, minus the possible deficit of permanent water rights generated by the availability analysis were used (DGA, 2008):
Results
Precipitation correction
The bias between TRMM and the instrumental observations reached differences of up to 91.5%. Given that the spatial distribution for the stations is irregular, it was opted to utilize TRMM to produce precipitation maps. However, the comparison between the TRMM precipitation and the stations delivered a bias of 33.9%. To reduce this bias, a correction of the amounts of each cell of the TRMM that cover this area of the study was conducted.
A relation between the altitude of the station and the bias of precipitations present with respect to the TRMM, since as observed in Figure 3, the higher the altitude of the station, the more the bias. Due to this, a correction using a linear regression model was conducted. Including Las Trancas station in the model gave a low R², so it was opted to eliminate it from the calculation. The Las Trancas station is the highest in the study area, and it is situated in a narrow valley zone, where a large part of winter precipitation corresponds to snow, whereas the other stations are located under the snow line determined for basins of that region (Stehr & Aguayo, 2017). Since TRMM only estimates liquid precipitation, it is very likely that the lack of correlation can be explained by this. In this way, a model that explains a variance of 84% was obtained.

The following is the adjustment equation of Figure 3:
The bias of each pixel was obtained with the equation (4) considering the corresponding elevations. These values were added to the TRMM, reducing the average bias to 14.8%, less than half of the initial bias. On the other hand, it is worth noting that, even if bias increased in some lower altitude stations, at higher altitudes the decrease was remarkable. The distribution in precipitation is shown in Figure 4. The number corresponds to the station ID (Table 1).

From the corrected model, a calculation of the average precipitation for the sub-basins and the reference stations was obtained, shown in Table 3 along with the corresponding area of each one. Point G corresponds to the pluvial regime zone of the Ñuble River, which added to point C results in the complete area of the basin.
Water surplus
Using the basin transposition method, the flows of natural regime present in Table 4 were obtained. The points located over the Ñuble River are those that present a larger flow, highlighting the river mouth with values over 150 m³/s at 85PE.
Table 4 Points evaluated with Q10PE, Q85PE and Q95PE by month. The distributions of probability that were best adjusted to each place and month, are represented with tones of gray, with their key included at the foot of the table.
| ID | PE | Flow (m³/s) | |||||||||||
|---|---|---|---|---|---|---|---|---|---|---|---|---|---|
| Apr | May | Jun | Jul | Ago | Sep | Oct | Nov | Dec | Jan | Feb | Mar | ||
| Sauces | 10 | 16 | 62 | 97 | 72 | 79 | 74 | 75 | 71 | 46 | 23 | 13 | 11 |
| 85 | 4 | 6 | 21 | 26 | 22 | 32 | 33 | 27 | 14 | 6 | 4 | 4 | |
| 95 | 3 | 3 | 14 | 19 | 16 | 25 | 23 | 15 | 5 | 4 | 3 | 3 | |
| Cholguán | 10 | 25 | 94 | 134 | 133 | 118 | 94 | 68 | 40 | 29 | 23 | 24 | 21 |
| 85 | 10 | 9 | 38 | 36 | 36 | 36 | 25 | 21 | 16 | 14 | 14 | 12 | |
| 95 | 8 | 5 | 23 | 11 | 15 | 28 | 18 | 18 | 13 | 13 | 12 | 11 | |
| A | 10 | 34 | 133 | 209 | 154 | 170 | 159 | 161 | 152 | 100 | 49 | 29 | 23 |
| 85 | 9 | 13 | 44 | 56 | 48 | 69 | 72 | 57 | 29 | 14 | 10 | 8 | |
| 95 | 6 | 7 | 29 | 41 | 34 | 55 | 49 | 32 | 11 | 9 | 7 | 6 | |
| B | 10 | 47 | 182 | 286 | 211 | 233 | 218 | 220 | 209 | 136 | 66 | 39 | 31 |
| 85 | 12 | 18 | 61 | 77 | 65 | 94 | 98 | 78 | 40 | 19 | 13 | 11 | |
| 95 | 8 | 10 | 40 | 56 | 47 | 75 | 66 | 44 | 15 | 12 | 9 | 8 | |
| C | 10 | 48 | 184 | 289 | 214 | 236 | 220 | 223 | 211 | 138 | 67 | 40 | 32 |
| 85 | 12 | 19 | 61 | 78 | 66 | 95 | 99 | 79 | 40 | 19 | 13 | 11 | |
| 95 | 8 | 10 | 41 | 56 | 47 | 76 | 67 | 45 | 15 | 12 | 9 | 8 | |
| D | 10 | 26 | 96 | 137 | 136 | 121 | 96 | 69 | 41 | 29 | 23 | 24 | 22 |
| 85 | 10 | 9 | 39 | 37 | 37 | 37 | 25 | 21 | 17 | 15 | 14 | 13 | |
| 95 | 8 | 5 | 23 | 11 | 15 | 29 | 19 | 18 | 13 | 13 | 12 | 11 | |
| E | 10 | 19 | 70 | 99 | 99 | 88 | 70 | 50 | 30 | 21 | 17 | 18 | 16 |
| 85 | 8 | 7 | 28 | 27 | 27 | 27 | 18 | 16 | 12 | 11 | 10 | 9 | |
| 95 | 6 | 4 | 17 | 8 | 11 | 21 | 14 | 13 | 10 | 10 | 9 | 8 | |
| F | 10 | 10 | 36 | 52 | 51 | 46 | 36 | 26 | 15 | 11 | 9 | 9 | 8 |
| 85 | 4 | 3 | 15 | 14 | 14 | 14 | 10 | 8 | 6 | 6 | 5 | 5 | |
| 95 | 3 | 2 | 9 | 4 | 6 | 11 | 7 | 7 | 5 | 5 | 5 | 4 | |
| G | 10 | 109 | 410 | 611 | 533 | 520 | 447 | 385 | 307 | 207 | 122 | 97 | 82 |
| 85 | 37 | 40 | 152 | 165 | 153 | 183 | 159 | 130 | 79 | 53 | 46 | 41 | |
| 95 | 27 | 22 | 95 | 83 | 82 | 143 | 111 | 88 | 46 | 44 | 39 | 34 | |
| Legend | |||||||||||||
| Distribution | Gamma | Lognormal | Normal | Gumbel | |||||||||
Additionally, from the Qma of the stations, and using equation 1 (basin transposition), the Qma of the evaluated points were calculated (Table 5). A large difference between the Ñuble and the other rivers is observed; for example, the mouth of the Changaral River is only approximately 8% the flow of the Ñuble River.
Water demand
The distribution of flows between permanent and eventual water rights was different. On the one hand, permanent rights have a more homogeneous distribution during every month of the year. On the other hand, eventual rights did show larger variability, reaching differences of up to 134 m³/s (Table 6) between the winter and summer months, with the flow being much higher in winter.
Table 6 Allocated flow per sub-basin in the evaluated locations.
| Water rights | Location | Flow (m3/s) | |||||||||||
|---|---|---|---|---|---|---|---|---|---|---|---|---|---|
| Apr | May | Jun | Jul | Ago | Sep | Oct | Nov | Dec | Jan | Feb | Mar | ||
| Permament (scenario 1) | A | 0 | 0 | 0 | 0 | 0 | 0 | 0 | 0 | 0 | 0 | 0 | 0 |
| B | 5.5 | 5.5 | 5.5 | 5.5 | 5.5 | 5.5 | 5.5 | 5.5 | 5.5 | 5.5 | 5.5 | 5.5 | |
| C | 12.9 | 12.9 | 12.9 | 12.9 | 12.9 | 12.9 | 12.9 | 12.9 | 12.9 | 12.9 | 12.9 | 12.9 | |
| D | 6.2 | 6.9 | 7 | 7 | 7 | 6.9 | 6.3 | 6.2 | 6.2 | 6.2 | 6.2 | 6.2 | |
| E | 4.4 | 7.4 | 7.5 | 7.5 | 7.5 | 7.5 | 4.5 | 4.5 | 4.4 | 4.2 | 4.4 | 4.4 | |
| F | 1.2 | 1.2 | 1.2 | 1.2 | 1.2 | 1.2 | 1.2 | 1.2 | 1.2 | 1.2 | 1.2 | 1.2 | |
| G | 25.7 | 29.4 | 29.5 | 29.5 | 29.5 | 29.5 | 25.9 | 25.8 | 25.8 | 25.6 | 25.7 | 25.7 | |
| Permament (scenario 2) | A | 0 | 0 | 0 | 0 | 0 | 0 | 0 | 0 | 0 | 0 | 0 | 0 |
| B | 6.3 | 6.3 | 6.3 | 6.3 | 6.3 | 6.3 | 6.3 | 6.3 | 6.3 | 6.3 | 6.3 | 6.3 | |
| C | 14.5 | 14.5 | 14.5 | 14.5 | 14.5 | 14.5 | 14.5 | 14.5 | 14.5 | 14.5 | 14.5 | 14.5 | |
| D | 7.1 | 7.7 | 7.8 | 7.8 | 7.8 | 7.8 | 7.2 | 7.1 | 7.1 | 7.1 | 7.1 | 7.1 | |
| E | 5.4 | 8.4 | 8.4 | 8.4 | 8.4 | 8.4 | 5.4 | 5.4 | 5.4 | 5.2 | 5.4 | 5.4 | |
| F | 2.1 | 2.1 | 2.1 | 2.1 | 2.1 | 2.1 | 2.1 | 2.1 | 2.1 | 2.1 | 2.1 | 2.1 | |
| G | 30.9 | 34.6 | 34.7 | 34.7 | 34.7 | 34.7 | 31.1 | 31 | 30.9 | 30.7 | 30.9 | 30.9 | |
| Evantual (scenario 1 and 2) | A | 19 | 69.9 | 111.8 | 71.1 | 54.4 | 56.7 | 83.1 | 149.6 | 86.6 | 19 | 19 | 19 |
| B | 63.3 | 114.2 | 156 | 115.4 | 98.6 | 100.9 | 127.3 | 193.9 | 130.8 | 63.3 | 63.3 | 63.3 | |
| C | 63.3 | 114.2 | 156 | 115.4 | 98.6 | 100.9 | 127.3 | 193.9 | 130.8 | 63.3 | 63.3 | 63.3 | |
| D | 0 | 0.1 | 0 | 0 | 0 | 0 | 0 | 0.1 | 0.1 | 0 | 0 | 0 | |
| E | 1.3 | 6.5 | 15.9 | 19.3 | 14.7 | 12.9 | 6.3 | 4 | 2 | 0.7 | 0.7 | 0.7 | |
| F | 0 | 2.2 | 2.2 | 2.2 | 2.2 | 2.2 | 0 | 0 | 0 | 0 | 0 | 0 | |
| G | 64.6 | 123.1 | 174.2 | 137 | 115.6 | 116.1 | 133.6 | 198 | 132.9 | 63.9 | 63.9 | 63.9 | |
Scenario 2 shows that the uncertainty of a database can generate differences in granted flows by up to 5.2 m³/s. This is the case for Point G, which has verified permanent flows that oscillate between 25 and 30 m³/s (scenario 1), while non-validated water rights are considered, flows are up to 34.7 m³/s.
Water balance
The conducted balance gave similar results in both scenarios, with a deficit existing between the months of October and May, meaning that in a dry year there is not enough flow to satisfy all water rights.
Table 7 presents the availability in the evaluated points. The over-allocated flows, in which the demand is higher than the water surplus, are presented as negative. In addition to this, the symbol (*) represents flows that went from being available in scenario 1 to being over-allocated in scenario 2.
Table 7 Flow availability on each evaluated location.
| Availability | Location | Flow (m3/s) | ||||||||||||
|---|---|---|---|---|---|---|---|---|---|---|---|---|---|---|
| Apr | May | Jun | Jul | Ago | Sep | Oct | Nov | Dec | Jan | Feb | Mar | |||
| Permananent | Scenario 1 | A | 5.6 | 9.8 | 30.7 | 42.6 | 33.9 | 55.3 | 58.3 | 43.7 | 23.8 | 9.1 | 6.2 | 5.2 |
| B | 2.1 | 7.9 | 36.4 | 52.9 | 40.9 | 70.1 | 74.3 | 54.2 | 27.1 | 6.9 | 3 | 1.5 | ||
| C | -5.1 | 0.7* | 29.5 | 46.1 | 34 | 63.6 | 67.7 | 47.5 | 20.1 | -0.3 | -4.3 | -5.7 | ||
| D | 0.3* | -0.3 | 23.3 | 24.6 | 22.5 | 21.6 | 10.7 | 6.8 | 3.8 | 1.8 | 1.6 | 0.8* | ||
| E | 0.3* | -2.6 | 14.5 | 15.4 | 14 | 13.3 | 7.9 | 5 | 2.8 | 1.6 | 1.3 | 0.6* | ||
| F | 1.3 | 1.3 | 10.3 | 10.8 | 10 | 9.6 | 5.3 | 3.8 | 2.6 | 1.9 | 1.8 | 1.5 | ||
| G | -2.6 | -0.3 | 84.1 | 97.1 | 84.6 | 114.2 | 94.8 | 65.2 | 30.6 | 5.9 | 1.3* | -2.2 | ||
| Scenario 2 | A | 5.6 | 9.7 | 30.6 | 42.6 | 33.9 | 55.3 | 58.3 | 43.6 | 23.8 | 9.1 | 6.2 | 5.1 | |
| B | 1.4 | 7.1 | 35.7 | 52.1 | 40.1 | 69.4 | 73.5 | 53.5 | 26.3 | 6.2 | 2.2 | 0.8 | ||
| C | -6.7 | -1* | 27.9 | 44.5 | 32.4 | 61.9 | 66.1 | 45.9 | 18.4 | -1.9 | -5.9 | -7.4 | ||
| D | -0.6* | -1.1 | 22.4 | 23.7 | 21.7 | 20.8 | 9.8 | 5.9 | 2.9 | 1 | 0.8 | -0.1* | ||
| E | -0.7* | -3.6 | 13.5 | 14.5 | 13 | 12.3 | 6.9 | 4 | 1.8 | 0.6 | 0.3 | -0.3* | ||
| F | 0.4 | 0.4 | 9.3 | 9.8 | 9 | 8.7 | 4.3 | 2.8 | 1.7 | 0.9 | 0.8 | 0.5 | ||
| G | -7.8 | -5.5 | 78.9 | 91.9 | 79.4 | 109.1 | 89.6 | 60 | 25.5 | 0.8 | -3.9* | -7.4 | ||
| Eventual | Scenario 1 | A | 6.8 | 49.4 | 53.1 | 27 | 68.5 | 33.7 | 5.9 | -54.6 | -16.2 | 16 | 0 | -4.2 |
| B | -27.8 | 49.2 | 69.7 | 19 | 69.6 | 22.8 | -5.5 | -63.7 | -34.5 | -15.3 | -37.2 | -42.9 | ||
| C | -32.6 | 50.8 | 71.9 | 20.3 | 71.3 | 24 | -4.3 | -62.4 | -33.5 | -15.1 | -41.2 | -48.4 | ||
| D | 15.5 | 86.5 | 97.8 | 98.5 | 83.7 | 59 | 43.6 | 19.3 | 12.6 | 8.5 | 10.1 | 9 | ||
| E | 9.9 | 53.9 | 55.2 | 52.2 | 46.1 | 30 | 25.4 | 10.1 | 7.2 | 5.5 | 6.7 | 5.9 | ||
| F | 5.9 | 30.7 | 34.9 | 35.1 | 29.5 | 20.2 | 16.5 | 7.3 | 4.8 | 3.2 | 3.8 | 3.4 | ||
| G | 5.1* | 246.4 | 284.5 | 230.9 | 251.7 | 148.2 | 92.3 | -20.9 | -5.6 | 4.6 | -13.8 | -24.3 | ||
| Scenario 2 | A | 6.8 | 49.4 | 53.1 | 27 | 68.5 | 33.7 | 5.9 | -54.6 | -16.2 | 16 | 0 | -4.2 | |
| B | -27.8 | 49.2 | 69.7 | 19 | 69.6 | 22.8 | -5.5 | -63.7 | -34.5 | -15.3 | -37.2 | -42.9 | ||
| C | -34.2 | 49.9 | 71.9 | 20.3 | 71.3 | 24 | -4.3 | -62.4 | -33.5 | -16.8 | -42.8 | -50.1 | ||
| D | 14.9 | 85.6 | 97.8 | 98.5 | 83.7 | 59 | 43.6 | 19.3 | 12.6 | 8.5 | 10.1 | 8.9 | ||
| E | 9.3 | 53 | 55.2 | 52.2 | 46.1 | 30 | 25.4 | 10.1 | 7.2 | 5.5 | 6.7 | 5.6 | ||
| F | 5.9 | 30.7 | 34.9 | 35.1 | 29.5 | 20.2 | 16.5 | 7.3 | 4.8 | 3.2 | 3.8 | 3.4 | ||
| G | -0.1* | 241.2 | 284.5 | 230.9 | 251.7 | 148.2 | 92.3 | -20.9 | -5.6 | 4.6 | -17.7 | -29.4 | ||
Although there is not a large difference between scenario 1 and 2, in 2 some new locations show over-allocation, mainly in permanent rights. The most drastic change is in Point G, in the month of February, where in scenario 1 there is an availability of 1.3 m³/s and in scenario 2 a deficit of 3.9 m³/s is produced. This situation is also generated in the Cato an Chillan rivers (points D and E) during the months of March and April, where in scenario 1 there is a higher availability with more than 0.3 m³/s and in scenario 2, the resource looks to be depleted with a deficit of up to 0.7 m³/s
The main deficits for the case of permanent rights, only considering scenario 2, are observed in points C and G, between the months of January and May (see Table 7 and Figure 5), with maximums that surpass 7 m³/s.

By considering the global availability of the Ñuble River Basin, Point G can be identified as the most critical, since it generates the potential depletion of its contributing area. This is indicated by the hatched area in Figure 6, in which it can be observed that from February until May, the basin is over-allocated, meaning that in this basin no more rights can be granted, unlike the points located downstream (D, E, F and G) in which there exist availability.

Figure 6 presents a similar situation, but it encompasses more months, where the Ñuble River Basin is seen low from November to April, not considering the Month of January, and the area of Point C shows the same situation in the months of January and October.
The main deficits for the case of eventual rights in scenario 2 occur in Points B and C, between the months of October and April, with maximums over 60 m³/s, and in the month of November (see Table 7 and Figure 6). On the other hand, points D, E and F show availability of the water resource throughout the entire year, but even then, in certain months, no Water Rights can be allocated due to the water deficit downstream.
Thus, the results indicate that an over-allocation of the resource exists in the summer months in scenario 1, that included every possible type of water right, and in scenario 2, when only the validated (DGA and CIRH) rights are considered.
Discussion
The evaluation of water availability for the constitution of water rights in the Ñuble River Basin, shows an over-allocation of the resource, in which there is no availability for permanent rights from February to March, and for eventual rights exercise in November, December, February, March and April. The location that triggers the over-allocation corresponds to the Ñuble River mouth, which leaves the entire basin exhausted. Additionally, a deficit is observed upstream in the basin in October and January.
These findings show the inefficiencies of a system of concession of rights that has produced an exacerbation of water stress and irreversible destruction in the basins of many different regions where the resource is scarce (Larraín, 2006).
The DGA has been unable to comply with its function, inspecting and registering the water rights (Bolados et al., 2017), causing shortcomings in the allocation, aggravated by a context of change towards a new hydrologic scenario in which the existence of episodes of drought is becoming more frequent in the central zone of Chile (Muñoz et al., 2016).
The problems associated with the difficulties in the control of the over-allocation and the possibility of an increase in the water demand can impact water availability in the future in a stronger way, considering the hydroclimatic tendencies documented in the last decades, and the proyections. Evidence of a new hydroclimatic scenario is documented in the general regression of glaciers and an increase in the altitude of the equilibrium line (Carrasco, Osorio, & Casassa, 2008), a decrease of precipitation (Urrutia-Jalabert, Gonzáles, Gonzáles-Reyes, Lara, & Garreaud, 2018), flows below average (Fernández et al., 2018; Barría, Peel, Walsh, & Muñoz, 2017), and a mega-drought that began in the year 2010 (CR2, 2015). In fact, this has been the longest continuous drought since during the instrumental record, and the one that has reached further south, with an annual rain deficit from 25% to 45% (Garreaud et al., 2017). However, it is important to highlight that this meteorological drought does not necessarily transform into a hydrologic one, since this depends on specific factors of each basin, especially vegetation cover, soil type and morphometry (Fernandez et al., 2018). The climatic projections based on models indicate a reduction in median annual precipitation, and an increase in surface air temperature towards the end of the 21st century for the South-Central region of Chile (Garreaud et al., 2017; Stehr, Debels, Arumi, Alcayaga, & Romero, 2010). In studies conducted in the Bio-Bio River Basin, Barría et al. (2017) foresee reductions in runoff in zones with Mediterranean climate, and in particular, in basins of great elevation in Chile. On the other hand, Stehr et al. (2010) indicate that a reduction in the magnitude of the annual and monthly median flows will be produced, this variation being greater in spring and summer. Thus, it is expected that this type of scenario will continue in the future (Quintana & Aceituno, 2012), presenting a higher recurrence of droughts (Bosier, Rondanelli, Garreaud, & Muñoz, 2016). This scenario could intensify problems of access to the resource, since the main source of water supply in south-central Chile corresponds to superficial water courses, of which their recharge depends on precipitation (Aguayo, Stehr, & Link, 2016). An adequate consideration of the potential impacts of climate change on water resources should constitute a previous prerequisite to partake in any long-term project that is related to the use, so that more appropriate management strategies can be adopted, avoiding adverse environmental effects and conflicts between different users (Stehr et al., 2010). In this way, a reform to the Chilean Water Code should put in place a way of assigning rights and their expirations, establishing an integrated management of the hydrologic basins and their institutionality. The idea is for the government to possess stronger legal tools to prevent water over-exploitation.
The result of this study agrees with various governmental papers and reports that suggest a generalized supply problem of the resource from the North to the South-Central part of Chile. The results place the Ñuble River Basin at the level of what has been observed in basins with Mediterranean climate in central Chile, with precipitations concentrated in the southern winter, and with an annual median that oscillates between 100 and 500 mm in the central valley (Viale & Garreaud, 2015). The case of the Ligua and Petorca River Basins being some of the most emblematic (Budds, 2012). These basins have been described as critical due to their vulnerability to hydrologic variability, especially droughts. According to the study of availability conducted by the DGA (2006), the basins had permanently exhausted resources, and the eventual ones only available from April to November. On the other hand, Bolados et al. (2017) mentions that this situation was already in place since the 90s over superficial waters, and since 2000 over groundwaters, generating socioeconomic consequences and environmental wear. At the beginning of the 2000s, the Aconcagua (~32°S a 33°S) (DGA, 2004c) and Maipo, (~33°S a 34°S) (DGA, 2003) river basins also did not count with available resources throughout the whole year to constitute new water rights in certain sections. This was corroborated in practice with the fact that, in dry years, the rivers had to go into users’ shift, preventing the associations’ of canals users from utilizing their total allocated rights.
Further south than the previous examples, where precipitations tend to be greater, availability is also greater. For example, this is the case of the Maule River (~35°S a 36°S), which is over-allocated in certain sections, mainly between the months of November and April, in both permanent and eventual rights (DGA, 2005). Similar situations are even observed south of the study area (~38°S), where the climate changes to mild with Mediterranean influence. Annual median precipitation here increases to 1000-1500mm, with a greater frequency in episodes of precipitation during the relative summer of regions located further north (Viale & Garreaud, 2015). In this zone, studies of the Laja (~37°S) (DGA, 2000); Imperial (~37°S a 39°S) (DGA, 2001), and Quepe (~38°S) (DGA, 2004a) rivers can be mentioned, which in certain sections and mainly in summer, show over-allocation of permanent rights. In the case of eventual rights, observed availability is larger.
In any case, it is necessary to take into account the fact that these studies are fairly old, suggesting that updated studies would probably reveal greater over-allocation. In general, the results of the present study agree with the described examples, showing similar characteristics to basins located between the limits of zones with Mediterranean and mild climate. The winter availability is explained by the decrease in precipitation relative to a constant demand.
Conclusions
The evaluation of the water availability is an important tool to learn the state of a basin that in the near future could develop conflicts due to the constant decrease of flows, which would allow prevention through the generation of public policies focused on a more efficient management of the water resource.
Using a methodology that mixed instrumental and satellite data, it was possible to identify over-allocation of water rights in various sectors of the Ñuble River Basin. It was detected that the allocated flow is higher than available discharge for consumptive rights during the summer, which would condition the ability to grant new rights in the basin. In general, central Chile is being affected by these situation. Their origins come from both climatic causes to insufficient management, in addition to a legal framework that, guided by the free market theory, has not been able to generate tools for the preservation of the resource, and to guarantee its access to the population. The lack of trustworthy databases, in both water rights and instrumental records, prevents the development of more accurate studies. This database problem hinders, for now, the ability to quantitatively discriminate between the sensitivity of the flows to over-allocation versus regional climate change that affect hydrological regimes.
In over-allocated basins, a reform should propose measures that allow the redistribution of the existing rights in a more equitable way, taking rights that are not used in productive ways, generating measures that allow the preservation of scenic quality, and generating tools to solve user conflicts. In the same way, the results of this work suggest problems in the administrative procedure to grant rights. In effect, it is clear that an updated database of all the conceded rights is necessary to clarify existing demands, and flow estimations in natural state must be improved, increasing the number of gauging stations to obtain more accurate records.
This way, in the current water context, this problem should be addressed in a better way by the government and, as a result, a change in the water code could bring solutions, which should encompass aspects like the nature of the water rights and climate change.
Finally, climate change, a factor that contributes to the decrease in water surplus, should be treated with more attention. It is necessary to adapt to the new existing conditions, for example, through a more efficient use of water, considering it as a scarce good, implementing technologies that allow the reduction of its consumption.
Referencias
Aguayo, M., Stehr, A., & Link, O. (2016). Respuesta hidrológica de una cuenca de meso escala frente a futuros escenarios de expansión forestal. Revista de Geografía Norte Grande, (65), 197-214. DOI: doi.org/10.4067/S0718-34022016000300010 [ Links ]
Álvarez-Sevilla, I., Brown-Manrique, O., & Del Cid-Colindres, E. (2017). Estimación de variables hidrológicas mediante modelos de regresión en la cuenca del río Suchiate, Guatemala. Revista Ciencias Técnicas Agropecuarias, 26(3), 22-29. Recuperado de http://scielo.sld.cu/scielo.php?script=sci_arttext&pid=S2071-00542017000300003&lng=es&tlng=es [ Links ]
Barría, P., Peel, M. C., Walsh, K. J., & Muñoz, A. (2017). The first 300‐year streamflow reconstruction of a high‐elevation river in Chile using tree rings. International Journal of Climatology, 38(1), 436-451. DOI: doi.org/10.1002/joc.5186 [ Links ]
Budds, J. (2012). La demanda, evaluación y asignación del agua en el contexto de escasez: un análisis del ciclo hidrosocial del valle del río La Ligua, Chile. Revista de Geografía Norte Grande, 52, 167-184. DOI: doi.org/10.4067/S0718-34022012000200010 [ Links ]
Boisier, J. P., Rondanelli, R., Garreaud, R. D., & Muñoz, F. (2016). Anthropogenic and natural contributions to the Southeast Pacific precipitation decline and recent megadrought in central Chile. Geophysical Research Letters, 43(1), 413-421. DOI: doi.org/10.1002/2015GL067265 [ Links ]
Bolados, P., Henríquez, F., Ceruti, C., & Sánchez, A. (2017). La eco-geo-política del agua: una propuesta desde los territorios en las luchas por la recuperación del agua en la provincia de Petorca (zona central de Chile). Revista Rupturas, 8(1), 159-191. Recuperado de https://investiga.uned.ac.cr/revistas/index.php/rupturas/article/view/1977 [ Links ]
Canavos, G. C. (1988). Probabilidad y estadística. Aplicaciones y métodos. México, DF, México: McGraw-Hill/Interamericana de México. Recuperado de https://www.academia.edu/31905164/PROBABILIDAD_Y_ESTAD%C3%8DSTICA._Aplicaciones_y_m%C3%A9todos._George_C._Canavos.pdf [ Links ]
Carrasco, J. F., Osorio, R., & Casassa, G. (2008). Secular trend of the equilibrium-line altitude on the western side of the southern Andes, derived from radiosonde and surface observations. Journal of Glaciology, 54(186), 538-550. DOI: doi.org/10.3189/002214308785837002 [ Links ]
Costa, E. (2016). Diagnóstico para un cambio: los dilemas de la regulación de las aguas en Chile. Revista Chilena de Derecho, 43(1), 335-354. Recuperado de https://scielo.conicyt.cl/scielo.php?pid=S0718-34372016000100014&script=sci_arttext&tlng=en [ Links ]
CR2, Centro de Ciencias del Clima y la Resiliencia. (2015). Informe a la Nación. La megasequía 2010-2015: una lección para el futuro. Recuperado de http://repositorio.uchile.cl/bitstream/handle/2250/136717/Megasequia-2010-2015.pdf?sequence=1 [ Links ]
CR2, Centro de Ciencias del Clima y la Resiliencia. (2017). Explorador climático (CR)². Recuperado de http://explorador.cr2.cl/ [ Links ]
DGA, Dirección General de Aguas. (2000). Estudio de disponibilidad cuenca del río Laja (S.I.T. Nº 70). VIII Región, Chile. Santiago, Chile: Unidad Técnica de la Dirección General de Aguas. [ Links ]
DGA, Dirección General de Aguas. (2001). Plan director para la gestión de los recursos hídricos en la cuenca del río Imperial (S.I.T. Nº 74). Santiago, Chile: Ayala, Cabrera y Asociados Ltda. Ingenieros Consultores. Recuperado de http://documentos.dga.cl/ADM4187_v1.pdf [ Links ]
DGA, Dirección General de Aguas. (2003). Evaluación de los recursos hídricos superficiales en la cuenca del río Maipo (S.D.T. Nº 145). Santiago, Chile: Departamento de Administración de Recursos Hídricos. Recuperado de http://documentos.dga.cl/ADM2976texto.pdf [ Links ]
DGA, Dirección General de Aguas. (2004a). Análisis de disponibilidad recursos hídricos superficiales cuenca río Quepe (S.D.T. Nº 175). Santiago, Chile: Departamento de Administración de Recursos. Recuperado de http://documentos.dga.cl/SUP4215.pdf [ Links ]
DGA, Dirección General de Aguas. (2004b). Diagnóstico y clasificación de los cursos y cuerpos de agua según objetivos de calidad. Cuenca del río Itata. Santiago, Chile: Recuperado de http://portal.mma.gob.cl/wp-content/uploads/2017/12/Itata.pdf [ Links ]
DGA, Dirección General de Aguas. (2004c). Evaluación de los recursos hídricos superficiales en la cuenca del río Aconcagua (S.D.T. Nº 165). Santiago, Chile: Departamento de Administración de Recursos Hídricos . Recuperado de http://documentos.dga.cl/SUP3099.pdf [ Links ]
DGA, Dirección General de Aguas. (2005). Evaluación de los recursos hídricos superficiales de la cuenca del río Maule (S.D.T. Nº 197). Santiago, Chile: Departamento de Administración de Recursos Hídricos . Recuperado de http://documentos.dga.cl/SUP4377.pdf [ Links ]
DGA, Dirección General de Aguas. (2006). Evaluación de los recursos hídricos superficiales de las cuencas de los ríos Petorca y La Ligua Vª Región (S.D.T. N° 226). Santiago, Chile: Departamento de Administración de Recursos Hídricos . Recuperado de http://documentos.dga.cl/SUP4496.pdf [ Links ]
DGA, Dirección General de Aguas. (2008). Manual de normas y procedimientos para la administración de recursos hídricos (S.I.T. Nº 156). Santiago, Chile: Departamento de Administración de Recursos Hídricos . Recuperado de http://documentos.dga.cl/ADM5016.pdf [ Links ]
DGA, Dirección General de Aguas. (2017a). Banco Nacional de Aguas. Santiago, Chile. Recuperado de http://snia.dga.cl/BNAConsultas/reportes [ Links ]
DGA, Dirección General de Aguas. (2017b). Derechos de agua. Santiago, Chile. Recuperado de http://derechosdeagua.dga.cl/index.php [ Links ]
Duitama, F. D., Moreno, L. M., & Zamudio, E. (2015). Estimación de caudales en la cuenca media del río Magdalena empleando el método de transposición de caudales. Revista Tekhne, 12(1), 39-48. Recuperado de https://revistas.udistrital.edu.co/index.php/tekhne/article/view/10440 [ Links ]
ESRI, Environmental Systems Research Institute. (2011). Arc Hydro Tools Overview. Esri Water Resources Team. Recuperado de http://downloads.esri.com/blogs/hydro/ah2/arc_hydro_tools_2_0_overview.pdf [ Links ]
Fernández, A., Muñoz, A., González-Reyes, Á., Aguilera-Betti, I., Toledo, I., Puchi, P., Sauchyn, D., Crespo, S., Frene, C., Mundo, I., González, M., & Vignola, R. (2018). Dendrohydrology and water resources management in south-central Chile: lessons from the Río Imperial streamflow reconstruction. Hydrology and Earth System Sciences, 22(5), 2921-2935. DOI: doi.org/10.5194/hess-22-2921-2018 [ Links ]
Garreaud, R. D., Alvarez-Garreton, C., Barichivich, J., Boisier, J. P., Christie, D., Galleguillos, M., & Zambrano-Bigiarini, M. (2017). The 2010-2015 megadrought in central Chile: Impacts on regional hydroclimate and vegetation. Hydrology and Earth System Sciences, 21(12), 6307-6327. DOI: doi.org/10.5194/hess-21-6307-2017 [ Links ]
González, P. (2017). Proyecto de Ley que Reforma el Código de Aguas: Tramitación y Principales Modificaciones. Asesoría técnica parlamentaria. Biblioteca del Congreso Nacional de Chile/ BCN. Departamento de Estudios, Extensión y Publicaciones. Recuperado de https://www.bcn.cl/obtienearchivo?id=repositorio/10221/24620/2/PL_Reforma_el_C%C3%B3digo_de_Aguas.pdf [ Links ]
Larraín, S. (2006). El agua en Chile: entre los derechos humanos y las reglas del mercado. Polis. Revista Latinoamericana, (14). Recuperado de http://journals.openedition.org/polis/5091 [ Links ]
Ministerio de Justicia. (2018). Decreto con Fuerza de Ley. Código de Aguas de 1981. Recuperado de https://www.leychile.cl/Navegar?idNorma=5605 [ Links ]
Ministerio del Medio Ambiente. (2015). Decreto 71. Reglamento para la determinación del caudal ecológico mínimo. Recuperado de https://www.leychile.cl/Navegar?idNorma=1073494&idVersion=2015-01-15 [ Links ]
MINVU, Ministerio de Vivienda y Urbanismo. (2002). Observatorio Urbano. Santiago, Chile. Recuperado de http://observatoriourbano.minvu.cl/indurb/wp_indicadores.asp [ Links ]
Muñoz, A. A., González-Reyes, A., Lara, A., Sauchyn, D., Christie, D., Puchi, P., Urrutia-Jalabert, R., Toledo-Guerrero, I., Aguilera-Betti, I., Mundo, I., Sheppard, P. R., Stahle, D., Villalba, R., Szejner, P., LeQuesne, C., & Vanstone, J. (2016). Streamflow variability in the Chilean Temperate-Mediterranean climate transition (35° S-42° S) during the last 400 years inferred from tree-ring records. Climate Dynamics, 47(12), 4051-4066. DOI: doi.org/10.1007/s00382-016-3068-9 [ Links ]
NASA, National Aeronautics and Space Administration. (2015). Mirador. Recuperado de https://mirador.gsfc.nasa.gov/collections/TRMM_3B43__007.shtml [ Links ]
NASA, National Aeronautics and Space Administration. (2017). Giovanni. Recuperado de https://giovanni.gsfc.nasa.gov/giovanni/ [ Links ]
NOAA, National Oceanic and Atmospheric Administration. (2018). Climate Prediction Center. Recuperado de http://origin.cpc.ncep.noaa.gov/products/analysis_monitoring/ensostuff/ONI_v5.php [ Links ]
Quintana, J. M., & Aceituno, P. (2012). Changes in the rainfall regime along the extratropical west coast of South America (Chile): 30-43º S. Atmósfera, 25(1), 1-22. Recuperado de https://www.scielo.org.mx/pdf/atm/v25n1/v25n1a1.pdf [ Links ]
Stehr, A., & Aguayo, M. (2017) Snow cover dynamics in Andean watersheds of Chile (32.0-39.5° S) during the years 2000-2016. Hydrology and Earth System Sciences, 21(10), 5111-5126. doi.org/10.5194/hess-21-5111-2017 [ Links ]
Stehr, A., Debels, P., Arumi, J. L., Alcayaga, H., & Romero, F. (2010). Modelación de la respuesta hidrológica al cambio climático: experiencias de dos cuencas de la zona centro-sur de Chile. Tecnología y ciencias del agua, 1(4), 37-58. Recuperado de http://www.scielo.org.mx/scielo.php?script=sci_arttext&pid=S2007-24222010000400002 [ Links ]
Ugarte, P. (2003). Derecho de aprovechamiento de aguas. Análisis histórico, extensión y alcance en la legislación vigente (Memoria de grado). Santiago, Chile: Universidad de Chile, Departamento de Derecho Económico. Recuperado de http://repositorio.uchile.cl/bitstream/handle/2250/115224/de-ugarte_p.pdf?sequence=1 [ Links ]
Universidad de Chile. (s.f.). Universidad de Chile. Santiago, Chile. Recuperado de http://www.uchile.cl/portal/presentacion/la-u-y-chile/acerca-de-chile/8069/relieves-de-chile [ Links ]
Urrutia-Jalabert, R., González, M. E., González-Reyes, A., Lara, A., & Garreaud, R. (2018). Climate variability and forest fires in central and South-Central Chile. Ecosphere, 9(4), 1-17. DOI: doi.org/10.1002/ecs2.2171 [ Links ]
USGS, US Geological Survey. (2014). EarthExplorer. Recuperado de https://earthexplorer.usgs.gov/ [ Links ]
Valdés-Pineda, R., Pizarro, R., García-Chevesich, P., Valdés, J. B., Olivares, C., Vera, M., Balocchi, F., Pérez, F., Vallejos, C., Fuentes, R., Abarza, A., & Helwig, B. (2014). Water Governance in Chile: Availability, Management and Climate Change. Journal of Hydrology. 519, 2538-2567. Recuperado de https://doi.org/10.1016/j.jhydrol.2014.04.016 [ Links ]
Vergara, A. (2015). Modelo y mercado de derechos de aguas en Chile: elementos configuradores. En: Urteaga, P., & Verona, A. (eds.). Cinco años de la ley de recursos hídricos en el Perú. Segundas Jornadas de Derecho de Aguas (pp. 293-306). Recuperado de http://vergarablanco.cl/2015-modelo-mercado-derecho-aguas-chile-elementos-configuradores/ [ Links ]
Viale, M., & Garreaud, R. (2015). Orographic effects of the subtropical and extratropical Andes on upwind precipitating clouds. Journal of Geophysical Research: Atmospheres, 120(10), 4962-4974. DOI: doi.org/10.1002/2014JD023014 [ Links ]
Received: September 02, 2019; Accepted: February 18, 2020
 Este es un artículo publicado en acceso abierto bajo una licencia
Creative Commons
Este es un artículo publicado en acceso abierto bajo una licencia
Creative Commons
