


Servicios Personalizados
Revista
Articulo
 texto en
  Inglés (pdf)
 Artículo en XML
 Referencias del artículo
 Enviar artículo por email
Indicadores
-
 Citado por SciELO
 -
 Accesos
Links relacionados
-
 Similares en
SciELO
Similares en
SciELO
Compartir

 Permalink
Tecnología y ciencias del agua
versión On-line ISSN 2007-2422
Tecnol. cienc. agua vol.11 no.6 Jiutepec nov./dic. 2020 Epub 15-Jun-2024
https://doi.org/10.24850/j-tyca-2020-06-02
Articles
Development of crop coefficient for forage safflower based on vegetation indices
1
 http://orcid.org/0000-0002-6983-0905
2
http://orcid.org/0000-0002-4202-9106
3
http://orcid.org/0000-0002-9778-5558
4
http://orcid.org/0000-0003-0238-5381
1Instituto Nacional de Investigaciones Forestales, Agrícolas y Pecuarias, Campo Experimental La Laguna, Matamoros, Coahuila, México, reyes.arturo@inifap.gob.mx
2Instituto Nacional de Investigaciones Forestales, Agrícolas y Pecuarias, Campo Experimental Delicias, Delicias, Chihuahua, México, reta.david@inifap.gob.mx
3Instituto Nacional de Investigaciones Forestales, Agrícolas y Pecuarias, Campo Experimental La Laguna, Matamoros, Coahuila, México, sanchez.juan@inifap.gob.mx
4Instituto Nacional de Investigaciones Forestales, Agrícolas y Pecuarias, Campo Experimental Pabellón, Aguascalientes, México, rodriguez.victor@inifap.gob.mx
5Instituto Nacional de Investigaciones Forestales, Agrícolas y Pecuarias, Campo Experimental La Laguna, Matamoros, Coahuila, México, hernandez.enrique@inifap.gob.mx
6Instituto Nacional de Investigaciones Forestales, Agrícolas y Pecuarias, Campo Experimental La Laguna, Matamoros, Coahuila, México, franco.ivan@inifap.gob.mx
The crop coefficient (Kc) is essential to irrigation scheduling in agriculture. The objectives of this study were to monitor height and vegetation index NDVI in safflower during two growing seasons, develop a new crop coefficient (Kc) based on NDVI and calculate crop evapotranspiration (ETc) taking Kc values. The study was carried out in autumn-winter 2016-2017 and 2017-2018 growing seasons in Matamoros, Coahuila. The cultivars evaluated were; Guayalejo, Selkino and CD-868. Sowing was done in dry soil on December 10 and 12, of 2016 and 2017, respectively. In 2016-2017 growing season three irrigations were applied and 2017-2018 two. NDVIfield values were derived from GreenSeeker and NDVIsatellite were derived from Landsat 7 and 8 images. A relationship was established between NDVIfield and Kc taken from FAO-56 Manual. The results indicated similar NDVI curves in both growing seasons. High determination coefficients (r 2 = 0.93 and 0.89) were recorded between NDVIfield and Kc FAO-56. A linear equation (Kc = 1.064 * NDVI + 0.212) for both growing seasons is supported. The new Kc values were multiplied by the reference evapotranspiration (ETo) to calculate ETc. Whit this equation a calculation model is proposed to derive recommendation irrigation according to safflower phenological stage.
Keywords: GreenSeeker; evapotranspiration; irrigation scheduling
El coeficiente de cultivo (Kc) es esencial para la programación del riego en la agricultura. Los objetivos de este estudio fueron monitorear la altura e índice de vegetación NDVI (índice de vegetación de diferencia normalizada, NDVI por sus siglas en inglés) del cártamo durante dos ciclos de cultivo, desarrollar un nuevo Kc con base en el NDVI y calcular la evapotranspiración de cultivo (ETc), tomando en cuenta los valores de Kc. El estudio se realizó en los ciclos otoño-invierno 2016-2017 y 2017-2018 en Matamoros, Coahuila, México. Se evaluaron los cultivares Guayalejo, Selkino y CD-868. La siembra se realizó en un suelo seco el 10 y 12 de diciembre de 2016 y 2017, respectivamente. En el ciclo 2016-2017 se aplicaron tres riegos de auxilio y en el ciclo 2017-2018 dos. El NDVIcampo se obtuvo con el equipo GreenSeeker y el NDVIsatelital de imágenes Landsat 7 y 8. Se estableció una relación entre el NDVIcampo y el Kc tomado del manual 56 de la FAO. Los resultados indicaron curvas similares de NDVIcampo en ambos ciclos. Altos coeficientes de determinación (r 2 = 0.93 y 0.89) se obtuvieron entre el NDVIcampo y el Kc de FAO-56. Se generó una ecuación lineal (Kc = 1.064 * NDVI + 0.212) para ambos ciclos. Los nuevos valores de Kc se multiplicaron por la evapotranspiración de referencia (ETo) para calcular ETc. Con esta ecuación se propone un modelo de cálculo para derivar recomendaciones de lámina de riego acordes con la etapa fenológica del cártamo.
Palabras clave: GreenSeeker; evapotranspiración; calendario de riego
Introduction
According to National Water Commission (Conagua), consumptive use of water resources for agriculture is 76% (Conagua, 2018). The agricultural production system is the main water user, but not necessarily used efficiently (Reyes-González, Kjaersgaard, Trooien, Hay, & Ahiablame, 2018). Farmers apply more irrigation water than crop needs. Given the prospect of improving irrigation water use and making it more efficient, it is necessary to implement measures that estimate more efficiently crop water demand.
Crop water requirement is equivalent to actual crop evapotranspiration (ETc). For its calculation, data on weather conditions, soil moisture retention capacity and phenological stage of crop must be included. A useful method for estimating ETc is multiply reference evapotranspiration (ET) by a crop coefficient (Kc) (Allen, Pereira, Raes, & Smith, 1998). ETo is estimated based on meteorological data: air temperature, wind speed, relative humidity and solar radiation. Given the changing nature of factors involved in its calculation, Kc can be taken as a reference of literature (Doorenbos & Pruitt, 1977; Allen et al., 1998) or calculated directly in field through sensors. These observations would be directly associated with crop phenological stage.
Biotic and abiotic factors that affect growth and development of crop such as water stress, nutrient deficiency/excess, damage by pests and diseases, among others, affect Kc value and deviate it from published reference value. A significant number of authors suggest that it is better to use Kc values from vegetation indices rather than Kc tables, as this represent the current state of the crop (Bausch, 1993; Gontia & Tiwari, 2010; Lei & Yang, 2014; Adamala, Rajwade, & Reddy, 2016) and its use as a reference can improve programming and efficient water use (Kar, Kumar, & Martha, 2007).
Normalized Difference Vegetation Index (NDVI; Rouse, Haas, Schell, & Deering) has been used for monitoring vegetation, estimating crop yields and stress detection (Kamble, Kilic, & Hubbard, 2013). Various research studies have shown that vegetation indices (estimated with satellite or through devices in field) are used as a reliable basis for predicting Kc's of different crops with good precision (Bausch & Neale, 1987; Jayanthi, Neale, & Wright, 2007; Irmak et al., 2011; Reyes-González et al., 2019). Crops such as alfalfa have been included (Wright, 1982), wheat (Garatuza-Payán, Tamayo, Watts, & Rodríguez, 2003), bean (Laike, Tilahum, K., & Hordofa, 2006), sugar cane (González-Dugo & Mateos, 2008), onion (Trout, 2008), sorghum (Sing & Irmak, 2009), grape (Campos, Neale, Calera, Balbontín, & Gonzalez-Piqueiras, 2010) and corn (Reyes-González et al., 2019). However, the relationship between NDVI field from GreenSeeker and the Kc as it was taken from the FAO-56 manual (Allen et al., 1998) in forage safflower has not been explored.
Safflower is an annual plant with a main stem, primary branches can produce secondary and tertiary branches. Each branch ends with a flower head (capitulum) provided with spines (Dobrin & Marin, 2015). Plant height, number of branches and presence of spines on leaves, depending on variety and environmental conditions (Dajue & Mundel, 1996). Safflower is tolerant to high temperatures, salinity and drought (Dwiedi, Upadhyaya, & Hegde, 2005; Tayebi, Afshari, Farahvash, Sinki, & Nezarat, 2012). These properties are important in plant development and its yield (Saruhan, Saglam, Demiralay, & Kadioğlu, 2012; Tayebi et al., 2012).
Research conducted in Iran, Turkey, India, Romania, Italy and Brazil among others has focused on knowing the needs of different nitrogen levels (Arslan & Bayraktar, 2015; Bonfim-Silva Paludo, Sousa, de Freitas Sousa, & Da Silva, 2015); plant density (Mohammadi, Ghassemi-Golezani, Zehtab-Salmasi, & Nasrollahzaade, 2013; Vaghar, Shamsi, Kobraee, & Behrooz, 2014); irrigation levels (Istanbulluoglu, 2009; Jalali, Salehi, & Bahrani, 2011), and efficiency on water use in safflower (Kar et al., 2007; Lovelli, Perniola, Ferrara, & Di Tommaso, 2007). However, in Mexico, there is little information that has documented obtaining a Kc in forage safflower to improve irrigation scheduling. Due to above, the research objectives were to monitor the height and NDVI vegetation index of safflower during two growing seasons, develop a new Kc based on vegetation index for forage safflower in the Region Lagunera, Mexico and calculate ETc.
Materials and methods
Study area
The research was carried out during the autumn-winter growing seasons 2016-2017 and 2017-2018 in the dairy farm E. and C. Asociados, located in Ejido Purísima, Matamoros, Coahuila, Mexico (Figure 1). Field preparation consisted of fallow, laser tracking and leveling. Three safflower cultivars were evaluated; one with spine (Guayalejo) and two without spines (Selkino and CD-868). Fertilization was carried out on fallow ground using 150-50-00 units of N, P2O5 and K2O, respectively. A nitrogen fertilizer with nitrification inhibitor (3-4 Dimethylpyrazole phosphate) was used as a source of N and monoamonic phosphate was used as a source of P2O5. Fertilizers were incorporated with a step dray, later to make ground leveling. The experimental plot was two ha.

Crop establishment
Sowing was done with a small grain seeder in dry soil at 10 and 12 December, 2016 and 2017, respectively, using a seeding density of 50 kg ha-1; Three days later, irrigation was applied. In the 2016-2017 growing season, three irrigations were applied at 20, 37 and 58 days after sowing (DAS) and in 2017-2018 two irrigations were applied at 30 and 48 DAS. Crop management was carried out by the farmer.
NDVI Measurement
NDVI began to measure at 37 DAS in 2016-2017 growing season and at 25 DAS in 2017-2018, at a height of 0.6 m above crop canopy every eight days, which is the frequency that satellites Landsat 7 and 8 passes through the study area. Five measurements per day were performed by cultivar in 10 linear meters in the plot center. Measurements were made at 10:00 a.m. East-West oriented with GreenSeeker device, which was designed by Oklahoma State University and marketed by NTech Industries (Ukiah, CA, USA). GreenSeeker works by directing a red light (0.660 μm), as well as a near-infrared (0.780 μm) to the crop canopy. The field of view is an oval ranging from 25 to 50 cm depending on the height at which is located the GreenSeeker respect to crop canopy. The measurement height that was used was 0.6 m, having a field of view of 40 cm. The NDVIfield obtained from GreenSeeker for three cultivars of safflower was compared with NDVIsatellite estimated by remote sensing.
Satellite images
Five satellite images were used in 2016-2017 and seven in 2017-2018 growing season to estimate NDVI. Satellite images were collected from Landsat 7 Enhanced Thematic Mapper plus (ETM +) and Landsat 8 Operational Land Imager (OLI) and Thermal Infrared Sensor (TIRS) (path = 30, row = 42) (Table 1). Each image was treated by radiometric, atmospheric correction and illuminated surface (Kjaersgaard & Allen, 2010). The images were selected based on temporary coverage and cloudless conditions. Images with clouds located at 10 km from area of interest were considered acceptable. The images were processed following the recommendations of Allen, Tasumi and Trezza (2007), and Kjaersgaard and Allen (2010) using the METRIC model, which is executed with ERDAS Imagine software version 14.0.
Table 1 Table shows date, DAS and number of Landsat images used in the study.
| Image date | DAS | # Landsat |
|---|---|---|
| 19/01/17 | 37 | 8 |
| 27/01/17 | 45 | 7 |
| 04/02/17 | 53 | 8 |
| 20/02/17 | 69 | 8 |
| 08/03/17 | 85 | 8 |
| 06/01/18 | 25 | 8 |
| 14/01/18 | 33 | 7 |
| 22/01/18 | 41 | 8 |
| 30/01/18 | 49 | 7 |
| 23/02/18 | 73 | 8 |
| 03/03/18 | 81 | 7 |
| 11/03/18 | 89 | 8 |
NDVI was estimated with reflectance value of the wavelength red and near-infrared. For Landsat 7 ETM + bands 3 (0.63-0.69 μm) and 4 (0.77-0.90 μm) were used and for Landsat 8 OLI bands 4 (0.636-0.673 μm) and 5 (0.851-0.879 μm). To avoid mixing NDVIsatellite pixels, a pixel located in the center of plot was used, as the same that measurements with GreenSeeker. Finally, a model of assimilated data was obtained between NDVIsatellite and NDVIfield.
Plant height
It was measured with a tape measure, from ground surface to last crop branch, taking 10 readings per crop per day and averaged. The readings were taken on the same date on which the NDVI field was taken (eight days), coinciding with satellite overpass dates.
Relationship between NDVIfield and Kc FAO-56
The relationship between NDVIfield and actual Kc taken from the FAO-56 manual (Allen et al., 1998) for both growing seasons was established. The general equation obtained from two growing seasons was used to propose a Kc value as a function of NDVI. In the end, new Kc values were multiplied by ETo to generate actual crop evapotranspiration (ETc) and compare it with the reference evapotranspiration, which was taken from meteorological station of INIFAP La Laguna, as well as precipitation and heat units.
Results and discussions
Precipitation and evapotranspiration
Cumulative rainfall was 25.6 mm for 2016-2017 and 38.4 mm for 2017-2018. Precipitation had better distribution in the first year of study, since the greatest events were at the end of growing season after irrigation events (Figure 2). Daily values of reference evapotranspiration (ET) ranged from 1.0 to 6.8 mm dia-1 in 2016 to 2017 and from 0.4 to 5.5 mm dia-1 in 2017-2018 growing season. However, the accumulated values during the growing season (from sowing to harvest) were similar (267 mm for 2016-2017 and 266 mm for 2017-2018). As expected, the minimum value of ETo was recorded at the beginning of each growing season and maximum at the end of it. These values coincided with average temperatures in the Region Lagunera, where cold temperatures (10 °C) are recorded in January and temperate (20 °C) in March. On the other hand, Figure 3 shows heat unit accumulation in two growing season, recording 1075 heat units in the first and 1050 in the second.
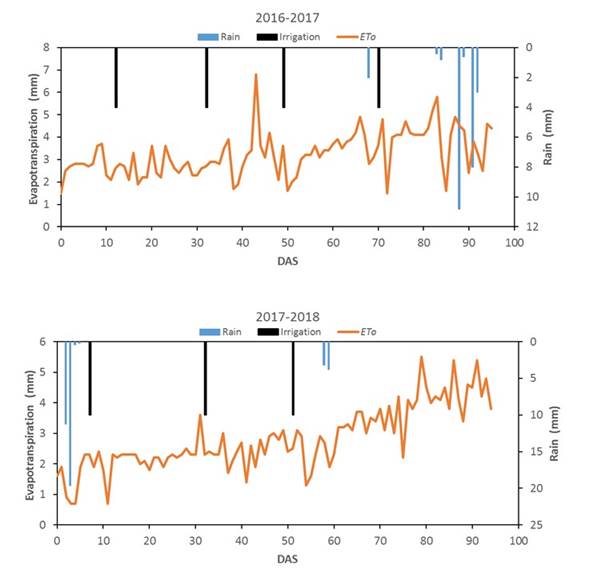
Figure 2 Precipitation, irrigation and ETo in two growing seasons of forage safflower in Matamoros, Coahuila.

NDVI curves
NDVI curves were observed according to phenological stages of crop and only at the end of growing season were noted divergent. This was due to last irrigation for 2016-2017 growing season was applied on February 9, 2017 (58 DAS), in addition to receiving a precipitation of 14.6 mm before harvest, while in 2017-2018 last irrigation event was February 1, 2018 (51 DAS) and received 7 mm of rain before harvest. Therefore, NDVI values in 2016-2017 remained at 0.8 and values in 2017-2018 decreased to 0.6 at the end of the growing season (Figure 4). However, Tasumi, Allen, Trezza and Wright (2005) reported that NDVI values are unaffected by soil moisture in a study conducted on 383 agricultural fields in Southern Idaho, USA. In general, NDVI values obtained in field with GreenSeeker for both growing seasons were averaged 0.2, 0.8 and 0.6 for initial, maturity and senescence stages, respectively. Similar values of NDVI were reported by Hajare, Patil and Verma (2008) for two growing seasons in safflower sown in three types of soil in Nagpur, India, although, at the end of season the values fall (0.2) when safflower was dry.
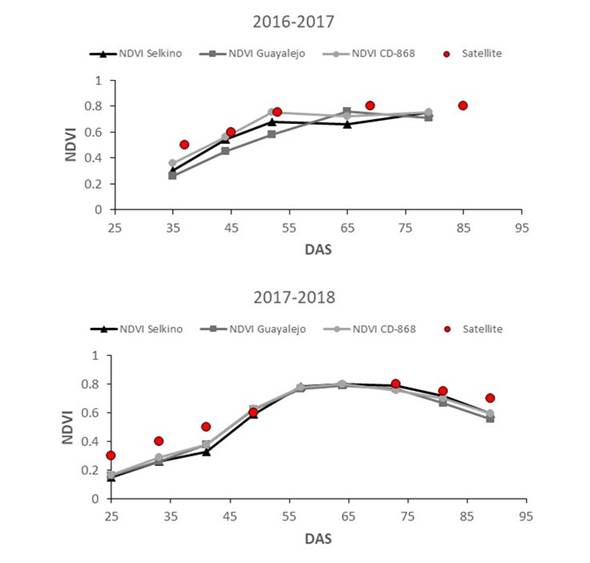
Figure 4 NDVI curves taken with GreenSeeker for three safflower cultivars. Red circles represent NDVI derived from satellite in two growing seasons.
The discrepancy between NDVI values derived from satellite and values obtained in the field with GreenSeeker were higher at the beginning and at the end of growing season (Figure 4). This difference was due to field measurements are directly to canopy covering an area of 0.4 m, while satellite estimates an area of 30 x 30 m canopy and bare soil. Field measurements were made at the same day that satellite overpass dates through the study area. The images used were in cloudless days.
Similar NDVI curves in wheat, sugarcane, cotton and corn were reported by Garatuza-Payán et al. (2003); Zhang, Anderson, and Wang (2015); French, Hunsaker and Thorp (2015), and Reyes-González et al. (2019), respectively. Those authors found discrepancy in the first and last stage of the crop between satellite images and field measurements. Results suggest that period of greatest difference between satellite and GreenSeeker occurs when NDVI values are less than 0.6. Vegetation Index Adjusted Soil (SAVI) (Huete, 1988), is recommended for satellite, since this minimizes soil reflectance in the first and last stages of the crop when vegetation cover is limited. On the other hand, Reyes-González et al. (2018) documented that the beginning and end of growing season corn ET value obtained from NDVI was less accurate. However, for irrigation calendar purposes this method may be acceptable. In another study, Anderson, Allen, Morse and Kustas (2012) reported that ETc calculated from vegetation indices was underestimated in irrigated areas in Idaho, USA.
Figure 5 shows vegetation cover development of safflower variety CD-868 during the 2017-2018 growing season, which began with low values, subsequently increases and at the end decreases slightly.

Relationship between NDVIfield and NDVIsatellite
With satellite images, five NDVI values were obtained in 2017-2018 and seven in 2017-2018. Figure 6 shows the relationship between NDVI obtained from field and NDVI obtained with images. A good relationship was found between measured and estimated with high coefficient of determination (r2 = 0.96). This reliability degree shows that satellite is a useful tool not only for estimating NDVI at regional scale but also at field scale. High correlations (r2 = 90) of NDVI between measured in the field with radiometer (MSR87) and estimated with remotely sensors were observed by Duchemin et al. (2006) in 13 agricultural fields in Morocco, Africa.

Plant height
Figure 7 shows growth dynamics in plant height of three safflower cultivars evaluated during two growing seasons. At 25 DAS crop showed a height of ~5 cm and in the rosette stage a height of 10 cm (40 DAS). Subsequently, at 44 DAS stem elongation began until reaching reproductive stage with the beginning of capitulum formation at 80 DAS, with plant height was between 90 and 100 cm. The stem and branches continue growing and differentiation and development of capitulum parts became distinguishable at 93 DAS, although capitulum was not yet open. On this date safflower plants reached between 111 and 151 cm. The Guayalejo and CD-868 cultivars had the highest plant height and the Selkino cultivar showed the lowest in both growing seasons. In previous work, it was reported that crop had a growing season between 82 and 95 DAS reaching heights between 82 and 93 cm (Reta et al., 2014; Reta et al., 2017). This comparison indicates that plant heights were higher than those observed in previous studies in the Region. They were also higher than heights reported by Tayebi et al. (2012) who obtained maximum heights (80 cm) in safflower established with different levels of evapotranspiration in Tabriz, Iran. However, similar heights (from 104 to 149 cm) were reported by Kizil, Cakmak, Kirici and Inan (2008) in safflower established in Eskishehir, Turkey. Bagheri, Saeedi and Zaeh (2006) mention that available soil moisture affects plant height in a study in Esfahan, Iran.

On the other hand, Figure 8 shows a polynomial second-order relationship between plant height and NDVI of safflower, which accounts between 64 and 92% total observed variation NDVI in the first growing season (2016-2017) and between 83 and 87% in the second growing season (2017-2018).

Relationship between NDVIfield and Kc FAO-56
NDVI values were taken from three safflower cultivars evaluated for two growing season, while Kc values were obtained from the FAO-56 manual. Figure 9 shows the relationship between NDVIfield of three safflower cultivars and tabulated Kc for two growing seasons. In the first growing season the relationship between NDVIfield and Kc showed an R 2 = 0.93 and for the second season of 0.89, showing a good relationship between NDVIfield and Kc. Nevertheless, in the second season the “r” value decreased slightly, this was due to crop presented stress conditions due to bad programming irrigation schedule because only two irrigations were applied and bad precipitation distribution during the growing season. Hence, the relationship between NDVIfield and Kc was slightly low, since Kc from FAO is developed for well-irrigated crops and without moisture and nutrient restrictions (Allen et al., 1998). Even though, FAO-56 Kc values after 50 DAS were 1.0, while the NDVIfield values ranged between 0.65 and 0.8.
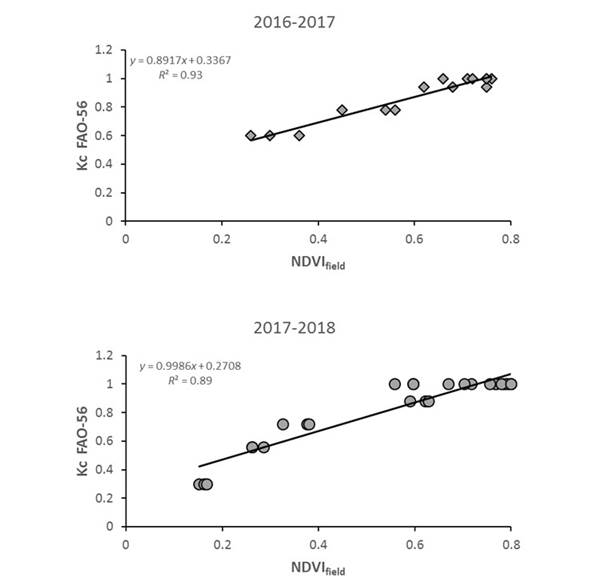
Figure 9 Relationship between NDVIfield of three forage safflower cultivars and Kc FAO-56 in two growing seasons.
High correlations have been reported between NDVIfield and Kc taken from FAO tables for many crops. Rocha, Perdigão, Melo and Henriques (2012) and Reyes-González et al. (2016) reported high determination coefficients (r2 = 0.99), for corn and alfalfa. Consoli, Russo and Snyder (2006); Singh and Irmak (2009); Gontia and Tiwari (2010); Kukal, Irmak and Kilic (2017), and Palacios-Vélez, Palacios-Sánchez and Espinosa-Espinosa (2018) reported good relationships between NDVI and Kc for orange (r 2 = 0.80), sorghum (r 2 = 0.87), wheat (r 2 = 0.80), soybean (r 2 = 0.81) and grape (r 2 = 0.83), respectively. The differences between high and low ratios occur mainly by crop management.
Development of general equation of Kc
NDVI taken in field and Kc obtained from FAO-56 was used to develop linear regression equations for two growing seasons (Figure 9). The equations obtained for both seasons were compared using the "t" test method to test statistical difference between two independent regressions. After the test, the calculated “t” value was lower (0.76) than tabulated “t” value (1.68), indicating that there was no significant statistical difference between two equations. Based on this result, all data (two growing seasons) were pooled and a new equation was generated for safflower in the Region Lagunera (Figure 10).

Several equations have been generated from vegetation indices for different crops. For instance, Consoli et al. (2006) developed an equation using NDVI in orange in Italy (Kc = 1.262 * NDVI + 0.287); Singh and Irmak (2009), for soybeans in USA (Kc = 1.217 * NDVI-0.034); Campos et al. (2010) for grapes in Spain (Kc = 1.44 * NDVI - 0.10); Gontia and Tiwari (2010), for wheat in India (Kc = 2.7109 * NDVI - 0.424); Rocha et al. (2012) for corn in Portugal (Kc = 1.37 * NDVI - 0.017), and Reyes-González, Hay, Kjaersgaard, and Neale (2015) for alfalfa in Mexico (Kc = 2.112 * NDVI - 0.4989). These equations were generated for developing new Kc values in local conditions as recommended Doorenbos and Pruitt (1977) and Allen et al. (1998), to improve water management in agriculture.
The generated equation (Kc = 1.0644 * NDVI + 0.2128 ) in Figure 10 was used to develop a new Kc curve for forage safflower, taking days after sowing (Figure 11). Similar Kc values for safflower were reported by Kar et al. (2007) in Dhenkanal, India, who reported values of 0.37 in the initial stage, 0.94 in development, 1.29 in maturity and 0.35 at the end of growing season. However, in last two stages (maturity and final) there was a difference with those found in this study, being more remarkable at the end of season, since safflower evaluated at the Region Lagunera is used for forage and is harvested in green, so it does not reach physiological maturity as safflower that is used for seed.

Comparison between ETo and ETc
The ETo values were taken from weather station located at La Laguna Experimental station, which is 15 km from the study area, while ETc values are the result of multiplying new Kc values by ETo. Figure 12 shows comparison between ETo and ETc for 2017-2018 growing season. At beginning of growing season (1-20 DAS) ETo values were around 2 mm day-1, while ETc were 0.23 mm day-1. In development stage (21-57 DAS) ETo values oscillated in 2.5 mm day-1 and ETc values ranged from 0.3 to 2.5 mm day-1. In maturity stage (58-85 DAS) values between ETo and ETc were similar (3.5 mm day-1). At the end of season (86-95 DAS) ETo remained at 4.5 mm day-1 and ETc decreased to 3.0 mm day-1. The figure shows that at beginning of season daily ETo was higher than ETc and in middle of season values were similar. This indicates that with ETc crop water demand is consistent with crop phenological stages. Higher ET values (6.0 mm day-1) than our values were reported by Lovelli et al. (2007) and Kar et al. (2007). However, different ETo values in safflower varieties under different weather and soil conditions can vary from 200 to 1 000 mm per season (Istanbulluoglu, 2009).

Understanding different development stages of crop and the exact amount of water applied; producers may improve irrigation scheduling, water management and increase sustainability of water resources in crops. Reyes-González et al. (2016) reported that farmers should use ETc instead of ETo for scheduling irrigation in arid and semi-arid regions where water is scarce.
Conclusions
NDVI and height values were affected by irrigation scheduling and rainfall received during two growing seasons. On the other hand, the relationship between NDVIfield and Kc from FAO-56 was good, although in the second season was low due to poor irrigation scheduling and rain distribution, since Kc from FAO were developed for crops without soil moisture restrictions.
The equation generated between NDVIfield and Kc FAO-56 for both growing seasons was used to develop new Kc values for forage safflower. This meant that vegetation indices are a useful tool to generate Kc's locally. With new Kc values achieved, water will be applied according to different phenological stages and/or crop water requirement, helping to improve irrigation scheduling and making more efficient water use in agriculture.
Referencias
Adamala, E., Rajwade, Y. A., & Reddy, Y. V. K. (2016). Estimation of wheat crop evapotranspiration using NDVI vegetation index. Journal of Applied and Natural Science, 8(1), 159-166. [ Links ]
Allen, R. G., Pereira, L. S., Raes, D., & Smith, M. (1998). Crop evapotranspiration (guidelines for computing crop water requirements). Rome, Italy: FAO Irrigation and Drainage Paper 56. [ Links ]
Allen, R. G., Tasumi, M., & Trezza, R. (2007). Satellite-based energy balance for mapping evapotranspiration with internalized calibration (METRIC)-model. Journal of Irrigation and Drainage Engineering, 131, 380-394. [ Links ]
Anderson, M. C., Allen, R. G., Morse, A., & Kustas, W. P. (2012). Use of Landsat thermal imagery in monitoring evapotranspiration and managing water resources. Remote Sensing of Environment, 122, 50-65. DOI: http://dx.doi.org/10.1016/j.rse.2011.08.025 [ Links ]
Arslan, Y., & Bayraktar, N. (2015). Effect of different levels of nitrogen and phosphorous on some yield component of safflower (Carthamus tinctorious L.) in dry conditions. Uluslararasi Tarim ve Yaban Hayati Bilimleri Dergisi, 1(2), 94-103. [ Links ]
Bagheri, H., Saeedi, R., & Zaeh, E. (2006). Evaluation of agronomic traits of selected genotypes from safflower mass native in the spring and summer planting. Agricultural Technology and Science and Natural Resources, 10, 375-390. [ Links ]
Bausch, W. C., & Neale, C. M. U. (1987). Crop coefficients derived from reflect canopy radiation: A concept. Transactions of ASAE, 30(3), 703-709. [ Links ]
Bausch, W. C. (1993). Soil background effects in reflectance-based crop coefficient for corn. Remote Sensing of Environment, 46, 213-222. [ Links ]
Bonfim-Silva, E. M., Paludo, J. T. S., Sousa, J. V. R., De Freitas-Sousa, H. H., & Da Silva, T. J. A. (2015). Development of safflower subjected to nitrogen rates in cerrado soil. American Journal of Plant Sciences, 6(13), 2136-2143. Recuperado de http://dx.doi.org/10.4236/ajps.2015.613215 [ Links ]
Campos, I., Neale, C. M. U., Calera, A., Balbontín, C., & Gonzalez-Piqueiras, J. (2010). Assessing satellite-based basal crop coefficient for irrigated grapes (Vitis vinífera L.). Agricultural Water Management, 98, 45-54. [ Links ]
Conagua, Comisión Nacional del Agua. (2018). Estadísticas del agua en México. Ciudad de México, México: Secretaría de Medio Ambiente y Recursos Naturales, Comisión Nacional del Agua. [ Links ]
Consoli, S., Russo, A., & Snyder, R. (2006). Estimating evapotranspiration of orange orchards using surface renewal and remote sensing techniques. In: Urso, G. D., Osann-Jochum, M. A., & Moreno, J. (eds.). Earth observation for vegetation monitoring and water management (pp. 185-192). Maryland, USA: American Institute of Physics. [ Links ]
Dajue, L., & Mundel, H. H. (1996). Safflower. Carthamus tinctorius L. Promoting the conservation and use of underutilized and neglected crops. 7. Rome, Italy: Institute of plant Genetics and Crop Plant Research, Gatersleben/International Plant Genetics Resources Institute. [ Links ]
Dobrin, A., & Marin, D. I. (2015). Research on safflower (Carthamus tinctoriuos L.) crop in the conditions of southeastern Romania. Scientific Papers. Series A. Agronomy, 58, 181-184. [ Links ]
Doorenbos, J., & Pruitt, W. O. (1977). Guidelines for predicting crop water requirements. Irrigation and Drainage Paper No 24. Roma, Italy: Food and Agriculture Organization. [ Links ]
Duchemin, B., Hadria, R., Erraki, S., Boulet, G., Maisongrande, P., Chehbouni, A., Escadafal, R., Ezzahar, J., Hoedjes, J. C. B., Kharrou, M. H., Khabba, S., Mougenot, B., Olioso, A., Rodríguez, J. C., & Simonneaux, V. (2006). Monitoring wheat phenology and irrigation in Central Morocco: On the use of relationships between evapotranspiration, crops coefficients, leaf area index and remotely-sensed vegetation índices. Agricultural Water Management, 79(1), 1-27. [ Links ]
Dwiedi, S. L., Upadhyaya, H. D., & Hegde, D. M. (2005). Development of core collection in safflower (Carthamus tinctorius L.) germplasm. Genetics Resources and Crop Evolution, 52, 821-830. DOI: 10.1007/s10722-003-6111-8 [ Links ]
French, A. C., Hunsaker, D. J., & Thorp, K. R. (2015). Remote sensing of evapotranspiration over cotton using the TSEB and METRIC energy balance model. Remote Sensing of Environment, 158, 281-294. [ Links ]
Gontia, N. K., & Tiwari, K. N. (2010). Estimation of crop coefficient and evapotranspiration of wheat (Triticum estivum) in an irrigation command using remote sensing and GIS. Water Resource Management, 24, 1399-1414. [ Links ]
Garatuza-Payán, J., Tamayo, A., Watts, C., & Rodríguez, J. V. (2003). Estimation large area wheat evapotranspiration from remote sensing data. Paper presented at the Geoscience and Remote Sensing Symposium, 2003, IEEE International, Toulouse, France. [ Links ]
González-Dugo, M. P., & Mateos, L. (2008). Spectral vegetation indices for benchmarking water productivity of irrigation cotton and sugar beet crops. Agricultural Water Management, 95, 48-58. [ Links ]
Hajare, T. N., Patil, N. G., & Verma, K. S. (2008). On spectral indices as a function of soil variability in safflower crop. Journal of Indian Society Remote Sensing, 36, 267-272. [ Links ]
Huete, A. R. (1988). A soil-adjusted vegetation index (SAVI). Remote Sensing Environment, 25, 295-309. [ Links ]
Irmak, A., Ratcliffe, I., Ranade, P., Hubbard, K. G., Singh, R. K., Kamble, B., & Kjaersgaard, J. (2011). Estimation of land surface evapotranspiration with a satellite remote sensing procedure. Great Plains Research, 21, 73-88. [ Links ]
Istanbulluoglu, A. (2009). Effect of irrigation regimes on yield and water productivity of safflower (Carthamus tinctorius L.) under Mediterranean climatic conditions. Agricultural Water Management, 96, 1792-1798. [ Links ]
Jalali, A. H., Salehi, F., & Bahrani, M. J. (2011). Effects of different irrigations intervals and weed control on yield and yield components of safflower (Carthamus tinctorius L.). Archives of Agronomy and Soil Science, 58, 1261-1269. DOI: 10.1080/03650340.2011.587805 [ Links ]
Jayanthi, H., Neale, C. M. U., & Wright, J. L. (2007). Development and validation of canopy reflectance-based crop coefficient for potato. Agricultural Water Management, 88(1-3), 235-246. [ Links ]
Kamble, B., Kilic, A., & Hubbard, K. (2013). Estimating crop coefficients using remote sensing-based vegetation index. Remote Sensing, 5(4), 1588-1602. [ Links ]
Kar, G., Kumar, A., & Martha, M. (2007). Water use efficiency and crop coefficient of dry season oilseed crops. Agricultural Water Management, 87, 73-82. [ Links ]
Kizil, S., Cakmak, O., Kirici, S., & Inan, M. (2008). A comprehensive study on safflower (Carthamus tinctorius L.) in semi-arid conditions. Biotechnology & Biotechnological Equipment, 22(4), 947-953. [ Links ]
Kukal, M., Irmak, S., & Kilic, A. (2017). Long-term spatial and temporal maize and soybean evapotranspiration trends derived from ground-based and satellite-based dataset over the great plains. Journal of Irrigation and Drainage Engineering, ASCE, 149(9), 04017031 [ Links ]
Kjaersgaard, J., & Allen, R. G. (2010). Remote sensing technology to produce consumptive water use maps for the Nebraska Panhandle (Technical Report 88). Lincoln, USA: University of Nebraska. [ Links ]
Laike, S., Tilahum, K., & Hordofa, T. (2006). Crop coefficient of Haricot Bean at Melkassa, Central Rift Valley of Ethiopia. Journal of Agriculture and Rural Development in the Tropics and Subtropics, 107, 33-40. [ Links ]
Lei, H., & Yang, D. (2014). Combining the crop coefficient of winter wheat and summer maize with remotely sensed vegetation index for estimating evapotranspiration in the North China Plain. Journal of Hydrology Engineering, 19, 243-251. [ Links ]
Lovelli, S., Perniola, M., Ferrara, A., & Di Tommaso, T. (2007). Yield response factor to water (Ky) and water use efficiency of Carthamus tintorius L. and Solanum melongena L. Agricultural Water Management, 92, 73-80. [ Links ]
Mohammadi, M., Ghassemi-Golezani, K., Zehtab-Salmasi, S., & Nasrollahzaade, S. (2013). Assessment of some physiological traits in spring safflower (Carthamus tinctorius L.) cultivars under water stress. International Journal of Life Sciences, 10(1), 58-64. [ Links ]
Palacios-Vélez, E., Palacios-Sánchez, L. A., & Espinosa-Espinosa, J. L. (2018). Evaluation of water use efficiency in irrigated agriculture supported by satellite images. Tecnología y ciencias del agua, 9(1), 31-38. [ Links ]
Reta, S. D. G., Serrato, C. J. S., Gaytán, M. A., Quiroga, G. H. M., Orozco, H. G., & Payán, G. J. A. (2014). Potencial forrajero del cártamo en respuesta al distanciamiento entre surcos en la Comarca Lagunera. Agrofaz, 14(3), 65-71. [ Links ]
Reta, S. D. G., Sánchez, D. J. I., Reyes, G. A., Ochoa, M. E., Chew, M. I. Y., & Gaytán, M. A. (2017). Evaluación semicomercial de cártamo forrajero en siembras tardías durante otoño-invierno en la Comarca Lagunera, México. Agrofaz, 17(1), 51-63. [ Links ]
Reyes-González, A., Hay, C., Kjaersgaard, J., & Neale, C. M. U. (2015). Use of remote sensing to generate crop coefficient and estimate actual crop evapotranspiration. 2015 ASABE Annual International Meeting, New Orleans, Louisiana, USA. [ Links ]
Reyes-González, A., Trooien, T., Kjaersgaard, J., Hay, C., & Reta Sánchez, D. G. (July, 2016). Development of crop coefficients using remote sensing-based vegetation index and growing degree days. In: Proceedings of the ASABE Annual International Meeting, Orlando, USA. [ Links ]
Reyes-González, A., Kjaersgaard, J., Trooien, T., Hay, C., & Ahiablame, L. (2018). Estimation of crop evapotranspiration using satellite remote sensing-based vegetation index. Advances in Meteorology, 2018, 1-12. DOI: https://doi.org/10.1155/2018/4525021 [ Links ]
Reyes-González, A., Reta, S. D. G., Sánchez, D. J. I., Ochoa, M. E., Rodríguez, H. K., & Preciado, R. P. (2019). Estimación de la evapotranspiración de maíz forrajero apoyada con sensores remotos y mediciones in situ. Terra Latinoamericana, 37, 279-290. DOI: https//doi.org/10.28940/terra.v37i3.485 [ Links ]
Rocha, J., Perdigão, A., Melo, R., & Henriques, C. (2012). Remote sensing based crop coefficients for water management in agriculture. Sustainable Development-Authoritative and Leading Edge Content for Environmental Management, Curkovic, S. (eds.), IntechOpen. DOI: 10.5772/48561 [ Links ]
Rouse, J. W. Jr., Haas, R. H., Schell, J. A., & Deering, D. W. (December, 1974). Monitoring vegetation systems in the Great Plains with ERTS. Proceeding of Third ERTS Symposium, 1974, NASA SP-351, Washington, USA. [ Links ]
Saruhan, G. N., Saglam, A., Demiralay, M., & Kadioğlu, A. (2012). Apoplastic and symplastic solute concentrations contribute to osmotic adjustment in bean genotypes during drought stress. Turkish Journal Biology, 36, 151-160. DOI: 10.3906/biy-1101-177 [ Links ]
Singh, R., & Irmak, A. (2009). Estimation of crop coefficient using satellite remote sensing. Journal of Irrigation and Drainage Engineering, ASCE, 135, 597-608. [ Links ]
Tasumi, M., Allen, R. G., Trezza, R., & Wright, J. L. (2005). Satellite-based energy balance to assess within-population variance of crop coefficient curves. Journal of Irrigation and Drainage Engineering, 131(1), 94-109. [ Links ]
Tayebi, A., Afshari, H., Farahvash, F., Sinki, J. M., & Nezarat, S. (2012). Effect of drought stress and different planting dates on safflower yield and its components in Tabriz region. Iranian Journal of Plant Physiology, 2(3), 445-453. [ Links ]
Trout, T. J. (2008). Remote sensing of canopy cover in horticultural crops. HortScience, 43(2), 333-337. [ Links ]
Vaghar, M. S., Shamsi, K., Kobraee, S. & Behrooz, R. (2014). The effect of planting row interval and plant density on the phonological traits of safflower (Carthamus tinctorius L.) dryland conditions. International Journal of Bioscience, 4(12), 202-208. [ Links ]
Wright, J. L. (1982). New evapotranspiration crop coefficients. ASCE Journal of the Irrigation and Drainage Division, 108(1), 57-74. [ Links ]
Zhang, H., Anderson, R. G., & Wang, D. (2015). Satellite-based crop coefficient and regional water use estimates for Hawaiian sugarcane. Field Crops Research, 180, 143-154. [ Links ]
Received: November 07, 2019; Accepted: February 27, 2020
 Este es un artículo publicado en acceso abierto bajo una licencia
Creative Commons
Este es un artículo publicado en acceso abierto bajo una licencia
Creative Commons
