


Servicios Personalizados
Revista
Articulo
 texto en
  Inglés (pdf)
 Artículo en XML
 Referencias del artículo
 Enviar artículo por email
Indicadores
-
 Citado por SciELO
 -
 Accesos
Links relacionados
-
 Similares en
SciELO
Similares en
SciELO
Compartir

 Permalink
Tecnología y ciencias del agua
versión On-line ISSN 2007-2422
Tecnol. cienc. agua vol.11 no.6 Jiutepec nov./dic. 2020 Epub 15-Jun-2024
https://doi.org/10.24850/j-tyca-2020-06-07
Articles
Generation of municipal water security indices by a probabilistic approach
1
 http://orcid.org/0000-0002-6577-6497
2
http://orcid.org/0000-0002-5509-2876
3
http://orcid.org/0000-0003-2081-8179
4
http://orcid.org/0000-0001-9173-7515
5
http://orcid.org/0000-0002-9239-8081
6
http://orcid.org/0000-0003-2127-6068
1Consultor, México, farreguin2011@gmail.com
2Instituto Mexicano de Tecnología del Agua, Jiutepec, Morelos, México, manuel_rodriguez@tlaloc.imta.mx
3Instituto Mexicano de Tecnología del Agua, Jiutepec, Morelos, México, velitchk@tlaloc.imta.mx
4Instituto Mexicano de Tecnología del Agua, Jiutepec, Morelos, México, pcortes@tlaloc.imta.mx
5Instituto Mexicano de Tecnología del Agua, Jiutepec, Morelos, México, oscar_llaguno@tlaloc.imta.mx
6Instituto Mexicano de Tecnología del Agua, Jiutepec, Morelos, México, edgar_mendoza@tlaloc.imta.mx
7Instituto Mexicano de Tecnología del Agua, Jiutepec, Morelos, México, arizabeth_sainos@tlaloc.imta.mx
8Instituto Mexicano de Tecnología del Agua, Jiutepec, Morelos, México, juanfco@tlaloc.imta.mx
9Instituto Mexicano de Tecnología del Agua, Jiutepec, Morelos, México, dortega@tlaloc.imta.mx
10Consultor, México, horita_2005@yahoo.com.mx
Water is turning to be scarce in many countries in the world, in the 21st century, caused by an increase in its demand due to population growth, increased food production and higher energy consumption, linked to a temporary climate variation. Governments must establish water security programs by planning the management of water resources, as a paradigm shift. Mexico is not the exception, a country of strong meteorological, hydrographic and social contrasts throughout its territory, which impact in different ways the population strata, similar to other developing countries. In this context, hazard, social vulnerability and risk indices are proposed and quantified in this paper, through a probabilistic methodology for calculating water security. Hazard is expressed by basic water services shortage, floods, groundwater depletion, and drought indicators. In turn, the vulnerability considers educational level of the population, access to health services, infant mortality rate, illiteracy, housing conditions, unemployment and proportion of indigenous language population. In the development of this study it is shown that both hazard and vulnerability throughout the Mexican territory are very heterogeneous. The proposed probabilistic methodology was implemented in a Geographical Information System obtaining water security indices for all municipalities in Mexico (2 456 municipalities).
Keywords: Water security; municipalities; probability; indices; risk; vulnerability
En el siglo XXI, el agua escasea en Latinoamérica y el Caribe por el aumento de la demanda, resultado de un crecimiento poblacional, incremento de la producción de alimentos y mayor consumo energético, vinculados con una variación temporal del clima. Los gobiernos deben establecer programas de seguridad hídrica, a través de la planeación de la gestión del recurso agua, como un cambio del paradigma. México no es la excepción, un país de fuertes contrastes meteorológicos, hidrográficos y sociales a lo largo de su territorio, que afectan de varias formas a los diferentes estratos de la población, similar a otros países en desarrollo. En este contexto, se proponen y cuantifican índices de peligro, vulnerabilidad social y riesgo mediante una metodología probabilística para el cálculo del índice de seguridad hídrica. El peligro se expresa por indicadores como acceso a los servicios básicos de agua, inundaciones, abatimiento del nivel freático y sequias. A su vez, la vulnerabilidad contempla proporción de médicos por cada 1 000 habitantes, tasa de mortalidad infantil, población derechohabiente, analfabetismo, condiciones de la vivienda, población económicamente activa, razón de dependencia, tasa de desempleo abierto y población de habla indígena. En el desarrollo de este estudio se demuestra que tanto el peligro como la vulnerabilidad a lo largo del territorio mexicano son muy heterogéneos. La metodología probabilística propuesta se apoyó en un sistema de información geográfica, lo que permitió obtener índices de seguridad hídrica para todos los municipios de México (2 456 municipios).
Palabras clave: seguridad hídrica a nivel municipal; peligro; vulnerabilidad; riesgo
Introduction
Mexico has had an accelerated population growth in recent years, which has been related to different problems, such as providing different types of public services: water, gas, electricity, etc. to the main urban centers of the country. Given this, a sustainable management of natural resources is needed, trying to minimize its impact on the environment.
Currently there are various problems around water: overexploited aquifers, pollution and lack of sanitation of water bodies, unequal access to basic water services and hydraulic infrastructure deterioration, among others (Arreguín Cortes, López Pérez, Rodríguez López, & Montero Martínez, 2015). For these reasons, attention in the management of natural resources, and in particular water, must be put and a rational use of it is a priority.
Social vulnerability of Mexican people plays an important role in the management of resources, because in the country the social strata are very marked, for example, the National Institute of Statistics, Geography and Informatics (INEGI, 2019) mentions that 43.6 % of the total population of Mexico is in poverty, identifying 26.8 million people with social deprivation.
The greater frequency and severity of extreme weather events (droughts and floods) generates the need for proactive management of water resources to face these threats (GWP, 2012).
The growing demand and scarcity of water that is currently lived, requires setting a strategic objective that contemplates the management of water resources, which is why the concept of water security has recently been incorporated, which has been the subject of numerous meetings and international agreements (ONU-AGUA, 2013). However, its definition differs between the different authors, according to the problems that are intended to be solved.
This means that the definition of water security must conceptualize in a real way the problems that are currently being experienced, since this will allow the development of a more precise definition.
Background
Several definitions have been proposed for the concept of water security by different authors. In Mexico, for example, Martínez-Austria (2013) defines it as the condition that ensures the sustainable supply of water for all uses, in conditions of equity and at affordable prices, to promote health, economic development, food production, energy and environmental conservation. Authors such as Mason and Roger (2012), add that this term must manage the risks associated with water, including floods, droughts and contamination, and Norman, Bakker, Cook, Dunn, and Allen (2010) add sufficient protection to ecosystems.
The United Nations (ONU-AGUA, 2013), as well as the Global Water Partnership (GWP, 2016), add to the above that protection against water-borne pollution and related disasters must be ensured in a climate of peace and political stability.
In 2017 (IMTA, 2017) and 2018 (IMTA, 2018), the Mexican Institute of Water Technology (IMTA) worked on a project named Water Security Indices. A methodology to determine water security indices at municipal level throughout the Mexican Republic was developed, based on a probabilistic analysis of the occurrence of some meteorological phenomena and population's ability to face them, represented through water related hazard, vulnerability, risk and security analysis maps, as presented below in this paper. Information from various official Mexican public agencies was used, such as INEGI, CENAPRED and Conagua.
Materials and methods
Among the methodologies that exist for measuring the water security, there is one applied to the Asia Pacific region (AWDO, 2013) that accounts for: household satisfaction (in sanitation and drinking water), supply capacity in agriculture, mining, industry and energy to obtain a productive benefit; in addition to the support of services related to water to improve its quality.
Mason and Roger (2012) proposed to group the water security index into 5 items: 1) ability to access water resources, 2) management of variability and risk, 3) satisfaction of human needs, 4) attention to environmental requirements and 5) management of competition and conflicts related to the use of water resources. Ait-Kadi and Linckaen (2016) proposed an indicator based on three dimensions: social, environmental and economic. Gain, Giupponi, and Wada (2016) proposed a Global Water Security Index (GWSI) for objective 6 of the 17 global objectives for Sustainable Development established by the United Nations Organization (ONU, 2017).
The present paper proposes to generate municipal level water security indices with a probabilistic approach that takes into account the anthropogenic phenomena hazards and the population vulnerability.
Hazard index calculation
The hazard index is quantified in terms of the probability of the occurrence of a phenomenon in a given, estimated time period, that is potentially damaging to exposed goods, or the probability of problems with access to drinking water and sanitation services. The hazard index is described as the forces, conditions or technologies that carry potential social, infrastructural or environmental damage. A hazard can be a hurricane, an earthquake, or an avalanche (Oliver-Smith & Hoffman, 2002). For this study, the hazard was integrated by four indicators that are described below.
Global basic Water-Service Access Index (GWSAI)
This index allows evaluating the impact of the coverage, quality and efficiency of drinking water and sanitation services, in terms of access to drinking water and sanitation services, and is evaluated by the following indicators: access to drinking water services, calculated with the information referring to: urban drinking water coverage (%), rural drinking water coverage (%) and disinfected water (% ). The indicator of access to sanitation services is composed of urban sewerage coverage (%), rural sewerage coverage (%), efficiency of collection of the generated wastewater (%) and coverage of municipal wastewater treatment (%).
To integrate all the information, the variables were normalized with respect to their minimum and maximum values according to (Equation 1):
where:
Normalized variable |
|
Associated variable |
|
Minimum value of the variable data |
|
Maximum value of the variable data |
|
i |
1 to n |
j |
Value of variable i for the unit |
n |
Number of variables involved in the index |
Finally, the index of lack of access to water and sanitation services Ilawss is expressed by (Equation 2). The result is shown in Figure 1.

Figure 1 identifies the municipalities with the greatest problems of supply and access to drinking water and sewerage services, both in urban and rural areas. The state of Oaxaca stands out, with deficiencies in 83% of its municipalities, that is, 476 municipalities are in regular, deficient or very deficient conditions. Due to its extension, Chihuahua has the largest area in a very deficient zone of this indicator (1- GWSAI), followed by Oaxaca and Durango.
Table 1 shows the number of municipalities divided in ranges of the indicator Ilawss. In summary, it can be said that at national level 27% of the population has problems of access to drinking water services, with very deficient, deficient or regular drinking water and sewerage services, and that this population is located in 1485 municipalities.
Table 1 Lack of access to water and sanitation services Ilawss.
| Range | Number of municipalities | Percentage of municipalities (%) | Population | Percentage of country’s population (%) | Territorial extent (km2) | Percentage of country’s territorial Extent (%) |
|---|---|---|---|---|---|---|
| 0.74 - 1 (Very deficient) | 250 | 10.2 | 3 893 120 | 3.5 | 201 785.20 | 10.3 |
| 0.58 - 0.73 (Deficient) | 496 | 20.2 | 8 836 691 | 7.9 | 336 915.99 | 17.2 |
| 0.42 - 0.57 (Regular) | 739 | 30.1 | 17 578 666 | 15.6 | 506 165.57 | 25.9 |
| 0.24 - 0.41 (Suitable | 725 | 29.5 | 44 741 873 | 39.8 | 559 802.18 | 28.6 |
| 0.01 - 0.23 (Very suitable) | 246 | 10.0 | 37 286 188 | 33.2 | 351 570.26 | 18.0 |
| Total | 2 456 | 100.0 | 112 336 538 | 100.0 | 1 956 239.19 | 100.0 |
Drought Index (Id)
In Mexico, the National Meteorological Service (Servicio Meteorológico Nacional or SMN in Spanish) is the official government agency in charge of providing meteorological (weather) and climatological information. To do this, it uses observation networks, such as automatic meteorological stations, synoptic observatories, radars, sounding radio stations and satellite image receiving stations. As part of its monitoring activities, SMN is in charge of detecting the current state and evolution of the drought (Conagua-SMN, 2018) through the so called Drought Monitor in Mexico (MSM, from Monitor de Sequía in México in Spanish), which in turn is part of the North American Drought Monitor (NADM). MSM started to operate in 2002, within the activities of the NADM, but it was until 2014 that it acquired its national character, which issued drought maps on time scale different from the monthly, always based on the methodology by the United States Drought Monitor (USDM) and the NADM. As of February 2014, the issuance of the MSM is biweekly.
These indices are displayed in layers through a Geographic Information System (GIS), and the regions affected by drought are determined by consensus, according to the intensity scale that is common in the three countries (United States, Mexico and Canada) ranging from abnormally dry (D0), moderate drought (D1), severe drought (D2), extreme drought (D3) to exceptional drought (D4).
In this context, based on the MSM historical records of for each drought category, and on municipal data, a methodology was developed to prepare a municipal level national drought hazard map, which is described below in summary form. It is described extensively in IMTA (2017), and Ortega-Gaucin, De la Cruz, and Castellano (2018).
Municipal scale drought hazard was determined by calculating the probability of drought occurrence (relative frequency) using MSM records, which involved carrying out the following activities:
Obtaining historical drought records by municipality according to their degree of severity (D0 to D4) from the official MSM website, and preparation of an Excel database. The historical drought records data was obtained by accessing the corresponding MSM website link (Conagua - SMN, 2018).
Severity degree (D0 to D4) time series analysis, for the period from January 31, 2003 to March 31, 2017. The total number of months was 171, however, in two of these months (August 31, 2003 and February 29, 2004) there was no data records, therefore, the total number of months analyzed was 169.
Obtaining the absolute frequencies corresponding to each type of drought severity (D0 to D4) by municipality, taking into account municipalities with at least 40% of their territory affected by some degree of drought. For the period from February 28, 2014 to March 31, 2017, the records were found biweekly. However, since the analysis was performed on a monthly basis, the records of the first fortnight of this period were deleted. To obtain the absolute frequencies, a count was made of how many D0 to D4 there were in the 169 months registered. After that the database was ordered by municipalities.
Probability of drought computation by means of the envelope (D0 to D4), and its expression in percentage. The probability of occurrence of a given event, that is, the level of certainty that said event will occur, is defined as the ratio between the number of times said event occurred and the number of repetitions of the experiment. This ratio is called relative frequency.
Equation (3) was used to calculate the relative frequency:
where:
P |
Probability of occurrence |
A |
Number of months with drought |
N |
Total number of records in the time period |
The probability values oscillate in a closed range of [0, 1]. In order to classify these probabilities in percentiles with categories of equal size, the values were adjusted to a normal distribution and the result was multiplied by 100. Given that there are five categories of drought probability classification, each percentile range obeys 20% (Figure 2).

The state with the highest number of affected municipalities is Michoacán, where 70% of them have a very high drought, in addition to the northern states such as Baja California, Sonora, Coahuila and the southeastern states of Campeche, Quintana Roo and Yucatan. The state with the highest number of municipalities with high drought is Veracruz with 71 municipalities.
The state with the highest number of municipalities in the middle, low and very low range is Oaxaca, with 116 municipalities in the middle level, 108 municipalities in the low level and 323 municipalities in the very low level, that is to say 96% of the total number of municipalities in that state present some degree of drought.
Table 2 presents a breakdown of drought ranges, with number of municipalities, population and area in each range, highlighting that 17.9% of the municipalities (where 22.3% of the population live) is located in very high probability of drought areas.
Table 2 Drought index by ranges (Id).
| Range | Number of municipalities | Percentage of municipalities (%) | Population | Percentage of country’s population (%) | Territorial extent (km2) | Percentage of country’s territorial extent (%) |
|---|---|---|---|---|---|---|
| 0.81-0.99 (Very high) | 440 | 17.9 | 25 052 980 | 22.3 | 767 127.31 | 39.2 |
| 0.61-0.80 (High) | 472 | 19.2 | 36 412 593 | 32.4 | 540 977.69 | 27.7 |
| 0.41-0.60 (Medium) | 587 | 23.9 | 27 382 986 | 24.4 | 325 414.05 | 16.6 |
| 0.20-0.40 (Low) | 460 | 18.7 | 15 959 801 | 14.2 | 197 958.23 | 10.1 |
| 0.01-0.19 (Very low) | 497 | 20.2 | 7 528 178 | 6.7 | 124 761.92 | 6.4 |
| Total | 2 456 | 100.0 | 112 336 538 | 100.0 | 1 956 239.19 | 100.0 |
Groundwater depletion index (Igwd)
Groundwater is still considered by many as an invisible and inexhaustible resource. Actually, most aquifer systems have been subject to an intensive use never seen before, causing local problems (land subsidence) and regional problems (interception of regional flows, which affect interconnected aquifer units, and reduction in their natural discharge outlets), with irreversible damage (Custodio, 2000).
In Mexico, it is necessary to understand the dynamics of groundwater, which is much slower than that of surface water. The phreatic and piezometric level aquifer monitoring is limited in space (systematic variation in the measurement points, absence of a spatial arrangement, of the measurement networks) and in time (variation at different times of the year, lack of long-term continuity). Since the 1970s, efforts have been made to establish monitoring networks in free, semi-confined and confined aquifers in the country, but data gaps in monitoring persist, which is why remote sensing is a technology that little by little has been integrated into the hydro-sciences, offering the advantage of monitoring also difficult access areas, with a wealth of systematic and continuous information.
The “Gravity Recovery and Climate Experiment” (GRACE) project allows groundwater volumes to be estimated from temporal variations in the gravity field. GRACE is an American-German project, carried out by the National Aeronautics and Space Administration (NASA) and the German Aerospace Center (DLR) by Deutsches Zentrum für Luft - und Raumfahrt), consisting of two twin satellites that orbit 450 km above sea level, 220 km apart. The spatial resolution of the information is approximately 200 000 km2, applicable to hydrological basins (Wahr, Zlotnicki, & Velicogna, 2004; Scalon, Longuevergne, & Long, 2012). GRACE generates temporal information of the gravitational field with a periodicity of 10 days to a month. GRACE L2 series information is available at: http://www2.csr.utexas.edu/grace/RL06.html.
The geoid or land mass density (Wahr, Zlotnick, & Velicogna, 1998) is represented in the form of finite series of spherical harmonics, with which the total variation of water storage (VTAA) is calculated, expressed in units of water equivalent. The VTAA integrates changes in the storage of: ice-snow (CAHN), surface water (CAAS), soil water (CAS) and subsoil (CASUB), the latter being estimated with Equation (4):
The novelty of GRACE is the recording of the temporal variation of the gravitational field, translated in VTAA globally.
The objective of using the GRACE data and reducing them to obtain CASUB lies in obtaining the average depletion-recovery in the Mexican Republic, information that is used as groundwater index in the calculation of municipal water security indices.
Applying the standard methodology of the GRACE data, from the L2 series, monthly VTAA records were obtained for the period of time 2002 to 2015 and the CASUB value was obtained by applying Equation 4. The information from the CAHN, CAAS and CAS components was processed from 1° terrestrial resolution databases, on a monthly period, from 2002 to 2015.
It is noteworthy that the mass changes where the greatest variation is observed correspond to the seasons winter-summer and spring-autumn cycles, that is, there is a seasonal transition phenomenon. In the winter season are the greatest depletions and in summer the recoveries, which are associated with the effect of precipitation. This phenomenon is typical in arid and semi-arid areas. In the spring-autumn season there is an intermediate process where the total value of water storage is recovered or reduced.
In general, it is identified that in the north of the country a total value of water storage between stable and depletion is maintained. In the central region, represented mostly by the Lerma-Santiago Pacifico, Golfo Norte, Aguas del Valle de México, Balsas, Pacifico Sur, Golfo Centro and Frontera Sur basin councils, the greatest water mass variations occur. In the Yucatan Peninsula it tends to be stable, although the latter must be taken with reserve since the local processes are the dominant ones, and are hidden when analyzed with the spherical harmonics of minor orders and degrees.
The average CASUB value for July from the years 2002 to 2015 shows that infiltration and recharge extend to almost the entire coastal area of the Gulf of Mexico, including the Yucatan Peninsula and continue towards the Valley of Mexico basin and the head of the Panuco River basin. Recharge and infiltration are observed on the coasts of the Pacific Ocean during the month of July, mainly for the middle zone of the Baja California Peninsula, towards the Vizcaino desert area.
In August, the conditions existing in July increase, but they extend to the areas of the Balsas River basin, the North Pacific coastal basin between the cities of Hermosillo and Mazatlán, the head of the Lerma River basin and the eastern portion of the Central Basins.
October is similar to September, in the distribution, however, it is more intense towards the central portion of Mexico, mainly towards the headwaters of Valle de México, Rio Lerma, Río Panuco and Balsas basins; coasts of Veracruz (Xalapa) as well as in the portion of the Yucatan Peninsula and the Oaxaca coasts.
By the end of the rainy season, in November, the groundwater storage effects are manifested in the same way, with a decrease or progressive attenuation of said areas for December.
Groundwater storage was calculated month by month, for the time period 2002-2015, and the monthly and annual average values were subsequently estimated. The result is the average groundwater storage, over a period of 13 years, where groundwater storage is considered as recovery if positive, and depletion if negative. To obtain the storage values by municipality, an interpolation was performed with the results of Figure 3 and the municipal division. Normalization of the resulting values was applied after that.
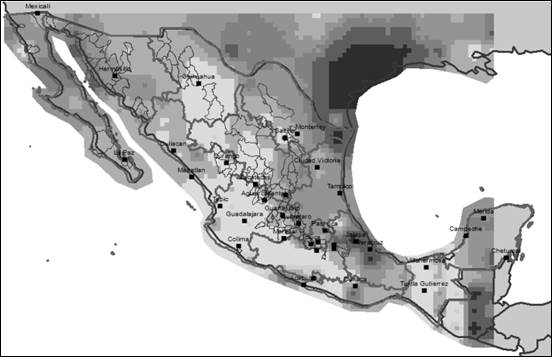
Figure 3 Average value of CASUB (the change of water storage in the subsoil) in the Mexican Republic, for time period 2002-2015.
The normalization method applied to the depletion/recovery values, on 0 to 1 scale, was Min-Max (OECD, 2008). The classification of data to determine the best categorization of the values, according to the breaks or gaps that naturally exist between them, was carried out by maximizing the variance between classes and minimizing the variance within classes (Jenks, 1967), using the QGIS software, see graphic results on the depletion map in Figure 4.

The State of Jalisco has the largest number of municipalities with very high groundwater depletion (85), representing 68% of the total of its municipalities. In a high and medium range of depletion is the state of Oaxaca with 115 municipalities in each case, although it also has 200 municipalities in acceptable conditions. The state of Veracruz has 102 of municipalities with no depletion (48%).
At national level, there are 519 municipalities with very high depletion (21%), with a population of 22 520 521 inhabitants and an area of 369 377.33 km2. 431 municipalities, where 26 504 321 people live in an area of 356 627.33 km2 have high groundwater depletion. The municipalities in medium range of depletion are 397. Finally, 1 109 municipalities (45.15% of the total of municipalities), where 39 300 516 people live, have very low depletion (Table 3).
Table 3 Groundwater depletion index by ranges (Igwd).
| Range | Number of municipalities | Percentage of municipalities (%) | Population | Percentage of country’s population (%) | Territorial extent (km2) | Percentage of country’s territorial extent (%) |
|---|---|---|---|---|---|---|
| 0.80-0.99 (Very high) | 519 | 21.1 | 22 520 521 | 20.0 | 369 377.33 | 19 |
| 0.60-0.79 (High) | 431 | 17.5 | 26 504 321 | 23.6 | 356 627.33 | 18 |
| 0.41-0.59 (Medium) | 397 | 16.2 | 24 011 180 | 21.4 | 402 113.93 | 21 |
| 0.21-0.40 (Low) | 717 | 29.2 | 27 987 330 | 24.9 | 608 944.16 | 31 |
| 0.00-0.20 (Very low) | 392 | 16.0 | 11 313 186 | 10.1 | 219 176.45 | 11 |
| Total | 2 456 | 100.0 | 112 336 538 | 100.0 | 1 956 239.19 | 100 |
Flood and extreme meteorological event index (Ifeme)
The National Water Information System (SINA), belonging to CONAGUA, publishes information, at municipal level, on declarations of emergency due to hydro-meteorological phenomena, issued from 2000 to 2016. In Mexico, there are procedures for issuing declarations for these phenomena, in which the National Center for Disaster Prevention (CENAPRED) participates. The extracted information contains data on cyclones, rain, floods, low temperatures, snow and hail, and tornadoes (Conagua-Sina, 2016).
The total number of emergency declarations by municipality was taken, from the information for that period, which includes cyclones, heavy rains, floods, low temperatures, strong winds, snow-frost and tornadoes. This number was divided among the days of a year to obtain an annual value of declarations by municipality. This information was normalized by using a normal distribution function (Equation 5), with mean μ and variance σ2 obtained from the annual declaratory value series per municipality.
The classification of data to determine the best categorization of the values, according to the breaks or gaps that naturally exist between the data, was achieved by maximizing the variance between classes and minimizing the variance within the classes (Jenks, 1967), using the QGIS software.
Figure 5 shows the resulting hydro-meteorological phenomena hazard map. The state with the highest recurrence (very high level) of extreme meteorological phenomena is Veracruz, with 70% of its municipalities (149) in that range. With a high, medium, low and very low level is the state of Oaxaca, with 96% of its municipalities ravaged by some extreme weather.

The affected population in the very high range is 22 676 963.00 people, located in an area of 529 637.77 km2, of 330 affected municipalities. In the high range are 359 municipalities, with 14 637 033 inhabitants, located in 429 908.29 km2. The low and very low ranges, with a minimum frequency of these events, includes 1 426 municipalities with 64 642 429 inhabitants (Table 4).
Table 4 Flood and extreme weather events hazard index Ifeme ranges per number of municipalities.
| Range | Number of municipalities | Percentage of municipalities (%) | Population | Percentage of country’s population (%) | Territorial extent (km2) | Percentage of country’s territorial extent (%) |
|---|---|---|---|---|---|---|
| 0.83-0.99 (Very high) | 330 | 13.4 | 22 676 963 | 20.2 | 529 637.77 | 27.1 |
| 0.60-0.82 (High) | 359 | 14.6 | 14 637 033 | 13.0 | 429 908.29 | 22.0 |
| 0.44-0.59 (Medium) | 341 | 13.9 | 10 380 113 | 9.2 | 277 972.60 | 14.2 |
| 0.28-0.43 (Low) | 454 | 18.5 | 21 381 351 | 19.0 | 381 352.91 | 19.5 |
| 0.15-0.27 (Very low) | 972 | 39.6 | 43 261 078 | 38.5 | 337 367.63 | 17.2 |
| Total | 2 456 | 100.0 | 112 336 538 | 100.0 | 1 956 239.19 | 100.0 |
Hazard index (Ih)
In order to integrate these indices into one index, they were normalized, on 0 to 1 scale, and the hazard index (Ih) was calculated by Equation 6. The hazard index map resulting from the integration of these four indices is presented in Figure 6.

Social Vulnerability Index (Isv)
The National Center for Disaster Prevention (abbreviated as CENAPRED in Spanish) defines social vulnerability as “The group of social and economic characteristics of the population that limit a society's developmental capacity; as well as its prevention and response capacity in the face of a phenomenon and the population's local perception of risk” (Cenapred-AR, 2014).
For the calculation of the Social Vulnerability Index, indicators were chosen that identify the main characteristics of the population, their organizational capacity and essential elements for emergency care. From the information available at the Mexican National Institute of Statistics, Geography and Informatics (INEGI), obtained from the 2010 national census and based on the methodology proposed by CENAPRED, the following indicators were calculated:
Average Education Level (AEL).
Number of Physicians per 1 000 inhabitants (NP).
Child Mortality Rate (CMR).
Population Without Health Care Coverage (PWHC).
Illiteracy (I).
Homes Without Drinking Water Service (HWDWS).
Homes Without Drainage Service (HWD).
Homes Without Electricity (HWE).
Homes with Earthen Floors (HWEF).
Economically Active Population (EAP).
Economically Dependent population Ratio (EDR).
Open Unemployment Rate (OUR).
Indigenous Language Population (ILP).
After normalizing the data, the social vulnerability index Isv for each municipality was calculated by (Equation 7):
where:
Isv |
Municipal vulnerability index |
vi |
Value of each of the social vulnerability indicators: AEL, NP, CMR, PWHC, I, HWDWS, HWD, HWE, HWEF, EAP, EDR, OUR, ILP |
n |
number of indicators |
The results obtained by Equation (7) were classified by municipality to generate a national map of the Social Vulnerability Index.
Risk Index and Water Security Index
Figure 7 presents the methodology to obtain the Risk Index (IR) and Water Security Index (Iws) maps. It is necessary to obtain first the Hazard (Ih) and Social Vulnerability (Ivs) Index maps.
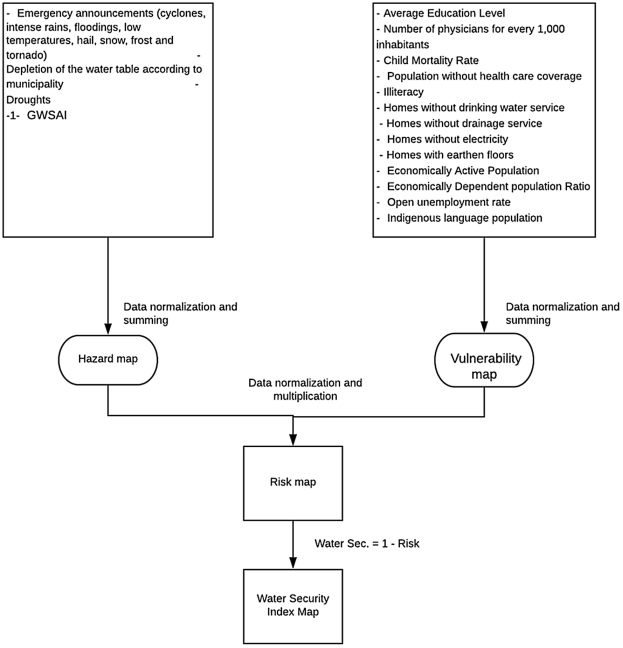
Figure 7 Flowchart of the proposed probability methodology for water security index map determination.
Risk is defined as contingency or proximity to damage, and can also be understood as the possibility of having significant losses or adverse results. An alternative definition may be the probability of a certain event (called hazard) to occur, taking into account the characteristics and circumstances of a city that make it susceptible to the effects it would suffer in terms of human health, environment and economic activities (vulnerability).
An identical level of hazard affects the different strata of the country's population in different ways, especially municipalities, thus, in order, to define the risk index for each municipality, the methodology proposed by Liu, Tan, Fang, and Lok (2012) was applied, in turn based on that of the Federal Emergency Management Agency (FEMA) of the United States of America. This methodology integrates three parameters: hazard (Ih), vulnerability (Isv) and impact (Iim), that is, the number of people who would be affected by the presence of a hazardous event, according to Equation (8):
To categorize each hazard and vulnerability map, the QGIS software was used, which incorporates the Jenks algorithm that tries to find natural groups of data through an iterative process, to create classes that minimize variability within the group and maximize variability between groups, in an attempt to create more homogeneous classes (Jenks, 1967).
Water security is closely related to the concept of risk. Risk measures the damage that biophysical and social processes can cause to the population and ecosystems. Water security shows the capacity of a society to satisfy its basic water needs, the conservation and sustainable use of aquatic and terrestrial ecosystems; as well as the capacity to produce food without threatening the quality and quantity of the available water resources, the mechanisms and social regulations to reduce and manage conflicts or disputes over water.
To establish the water security index, it is necessary to take into account that the risk index is the complement to one of the water security index (Equation (9)):
where:
Results
Municipal level hazard index (Ih)
The index for all municipalities of the country was generated from the obtained hazard indicators. The results were grouped using the general natural breaks method and are presented in Figure 6.
The state with the largest number of municipalities at a very high level of danger is Chihuahua with 36 municipalities, and at a high level is the state of Veracruz with 73 municipalities. In the state of Oaxaca there are 101 municipalities at a medium level, 201 at a low level and 188 at a very low level.
At a national level, 205 municipalities have very high hazard level, corresponding to a population of 9 426 917 inhabitants in an area of 408 686.10 km2. At high level are 482 municipalities with a population of 20 609 368 inhabitants in an area of 592 809.62 km2. The medium hazard level is made up of 644 municipalities that represent 26.2% of the total of municipalities and more than 23.2% of the total population, in an area of 592 809.62 km2. In the low hazard level is 28% of the municipalities (688), which do not present major problems, with a population of 38%. Finally, the very low level is made up of 437 municipalities (Table 5).
Table 5 Municipal hazard index Ih breakdown.
| Range | Number of municipalities | Percentage of municipalities (%) | Population | Percentage of country’s population (%) | Territorial extent (km2) | Percentage of country’s territorial extent (%) |
|---|---|---|---|---|---|---|
| 0.67-0.91 (Very high) | 205 | 8.3 | 9 426 917 | 8.4 | 408 686.10 | 20.9 |
| 0.57-0.66 (High) | 482 | 19.6 | 20 609 368 | 18.3 | 592 809.62 | 30.3 |
| 0.47-0.56 (Medium) | 644 | 26.2 | 26 138 848 | 23.3 | 489 255.19 | 25.0 |
| 0.35-0.46 (Low) | 688 | 28.0 | 42 582 808 | 37.9 | 371 680.30 | 19.0 |
| 0.16-0.34 (Very low) | 437 | 17.8 | 13 578 597 | 12.1 | 93 807.99 | 4.8 |
| Total | 2 456 | 100.0 | 112 336 538 | 100.0 | 1 956 239.19 | 100.0 |
Municipal level social vulnerability index (Isv)
Figure 8 graphically shows the results for the social vulnerability index for each of the municipalities of Mexico. The data was grouped using the natural breaks method (Jenks, 1967).

The state of Oaxaca presents very high vulnerability in 131 municipalities, high in 209 municipalities and medium in 72 municipalities, that is, 81% of the total municipalities of the state of Oaxaca are in a medium to very high vulnerability.
At the very high vulnerability range are 220 municipalities (Table 6), with 2 790 219 inhabitants, in an area of 106 979.01 km2. At high vulnerability are 483 municipalities with 7 389 613 inhabitants, in an area of 221 442.24 km2; and at the medium level of vulnerability are 585 municipalities with a population of 14 543 384 inhabitants.
Table 6 Social vulnerability Isv in the Mexican Republic.
| Range | Number of municipalities | Percentage of municipalities (%) | Population | Percentage of country’s population (%) | Territorial extent (km2) | Percentage of country’s territorial extent (%) |
|---|---|---|---|---|---|---|
| 0.67-0.90 (Very high) | 220 | 8.2 | 2 722 595 | 2.4 | 101 432.09 | 5.2 |
| 0.57-0.66 (High) | 483 | 18.0 | 7 210 518 | 6.4 | 209 960.34 | 10.7 |
| 0.49-0.56 (Medium) | 585 | 21.9 | 14 190 910 | 12.6 | 377 004.06 | 19.3 |
| 0.42-0.48 (Low) | 694 | 25.9 | 31 856 037 | 28.4 | 610 561.71 | 31.2 |
| 0.00-0.41 (Very low) | 474 | 17.7 | 53 633 884 | 47.7 | 555 848.91 | 28.4 |
| Total | 2 676 | 100.0 | 112 336 538 | 100.0 | 1 956 239.19 | 100.0 |
At low level of vulnerability there are 694 municipalities, which have an adaptability to a disturbing agent. In this range a population of 32 647 278 inhabitants is calculated in an area of 643 950.92 km2. The very low level is made up of 474 municipalities, corresponding to 48.9% of the total population (Figure 8).
Risk index (IR)
The values obtained for the risk index for the country's municipalities are presented in Figure 9. The state with the highest number of municipalities with a very high risk index is Guerrero with 23. At a national level, 75 municipalities, with a total population of 1 914 785 inhabitants and an area of 121 860.86 km2, have very high risk. At a high level of risk are 255 municipalities with a population of 6 408 858 inhabitants. At the low and very low level are 1 625 municipalities, with 79% of the population, which do not present major problems with this index (Table 7).

Table 7 Risk level IR per ranges.
| Range | Number of municipalities | Percentage of municipalities (%) | Population | Percentage of country’s population (%) | Territorial extent (km2) | Percentage of country’s territorial extent (%) |
|---|---|---|---|---|---|---|
| 0.41-0.64 (Very high) | 75 | 3.1 | 1 914 785 | 1.7 | 121 860.86 | 6.2 |
| 0.32-0.40 (High) | 255 | 10.4 | 6 408 858 | 5.7 | 214 231.76 | 11.0 |
| 0.25-0.31 (Medium) | 501 | 20.4 | 15 149 331 | 13.5 | 474 045.76 | 24.2 |
| 0.18-0.24 (Low) | 888 | 36.2 | 33 873 496 | 30.2 | 760 732.04 | 38.9 |
| 0.06-0.17 (Very low) | 737 | 30.0 | 54 990 068 | 49.0 | 385 368.78 | 19.7 |
| Total | 2 456 | 100.0 | 112 336 538 | 100.0 | 1 956 239.19 | 100.0 |
Municipal water security index Iws
Figure 10 depicts the graphic water security results per municipality. Its values vary between 0.35 and 0.94, grouped by the method of natural breaks (Table 8).

Table 8 Municipal water security index Iws breakdown.
| Range | Number of municipalities | Percentage of municipalities (%) | Population | Percentage of country’s population (%) | Territorial extent (km2) | Percentage of country’s territorial extent (%) |
|---|---|---|---|---|---|---|
| 0.35-0.66 (Very low) | 240 | 9.8 | 6 762 542 | 6.0 | 294 943.51 | 15.1 |
| 0.67-0.74 (Low) | 488 | 19.9 | 14 113 314 | 12.6 | 335 495.10 | 17.2 |
| 0.75-0.81 (Medium) | 847 | 34.5 | 29 396 290 | 26.2 | 824 099.84 | 42.1 |
| 0.82-0.88 (High) | 723 | 29.4 | 62 020 698 | 55.2 | 469 056.75 | 24.0 |
| 0.89-0.94 (Very high) | 158 | 6.4 | 43 694 | 0.0 | 32 644.00 | 1.7 |
| Total | 2 456 | 100.0 | 112 336 538 | 100.0 | 1 956 239.19 | 100.0 |
The state with the greatest water security problems by number of municipalities is Oaxaca, where there are 63 municipalities with a very low level of security, 119 with a low level, 163 with a medium level, 177 with a high level, and 48 municipalities with a very high level.
By territorial extension of the municipalities, the state of Chihuahua is the one that heads the list of greater water insecurity, followed by Durango and Guerrero. On the other hand, the states that are most secure according to the proposed methodology are Coahuila (5 562.31 km2), Querétaro (3 439.49 km2) and Veracruz (3 055.46 km2).
At the very low level of security are 240 municipalities (Table 8) in the north and southeast of the country, with about 6 373 million inhabitants; in the low level 488 municipalities with 13 301 million of inhabitants. At a high level of security there are 723 municipalities that comprise 55% of the country's population, and at a very high level 158 with only 41 179 inhabitants.
Discussion
Water security is transversal to all aspects of economic, social, environmental y political development; people assign meaning to the concept of water security depending on the scale and the particular context in which it is applied; water security can never be fully achieved because physical and economic conditions are constantly changing, which requires continuous adaptation. There is no single solution to increase water security. The solutions must also be adapted to local conditions in each country, basin, city, project or management area. Water security and Integrated Water Resources Management (IWRM) are symbiotic. Adaptive management, immersed in IWRM processes, helps to improve water security from the national to the local level. Water security must be seen as the goal of IWRM; what cannot be measured cannot be managed and therefore the measurement of water security is essential to increase it.
The task of achieving greater water security involves responding not only to the risks that are currently observed, but very importantly in giving adequate responses to the new challenges that the sector presents. The main challenges to overcome in achieving water security are manifested in water scarcity, the contamination of water bodies, the adverse effects of extreme hydrometeorological phenomena (floods and droughts), the growing conflicts over water and environmental deterioration of basins and aquifers. The main factors that induce or increase these risks for water security are demographic processes, the growing demand for food, both due to population growth and changes in diet, the demand for water for energy production, the effects of climate change and the poor water management.
The main limitation for construction of an indicator tied to reality in Mexico, able also to clearly reflect the situation in the country, is the lack of information. This item includes the lack of measurement, monitoring and data processing, asymmetric information to different levels of aggregation (state and municipal) and discretionary management of existing information. On the other hand, a complication when it comes to integrating information is determining the degree of benefit it brings to water security, due to the complexity of the problem.
Regarding the components that were analyzed to generate the water security indicator, it can be concluded that they are implicit within the indicators considered, and that they affect each other transversally. It is recommended to incorporate in the future information related to the budgets authorized and effectively spent by the municipalities, related to flood control, droughts, water treatment, improvement of drinking water services, etc., actions that have a direct impact on strengthening the country's water security.
Conclusions
The concept of water security is varied according to the context and the scale in which it is managed. Full water security is not expected to be achieved due to constant changes in all aspects of society, but it is important to carry out actions that help reduce risk.
The hydrological, meteorological and social contrasts to which the country is exposed make spatial sectorization necessary to analyze water security. It has been considered that a municipal sectorization allows adequate precision for the variables that have been taken into account.
This work proposes a methodology for the generation of security indices at the municipal level, under a probabilistic approach, made up of data from the years 2010 to 2015, mainly from Conagua for hazard and INEGI for vulnerability. The hazard index is made up of 4 variables: floods, drought, lack of access to basic water services, and groundwater depletion. In terms of vulnerability, 13 indicators are taken into account. Subsequently, the risk is obtained as the product of vulnerability and risk. Finally, by subtracting the previous result from one, the municipal water security index is generated.
Two hundred forty (9.77%) of the 2 456 municipalities in Mexico show a very risky water security index and 488 risky (19.87%), which indicates that almost 30% of the municipalities in Mexico have a high possibility of being subject to natural and extreme hydrometeorological events that can cause significant losses, both material and of human lives.
By territorial extension of the municipalities, according to the calculated water security index, the state of Chihuahua is the one that heads the list of greatest water insecurity, followed by Durango and Guerrero. On the other hand, the states that are most secure according to the proposed methodology are Coahuila, Querétaro and Veracruz.
There are parameters that allow calculating water security indices globally (Gain, Giupponi, & Wada, 2016). The index proposed in this work, however, takes into account indicators that are already measured in the country by government institutions, which facilitates its application. Nevertheless, it is not ruled out that a comparison between these indices could contribute considerably to the subject.
Referencias
Ait-Kadi, M., & Linckaen, A. W. (2016). Aumentar la seguridad hídrica. un imperativo para el desarrollo. Recuperado de www.gwptoolbox.org. [ Links ]
AWDO, Asian Water Development Outlook. (2013). Asian water development outlook. Measuring water security in Asia and the Pacific. Manila, Philippines: Asian Development Bank. [ Links ]
Cenapred-AR. (2014). Evaluación de la vulnerabilidad física y social. Guía básica para la elaboración del Atlas Nacional de Riesgos. Recuperado de http://www.cenapred.gob.mx/es/Publicaciones/archivos/57.pdf [ Links ]
Conagua-SMN, Comisión Nacional del Agua, Sistema Meteorológico Nacional. (2018). Servicio Meteorológico Nacional SMN. Obtenido del Monitor de Sequía de México (SMN). Recuperado de https://smn.conagua.gob.mx/es/climatologia/monitor-de-sequia/monitor-de-sequia-en-mexico [ Links ]
Conagua-Sina, Comisión Nacional del Agua, Sistema Nacional de Información del Agua. (2016). Declaratorias por fenómenos hidrometeorológicos (nacional). Recuperado de http://sina.conagua.gob.mx/sina/tema.php?tema=declaratoriasFenomenos&ver=mapa [ Links ]
Custodio, E. (2000). The complex concept of overexploited aquifer. Madrid, España: Fundación Marcelino Botín. [ Links ]
Gain, A. K., Giupponi, C., & Wada, Y. (2016). Measuring global water security towards sustainable development. Environmental Research Letters, 11(12). DOI: 10.1088/1748-9326/11/12/124015 [ Links ]
GWP, Global Water Partnership. (2012). La seguridad hídrica para el crecimiento y la sostenibilidad. Río + 20. Recuperado de www.gwptoolbox.org [ Links ]
GWP, Global Water Partnership. (2016). Aumentar la seguridad hídrica, un impertivo para el desarrollo. Global Water Partnership, Recuperado de https://www.gwp.org/globalassets/global/toolbox/publications/perspective-papers/perspectives-paper_water-security_spanish.pdf [ Links ]
IMTA, Instituto Mexicano de Tecnología del Agua. (2017). Índices de seguridad hídrica (ISH), clave HC1711.1. Jiutepec, México: Secretaría de Medio Ambiente y Recursos Naturales, Instituto Mexicanano de Tecnología del Agua. [ Links ]
IMTA, Instituto Mexicano de Tecnología del Agua. (2018). Índices de Seguridad Hídrica (ISH). Jiutepec, México: Instituto Mexicano de Tecnología del Agua. [ Links ]
INEGI, Instituto Nacional de Estadística y Geografía. (2019). Medición de la pobreza. Recuperado de https://www.coneval.org.mx/Medicion/Paginas/PobrezaInicio.aspx [ Links ]
Jenks, G. F. (1967). The data model concept in statistical mapping. International Yearbook of Cartography, 7, 186-190. [ Links ]
Liu, C., Tan, C. K., Fang, Y. S., & Lok, T. S. (2012). The security risk assessement methodology. Procedia Engineering, 43, 600-609. [ Links ]
Martínez-Austria, P. F. (2013). Los retos de la seguridad hídrica. Tecnología y ciencias del agua, 4(5), 165-180. [ Links ]
Mason, N., & Roger, C. (2012). Water security: From abstract concept to meaningful metrics. An initial overview of options. London, UK: Overseas Development Institute. [ Links ]
Norman, E., Bakker, K., Cook, C., Dunn, G., & Allen, D. (2010). La sécurité hydrique: guide d´introduction, Élaboration d´un cadre stratégique en matiere de sécurité hydrique au Canada comme outil d´amélioration de la gouvernance de l´eau des bassans versants (2008-2012). Recuperado de http://watergovernance.sites.olt.ubc.ca/files/2010/05/Water-Security-Primer-FRENCH.pdf [ Links ]
OECD, Organization for Economic Cooperation and Development. (2008). Handbook on construction composite indicators-methology and user guide. Ispra, Italy: Organization for Economic Cooperation and Development. [ Links ]
Oliver-Smith, A., & Hoffman, S. M. (2002). Introduction: Why antropologists should study disasters in catastrophe and culture: The anthropology of disaster. Recuperado de http://faculty.washington.edu/stevehar/O-S&H.pdf [ Links ]
ONU, Organización de las Naciones Unidas-Agua. (2013). Water security and the global water agenda. A un-water analytical brief. Recuperado de https://collections.unu.edu/eserv/UNU:2651/Water-Security-and-the-Global-Water-Agenda.pdf [ Links ]
ONU, Organización de las Naciones Unidas. (2017). Objetivos del Desarrollo Sustentable. Recuperado de http://www.un.org/sustainabledevelopment/es/water-and-sanitation/ [ Links ]
Ortega-Gaucin, D., De la Cruz, B. J., & Castellano, B. H. (2018). Peligro, vulnerabilidad y riesgo por sequía en el contexto del cambio climático en México. Recuperado de https://www.imta.gob.mx/biblioteca/libros_html/ccambio-climatico/agua-cambio-climatico.pdf [ Links ]
Scalon, B., Longuevergne, L., & Long, D. (2012). Ground referencing GRACE satellite estimates of groundwater storage changes in the California Central Valley, USA. Water Resources Research, 48(4), Recuperado de https://doi.org/10.1029/2011WR011312 [ Links ]
Wahr, J., Zlotnick, V., & Velicogna, I. (1998). Time variability of the Earth´s gravity field: Hidrological and oceanic effects and their possible detection using GRACE. Journal of Geophysical Research: Solid Earth, 103(B12), Recuperado de https://doi.org/10.1029/98JB02844. [ Links ]
Wahr, J., Swenson, S., Zlotnicki, V., & Velicogna, I. (2004). Time variable gravity from GRACE: First results. Geophysical Research Letters, 31, L11501. Recuperado de https://doi.org/10.1029/2004GL019779 [ Links ]
Received: April 26, 2019; Accepted: April 08, 2020
 Este es un artículo publicado en acceso abierto bajo una licencia
Creative Commons
Este es un artículo publicado en acceso abierto bajo una licencia
Creative Commons
