


Servicios Personalizados
Revista
Articulo
 texto en
  Inglés (pdf)
 Artículo en XML
 Referencias del artículo
 Enviar artículo por email
Indicadores
-
 Citado por SciELO
 -
 Accesos
Links relacionados
-
 Similares en
SciELO
Similares en
SciELO
Compartir

 Permalink
Revista mexicana de ciencias pecuarias
versión On-line ISSN 2448-6698versión impresa ISSN 2007-1124
Rev. mex. de cienc. pecuarias vol.7 no.1 Mérida ene./mar. 2016
Articles
Individual lactation curves in Siboney dairy cows of Cuba
a Universidad Autónoma de Baja California Sur, México. Carr. al Sur, km. 5.5, La Paz, B.C.S. CP 23080. México.
b Universidad de Illinois, USA.
c Centro de Investigación para el Mejoramiento Animal de la Ganadería Tropical, La Habana, Cuba.
d Universidad del Mar, Puerto Escondido, Oaxaca, México.
The objective was to study and to model the individual lactation curves in Siboney cows comparing four mathematical models. In total, 31,631 test day milk production records (TD) of 3,697 lactations (1 to 5) from 2,632 Siboney cows of Cuba (5/8 Holstein, 3/8 Cebu Cuban) monthly recorded between 1994 and 2003 were adjusted using the functions of Wood, Wilmink, Ali-Schaeffer and Legendre polynomials. The parameters were estimated using nonlinear regressions and the goodness of fit was measured by the adjusted coefficient of determination (R2 A). Values of R2 A > 0.75 in 23, 24, 28, and 36 % of the lactations for the models of Wood, Wilmink, Ali-Schaeffer and Legendre polynomials, respectively, were obtained. The models of Wood and Wilmink described four types of curves and the models of Ali-Schaeffer and the Legendre polynomials 17 and 20 for 32 possible theoretical groups. The correlations among the parameters of Ali-Schaeffer function were higher than that estimated for the Legendre polynomials. The proposed functions represented the different shapes among lactation curves and in particular the five parameters models detected higher diversity related to the rest of the function. This pointed that even if additional detected shapes can be considered as derivations of the two classical groups of typical or atypical curves, this practice could compromise the variability among lactation curves inside a herd, therefore further studies are needed.
Keywords: Cows; Lactation curves; Mathematical models
El objetivo fue estudiar y modelar las curvas de lactancia individuales en vacas Siboney, comparando cuatro modelos matemáticos. En total, 31,631 registros de producción de leche del día de control (PDC) de 3,697 lactancias (1 a 5) provenientes de 2,632 vacas Siboney de Cuba (5/8 Holstein 3/8 Cebú Cubano) registrados mensualmente entre 1994 y 2003 se ajustaron mediante las funciones de Wood, Wilmink, Ali-Schaeffer y Polinomios de Legendre. Los parámetros se estimaron usando regresiones no lineales y la bondad de ajuste se midió mediante el coeficiente de determinación ajustado (R2 A). Se obtuvieron valores de R2 A > 0.75 en 23, 24, 28 y 36 % de las lactancias para los modelos de Wood, Wilmink, Ali-Schaeffer y Polinomios de Legendre, respectivamente. Los modelos de Wood y Wilmink describieron cuatro tipos de curvas; y los modelos de Ali-Schaeffer y los Polinomios de Legendre 17 y 20, de los 32 grupos teóricos posibles. Las correlaciones entre los parámetros para la función de Ali-Schaeffer fueron superiores a las estimadas para los polinomios de Legendre. Las funciones propuestas representaron las diferentes formas entre curvas de lactancia y en especial, los modelos de cinco parámetros detectaron mayor diversidad que el resto de las funciones. Esto apunta que, aunque formas adicionales pueden considerarse como derivaciones de los dos grupos clásicos de curvas típicas o atípicas, esta práctica podría comprometer la variabilidad entre curvas de lactancia en un hato, por lo que serán necesarios más estudios.
Palabras clave: Vacas; Lactancia; Curvas; Modelos matemáticos
Introduction
A lactation curve is the result of an explanation of a biological process with a mathematical function1, and is useful in predicting total production from partial samples. Milk production is represented by the lactation curve trajectory, and is influenced by genetic and environmental factors2. Lactation curves help to understand milk production physiological behavior and can be used to research the genetic potential of a dairy cattle herd or breed3. By applying lactation curves, total milk production can be predicted with one or a number of measurements taken on control days in early lactations4. Milk production genetic potential and the shape and height of lactation curves are affected by factors such as the number of consecutive lactations, age at parturition, season of calving5, gestation stage6, and length of previous dry period2. The handling and feed systems used in different geographic zones, regions and countries can also have a significant effect on dairy cow milk production7,8,9.
Many mathematical models have been used to describe lactation and estimate expected milk production2. Some of these models focus on attaining the best fit for the mathematical equations and give less weight to lactation biology10, while others aim at improving understanding of biological processes11.
When control day production data are fitted using empirical regression equations, different lactation curve shapes can be identified. Some are slight modifications of the standard (typical) curve, for instance, due to the presence or absence of inflection points in the descending portion of a lactation curve. Others can differ notably from the standard curve, such as curves that decline continually and have no lactation peak12.
Most studies using lactation curves are focused on identifying the curve with the best fit among average curves. That with the best fit is then used to fit all the lactations in a data set. Applying these criteria to identify the best model often ignores statistical or biological problems that may occur when the fit is extended to individual lactations. This can result in inaccurate parameter estimation13.
In milk production genetic models, the primary concept is that animals can differ genetically, both in terms of total milk production and their lactation curve shape14. Variation in milk production curve shape occurs in different species5,15. Given this variation, it is vital to find the most appropriate mathematical function that best describes each production situation16.
The present study objective was to apply four mathematical models to analyze and model individual lactation curves in the Siboney genotype of Cuba.
Material and methods
Data analyzed in this study were from Siboney cattle (5/8 Holstein, 3/8 Cuban Zebu) from Pinar del Río province, Cuba. This region has two clearly defined seasons: a rainy season from May to October with 70 to 80 % (960 mm) of yearly rainfall; and a dry season from November to April (240 mm). Average annual temperature is 23.1 °C, relative daytime humidity is 60 to 70 % and relative nighttime humidity is 80 to 90 %17.
A total of 31,631 test day milk yield (TDMY) records were analyzed from 3,697 monthly controlled lactations (first to fifth) in 2,632 cows born between 1987 and 1999. Feed system was daily grazing for approximately 12 h daily. Star grass and Guinea grass were the principal feed, although the cows also grazed naturally occurring grasses in the rainy season. The cows were milked twice daily, and provided a 0.45 kg concentrate supplement beginning at the fourth liter of milk produced. The cows were corralled at night and fed king grass (Penisetum purpureum) and sugar cane (Saccharum officinarum).
Lactation curves were modeled using four functions applied previously in this population to model average curves:
Wood10: Yt = a.tb.ect
Wilmink18: Yt = a+be-kt +ct
Ali and Schaeffer19: Yt = a+b(t/330)+c(t/330)2+dlog(330/t)+k[log(330/t)]2
Fourth order, normalized Legendre orthogonal polynomials20: Yt ∝=0 xP 0+∝1 xP 1+∝2 xP 2+ ∝3 xP 3 + ∝4 xP 4
In all four models, Yt is TDMY in time t, corresponding to lactation days at the time of milk weighing. Parameters a, b, and c are associated with production level, and parameter k is linked to time at peak lactation and is usually assumed to be fixed18,21. In the Wilmink model, k= 0.10 was assumed22. Time functions (Pj) included in the models using Legendre polynomials were calculated with values published by Schaeffer23.
Lactation curve classification
In the Wood function, b>0 and c<0 corresponded to a standard (typical) curve. In contrast, if b<0 and c>0, the curve was a reverse standard curve with an initially decreasing phase followed by an increase. The b>0 and c>0 combination represents a continuously increasing curve, while b<0 and c<0 describes a continuously decreasing curve24.
The same four curve shapes can be described by the Wilmink function but with different parameter values: b<0 and c<0 is a typical curve; b>0 and c>0 is a reverse curve with a minimum point; b<0 and c>0 is a continuously increasing curve; and b>0 and c<0 corresponds to a continuously decreasing curve15.
The Ali-Schaeffer and Legendre polynomials functions describe 32 possible lactation curve shapes25.
Goodness of fit for all four models was calculated with R2 A and classified in four levels (1<0.24; 2=0.25-0.49; 3=0.50-0.74; 4>0.75). The resulting categories helped to observe model fit to the different individual lactation curves. Only individual curves with R2 A >0.75 were used. The lactation curves were grouped based on the combination of the values of their parameters, and the correlation between them calculated. All analyses were run with the NLIN procedure in the SAS package26.
Results
Average TDMY varied from 5.9 ± 3.3 to 3.7 ± 2.0 kg, with an overall mean of 4.9 ± 2.7 kg. Values for R2 A were >0.75 in 23 % of lactations using the Wood function, 24 % using the Wilmink function, 28 % with the Ali-Schaeffer function, and 36 % when using the Legendre polynomials function (Table 1). When R2 A curves >0.75 were selected, the three-parameter models identified four types of curves (Table 2). The Wood model identified more (61 %) standard curves than the Wilmink model (47 %).
Table 1 Absolute frequencies and relative percentages (in parentheses) of fits in different classes of fitted coefficients of determination (R2A).
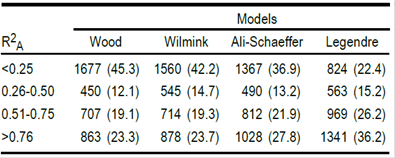
Table 2 Means and standard deviations of individual curve parameters classified according to the four shapes identified by the Wood and Wilmink models.
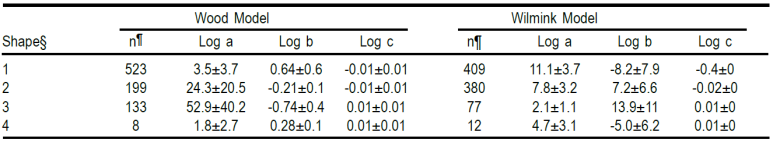
§ Lactation curve shapes: 1= typical; 2= continuously descending (atypical); 3= reverse standard; 4= continuously increasing.
¶ sample size.
In curves modeled with the Wood function for increasing b values, estimates during the first lactation increased (Figure 1a), whereas in atypical curves increases in b did not persist (Figure 1b). With the Wilmink function, in contrast, the typical curves had a convex shape that was accentuated by negative b values (Figure 1c), whereas in atypical curves positive b values accentuated the curve’s concave shape (Figure 1d). This highlights the difference in meaning of the b parameter between the two curve groups within the same model, and confirms the link between b values and the variation rate in the first portion of the curve.
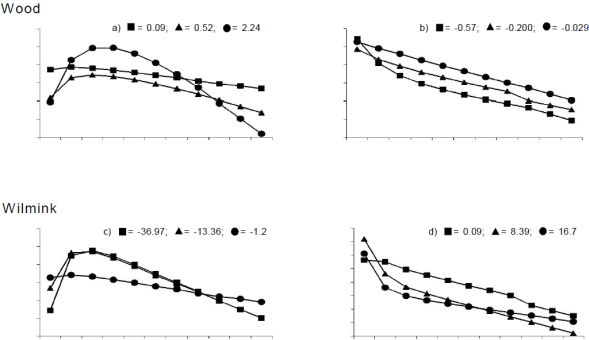
Figure 1 Typical (a and c) and atypical (b and d) lactation curve shapes identified by the Wood and Wilmink models; chosen for increasing b parameter values. DIM= days in milk; TDYM= test day yield milk.
Of the 32 theoretically possible groups, the Ali-Schaeffer model identified 17 curve types and the Legendre polynomials model 20 types. Nonetheless, each group was essentially the result of a specific deformation of the two basic shapes (typical and atypical). Variability occurred in the form of inflexion points within the two curve groups. The four curve groups with the highest frequencies were included in the analysis (Table 3).
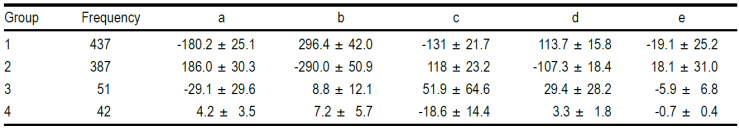
Table 3 Parameter distribution (mean ± standard deviation) of individual curves classified based on the four groups most frequently identified by the Ali-Schaeffer model.
Estimates for individual curves were generated for each of the four main Ali-Schaeffer model curve groups (Figure 2). In group 1, the increase in parameter b represented a rise in milk production at the beginning of lactation (Figure 2a), whereas in group 2 an increase in b marked the decline rate of the curve’s initial portion. Inflexion points occurred in both groups at 60 d, a clear consequence of the high flexibility of five-parameter models, which can identify different rates of decreased or increased milk production throughout lactation. However, the opposite sign in the parameters means that the sequence of changes in curvature is the opposite in the two groups. The patterns in groups 3 (Figure 2c) and 4 (Figure 2d) are examples of different consequences in response to an increase in the b parameter. In group 3, the curvature in the second portion increased while in group 4 it tended to decline linearly.
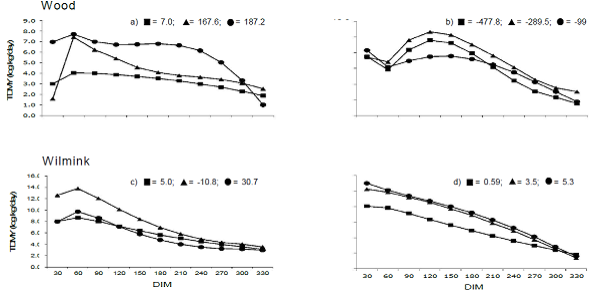
Figure 2 Examples of curve groups 1(a), 2 (b), 3 (c) and 4 (d) identified using the Ali-Schaeffer model, and selected for increasing b parameter values. DIM= days in milk; TDYM= Test day yield milk.
Among the four groups identified using Legendre polynomials (Table 4), a contrast in signs was present between groups 1 and 2, except for parameter α0, which was positive in both. Individual curves were generated for the four main groups for increasing values beginning from the term α1 (Figure 3). In group 1, increase in the α1 parameter caused a decrease in curve level and an increase in its curvature, while in group 2 an increase in α1 resulted in a lower slope and a more stable curve. The same behavior in response to increasing α1 values was also observed in groups 3 and 4.
Table 4 Parameter distribution (mean ± standard deviation) of individual curves classified based on the four main groups identified by Legendre orthogonal polynomials
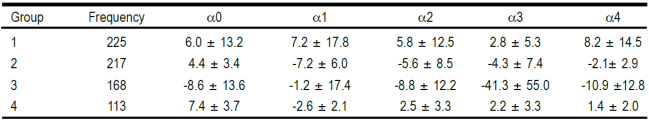
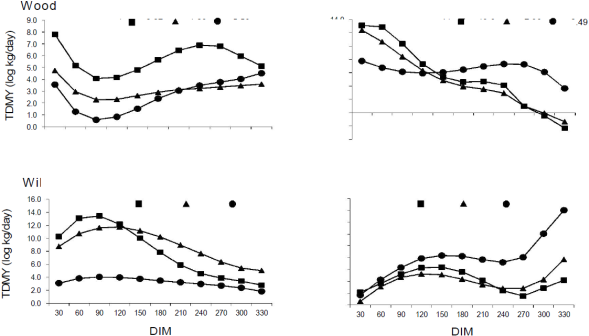
Figure 3 Examples of curve groups 1(a), 2 (b), 3 (c) and 4 (d) identified using Legendre orthogonal polynomials, and selected for increasing α1 parameter values. DIM= Days in milk; TDYM= Test day yield milk
Of the correlations calculated between estimated parameters for the first two groups classified as typical and atypical curves with the Wood and Wilmink models, most were significant (P <0.05). Of the correlations for the first two groups classified using the Ali-Schaeffer and Legendre polynomials models, significant (P<0.05) correlations were found in all but group 2 of the Legendre curves (Table 5).

Discussion
The TDMY values used in the present study were higher than those reported elsewhere for Siboney Cuba cattle27,28. In a study of 1,041 lactations in this genotype, R2 A values >0.75 were found in 21 % of the lactations modeled with the Wood function and 39 % of those modeled with the Ali-Schaeffer function27.
Goodness of fit increased with the number of parameters included in the function since this is related to model flexibility21,29. However, the parameters used in polynomial functions do not necessarily have a clear relationship to the basic characteristics of lactation curve shape; this is particularly the case for high order polynomial functions30. This makes biological interpretation difficult and leads to negative values at curve ends13.
The a parameter value estimated here with the Wood function for the typical lactation curve was lower than that reported for Holstein cattle31. This parameter’s scale is directly related to milk production level. The lower value in the present study was expected since, in terms of production traits, the selection program for the Siboney of Cuba genotype was designed to result in low input cattle for a tropical climate.
Compared to the Wood function, the outstanding element of the Wilmink function is the independence of the first and second portions of the curve. This is confirmed by the lower correlation value between b and c in both the typical and atypical curves. Macciotta et al22) suggested that interparameter dependence may be the reason the Wood model identifies more standard curves than the Wilmink function.
These two models are known to differ in their ability to describe lactation curve shapes32. According to the second derivative of the Wood function, the absolute value of b controls lactation pattern curvature magnitude, which is the deviation of a straight line24. In other words, when b is positive the curve is concave and when it is negative the curve is convex.
Parameters generated with the Wood and Wilmink functions need to be analyzed with caution. A number of authors claim that the occurrence of peak less lactation curves is mainly due to results produced from records with no data for the first days of lactation. For example, the notable presence of negative b parameter values refers to lactations with initial TDMY weighings at 30 d or more after parturition24. However, atypical curves are apparently not strictly linked to the day the first TDMY record is made33.
Peakless lactation curves have been described in dairy cattle31, sheep34, lambs25, and buffaloes5. This may be a pattern characteristic of certain livestock breeds, including Siboney of Cuba, which has reported average lactation curves exhibiting a slightly flattened shape28,35.
High correlation between parameters in the Ali-Schaeffer model means a change in curvature with increases in b, and is a known limitation of this model since it can obscure the estimation process, particularly in genetic analyses. Among other reasons, this has led to abandonment of the Ali-Schaeffer model in favor of Legendre polynomials23.
Apparently, an end effect is common in the main groups containing negative estimated TDMY values at the ends of the lactation trajectory37. As seen in group 2, this edge effect is characteristic of curves modeled with the Ali-Schaeffer and Legendre polynomials functions.
Using the Legendre polynomials model, the correlations between estimated parameters were lower than with the Ali-Schaeffer model. Schaeffer23 mentioned this behavior, and considered it difficult to identify the biological reasons explaining why the Ali-Schaeffer and Legendre polynomials functions can detect different types of curves. However, this behavior is particularly useful in random regression analyses searching for individual deviations in an average fixed curve.
Conclusions and implications
Using control day production data for Siboney dairy cows of Cuba, the four main mathematical functions used to predict milk production throughout lactation generated different lactation curve shapes, particularly in the five-parameter models. This shape diversity reflects curve diversity within the herd. Treating them as derivatives of the two classic typical and atypical curve groups could compromise variability among curves, since analyses based on average curves do not reflect the individuality of lactation behavior in a population. Use of three-parameter models as submodels in variance component estimations using control day production data should therefore be done with caution.
Literatura citada
1. Vinay-Vadillo JC, Villagómez-Cortés JA, Acosta-Rodríguez MR, Rocher C. Shapes of lactation curves of F1 (Holstein X Zebu) cows in the humid tropic of Veracruz, México. Int J Anim Veter Adv 2012;4(6):370-377. [ Links ]
2. Jeretina J, Babnik D, Škorjanc D. Modeling lactation curve standards for test-day milk yield in Holstein, Brown Swiss and Simmental cows. J Anim Plant Sci 2013;23(3):754-762. [ Links ]
3. Osorio MM, Segura JC. Factors affecting the lactation curve of dual purpose Bos taurus x Bos indicus cows in the humid tropics of Tabasco, Mexico. Tec Pecu Mex 2005;43(1):127-137. [ Links ]
4. Dijkstra J, López S, Bannink A, Dhanoa MS, Kebreab E, Odongo NE, et al. Evaluation of a mechanistic lactation model using cow, goat and sheep data. J Agric Sci 2010;(148):249-262. [ Links ]
5. Macciotta NPP, Dimauro C, Catillo G, Coletta A, Cappio-Borlino A. Factors affecting individual lactation curve shape in Italian river buffaloes. Livest Sci 2006;104(1-2):33-37. [ Links ]
6. Cole J, Null D, Van Raden P. Best prediction of yields for long lactations. J Dairy Sci 2009;92(4):1796-1810. [ Links ]
7. Leclerc H, Duclos D, Barbat A, Druet T, Ducrocq V. Environmental effects on lactation curves included in a test-day model genetic evaluation. Animal 2008;(2):344-353. [ Links ]
8. Bebbington M, Lai CD, Zitikis R. Modeling lactation curves: classical parametric models re-examined and modified. J Appl Stat 2009;(2)36:121-133. [ Links ]
9. Andersen F, Østerås O, Reksen O, Toft N, Gröhn YT. Associations between the time of conception and the shape of the lactation curve in early lactation in Norwegian dairy cattle. Acta Vet Scand 2011;53(5):1-8. [ Links ]
10. Wood PDP. Algebraic model of lactation curve in cattle. Nature 1967;(216):164-165. [ Links ]
11. Pollott GE. A biological approach to lactation curve analysis for milk yield. J Dairy Sci 2000;83(11):2448-2458. [ Links ]
12. Silvestre AM, Martins AM, Santos VA, Ginja MM, Colaço JA. Lactation curves for milk, fat and protein in dairy cows: A full approach. Livest Sci 2009;122(2-3):308-313. [ Links ]
13. Al Faro LE, Albuquerque LG. Comparação de alguns modelos matemáticos para o ajuste as curvas de lactação individuais de vacas da raça Carcacu. Arq Braz Med Vet Zootec 2000;54(3):295-302. [ Links ]
14. Macciotta NPP, Dimauro C, Rassu SPG, Steri R, Giuseppe P. The mathematical description of lactation curves in dairy cattle. Ital J Anim Sci 2011;10(e51):213-223. [ Links ]
15. Macciotta NPP, Miglior F, Cappio-Borlino A, Schaeffer LR. Fit of different functions to the individual deviations in random regression test day models for milk yield in dairy cattle. Ital J Anim Sci 2007;6(1):153-155. [ Links ]
16. Ramírez R, Núñez R, Ruíz A, Meraz MR. Comparison of equations to estimate lactation curves with different sampling strategies in Angus, Swiss and their crosses. Vet Mex 2004;35(3):187-201. [ Links ]
17. Hernández I, Milera M, Simón L, Hernández D, Iglesias J, Lamela L et al. Avances en las investigaciones en sistemas silvopastoriles en Cuba. En: Sánchez MD, Rosales M. editors. Agroforestería para la producción animal en Latinoamérica. Roma: FAO; 1998:47-59. [ Links ]
18. Wilmink JBM. Studies on test-day and lactation milk, fat and protein yield of dairy cows [doctoral thesis]. Landbouwuniversiteit, Wageningen, Netherlands; 1987. [ Links ]
19. Ali TE, Schaeffer LR. Accounting for covariances among test day milk yields in dairy cows. Can J Anim Sci 1987;67(3):637-644. [ Links ]
20. Kirkpatrick M, Lofsuold D, Bulmer M. Analysis of inheritance, selection and evolution of growth trajectories. Genetics 1990;122(4):979-993. [ Links ]
21. Silvestre AM, Petim-Batista F, Colaco J. The accuracy of seven mathematical functions in modeling dairy cattle lactation curves based on test-day records from varying sampling schemes. J Dairy Sci 2006;89(5):1813-1821. [ Links ]
22. Macciotta NPP, Vicario D, Cappio-Barlino A. Detection of different shapes of lactation curve for milk yields in dairy cattle by empirical mathematical models. J Dairy Sci 2005;88(3):1178-1191. [ Links ]
23. Schaeffer LR. Application of random regression models in animal breeding. Livest Prod Sci 2004;86(1):35-45. [ Links ]
24. Congleton WR, Everett RW. Error and bias of the incomplete gamma function to describe lactation curves. J Dairy Sci 1980;63(1):101-108. [ Links ]
25. Macciotta NPP, Dimauro C, Steri R, Cappio-Borlino A. Mathematical modelling of goat lactation curves. In: Cannas A, Paulina G. editor. Dairy goats feeding and nutrition. 1rst ed. UK: CAB International; 2008:31-46. [ Links ]
26. SAS. SAS/STAT User’s Guide (Release 6.08). Cary NC, USA: SAS Inst. Inc. 1995. [ Links ]
27. Fernández L, Menéndez A, Guerra D. Estudio comparativo de diferentes funciones para el análisis de la curva de lactancia en el genotipo Siboney de Cuba. Rev Cub Cien Agríc 2004;38(4):23-27. [ Links ]
28. González-Peña D. Evaluación genética del ganado Siboney de Cuba empleando la producción del día de control bajo un modelo de regresión aleatoria [tesis doctorado]. La Habana, Cuba: Universidad Agraria de La Habana; 2006. [ Links ]
29. Steri R. The mathematical description of the lactation curve of ruminants: issues and perspectives [doctoral thesis]. Sassari, Italia: Università di Sassari; 2009. [ Links ]
30. Cappio-Borlino A, Macciotta NPP, Pulina GG. Mathematical modelling of milk production patterns in dairy sheep. In: Paulina G. editor. Dairy sheep nutrition. 1rst ed. UK: CAB International ; 2004:13-29. [ Links ]
31. Rekik B, Ben-Gara A. Factors affecting the occurrence of atypical lactations for Holstein-Friesian cows. Livest Prod Sci 2004;87(2):240-245. [ Links ]
32. Landete-Castillejos T, Gallego L. Technical Note: The ability of mathematical models to describe the shape of lactation curves. J Anim Sci 2000;78(12):3010-3013. [ Links ]
33. Dimauro C, Vicario D, Canavesi F, Cappio-Borlino A, Macciotta NPP. Analysis of individual variability of the shape of lactation curve for milk fat and protein contents in Italian Simmental cows. Proc 8th World Cong Genetics Appl Livest Prod. Belo Horizonte, MG, Brasil. 2006. [ Links ]
34. Franci O, Pugliese C, Acciaioli A, Parisi G, Lucifero M. Application of two models to the lactation curve of Massese ewes. Small Ruminant Res 1999;31(2):91-96. [ Links ]
35. Hernández R, Ponce P. Caracterización de la curva de lactancia del genotipo Siboney de Cuba. Rev Cient (Maracaibo) 2008;18(3):291-295. [ Links ]
36. Kettunen A, Mäntysaari EA, Pösö J. Estimation of genetic parameters for milk yield of primiparous Ayrshire cow by random regression test day model. Livest Prod Sci 2000;66(3):251-261. [ Links ]
37. Pool MH, Meuwissen THE. Reduction of the number of parameters needed for a polynomials random regression test day model. Livest Prod Sci 2000;64(2-3):133-145. [ Links ]
Received: October 23, 2014; Accepted: November 24, 2014
 Este es un artículo publicado en acceso abierto bajo una licencia Creative Commons
