


 nova página do texto(beta)
 Artigo em XML
 Referências do artigo
 Enviar este artigo por email
 Citado por SciELO
  Similares em
SciELO
Similares em
SciELO 
 Permalink
1.Introduction and Motivation
Through the history of our species, the universe populated with stars, galaxies and other celestial objects has been visible in the darkness of the night sky, inspiring questions about the cosmos and our relationship to it, and therefore star gazing has been crucial not only for astronomy but also for literature, arts, philosophy and multiple human activities. Nevertheless, the technological advances of our society, added to world population growth, resulted in light pollution in most living areas where people do not have the opportunity to enjoy the night sky. Furthermore issues on human health caused by artificial lighting and impacts on the behavior of plants and animals have been demonstrated. For years now, astronomers have highlighted the negative consequences of the current situation and are promoting the conservation of the dark sky through multiple initiatives (Dark Skies Annual Report 2019). Millions of astronomy enthusiasts will benefit from these efforts which were not an issue for our ancestors.
In Colombia, the interest in astronomy dates back to the end of the 17th century according to recent evidence found in a historical manuscript describing some ideas about the universe by Antonio Sánchez de Cozar, a humble priest whose work, drafted between 1676 and 1696, can be considered as the first original study of astronomy written in Colombia (Portilla & Moreno 2019). Some time later, José Celestino Mutis, a pioneer of science and knowledge, led a botanic expedition and founded an astronomical observatory as part of his initiative to spread science in the region. Erected in 1803, the National Astronomical Observatory of Colombia is the first astronomical observatory that was built in the Americas. The work by Arias De Greiff (1987) details the different historical and cultural aspects related to the development of astronomy in Colombia until the 20th century.
Even though the sky conditions for astronomical observations in the optical range are not very suitable in Colombia, there is a great interest from amateur astronomers, and still quite a few places in which people can enjoy the wonders of the night sky. Many careers of professional astronomers are the result of their early interest in astronomy while being part of amateur groups. This was the case of the geographer, meteorologist and astrometry specialist, William Cepeda Peña, an important disseminator of astronomy since 1965. In the 70s he began astronomical studies in Colombia, such as a star occultations by the Moon (1988-1995), the movement of the Sun using the Hipparcos catalog (2002) and, in particular, related to eclipse observations, e.g., annular solar eclipse (1995), annular eclipse (1980), total solar eclipse (1998), works grouped in Cepeda (2006).
With a valuable legacy behind, we continue investigating eclipses observed from Colombia. In this work, we report on information collected, analyzed and interpreted during the total lunar eclipse on April 14th and 15th in 2014, one of the four total lunar eclipses visible during 2014 and 2015 from Colombia. Particularly, we complement the work by Góez Therán & Vargas Domínguez (2016) doing a deeper analysis of the data acquired from the Tatacoa Desert, a valuable natural location in the country, by measuring meteorological variables and the sly brightness to study the variation of these parameters during the occurrence of the eclipse. This work presents a statistical study and a comparative analysis of sky quality to establish qualitative measurements of the Bortle scale.
2.Methodology
An eclipse takes place when three celestial bodies, i.e. the Earth, the Sun and the Moon, line up or get close to an alignment. A total lunar eclipse is a well-known astronomic event that occurs when planet Earth stands in the way between the Sun and the Moon, allowing our natural satellite to enter into the cone of shadow of the Earth, thus getting darker and turning into a characteristic russet color during the total occultation. At totality, the Earth obstructs most of the solar rays that arrive at the Moon, which has to happen during full-moon phase; some portion (mainly the red part of the visible light spectrum) is deflected by the Earth’s atmosphere and hits the lunar surface making the moon a brownish-red color different from the typical yellow light. The effect depends also on the atmospheric conditions of our planet (clouds, dust particles, clouds of gas due to volcanic eruptions, fires and other gas emissions close to the location where the eclipse observation is carried out), and on the distance between the Moon and the center of the umbra. Figure 1 shows the visibility map for the total lunar eclipse of 14th-15th April 2014 and the different phases of this total eclipse, which is far more common than a total solar eclipse. The total lunar eclipse was followed from the astronomical observatory of Tatacoa and other places in Colombia, with monitoring that depended on the local meteorological conditions of the observing points.
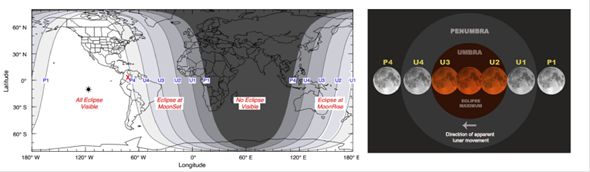
Fig. 1 Visibility map of the total lunar eclipse on 14th-15th April 2014 (left panel). The red X marks the location in Colombia where the eclipse was observed to carry out this research work. All dfferent stages of a total lunar eclipse are also shown in the figure (right panel). Modified from NASA Reference Publication 1178. The color figure can be viewed online.
In this work we aim at measuring the variations of sky quality (Cinzano 2005) and the main meteorological variables during the total lunar eclipse on April 14 th and 15 th of 2014 and their effect on qualitative measurements of the Bortle scale. Tracking changes in the environmental parameters and sky brightness prior to and during the eclipse are used to classify the sky according to the official global scales.
3.Observation and measurements
3.1.Location
The observation of the total lunar eclipse on 14 th -15 th April, 2014 was carried out from the astronomical observatory of the Tatacoa, near the town of Villavieja in the Department of Huila, as shown in Figure 2. The geographic coordinates of this location are 3o14´ North and 75o10´ West.
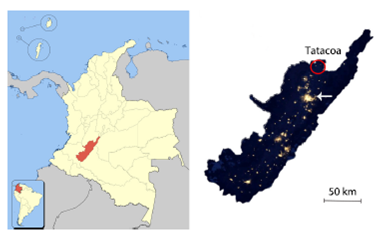
Fig.2 Map of Colombia with a colored reddish area highlighting the Department of Huila (left panel) and a night sky satellite image (right panel) showing some illuminated areas in the same Department, corresponding to small towns and to the city of Neiva (white arrow). The location of Tatacoa Desert is encircled in red. The color figure can be viewed online.
The Tatacoa Desert is one of the most exotic places in Colombia. It has an area of 370 km2. This dry tropical forest is the second largest arid zone in the country after the Guajira Peninsula, with geomorphic principally of estoraques and cavarcas, among others. We decided to select this place for the follow-up of the eclipse, motivated by the success of previous visits pursuing astronomical observations of the Milky Way, globular clusters, nebulae and meteor showers, in addition to the reasonably good average conditions of the location in terms of clear nights, low clouds and water vapor (Góez Therán 2015; Góez Therán & Vargas Domínguez 2016; Pinzon 2016).
3.2.Calibration
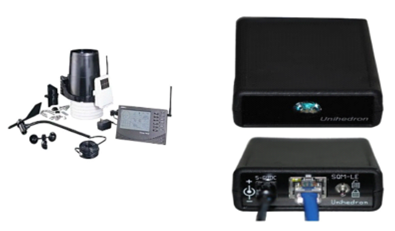
Before the acquisition of scientific data, the equipment was tested and prepared. The installation, assembly and calibration process of the different devices and sensors began at 00:40 UTC, i.e., photometers, weather stations, telescopes, computers and CCD cameras, in order to ensure an optimal and reliable data collection before the eclipse began. Figure 3 displays the main components of the equipment.
3.3.Data
Data acquisition for scientific measurements started right after the first contact, P1, at 4:53:37 UTC. Contact times and all different phases of the eclipse are listed in Table 1. Measurements of sky brightness were taken pointing the SQM to the zenith in all cases.
Table 1 Stages of the total lunar eclipse
| STAGE | Time (UTC) |
| P1 | 04:53:37 |
| U1 | 05:58:19 |
| U2 | 07:06:47 (Beginning of Totality Phase) |
| MAX | 07:45:40 (Totality) |
| U3 | 08:24:35 (Completion of Totality Phase) |
| U4 | 09:33:04 |
| P4 | 10:37:37 |
We used a photometer called SQM-LE to measure the brightness of the sky1, a weather station, WMR200 Davis Instruments Pro with wireless sensors, as shown in Figure 3. Furthermore, three CCD cameras for Celestron astrophotography were employed in order to record all stages of the eclipse (P1, U1, U2, U3 and U4) by using a calibrated Meade ETX-90 telescope (two-star method) and with a permanent monitoring of the Moon to obtain the alt-azimuth values during the data collection period.
The photometer acquires data on a scale of mag.arsec-2. Figure 4 exemplifies the use of this instrument and the way we refer to the magnitude as describing the brightness of an object, i.e. the amount of light striking the sensor. Sky brightness, humidity, pressure and horizontal coordinates of the Moon were registered every 5 minutes and tabulated for the subsequent statistical analysis using the software package SPSS (Argyrous 2005).
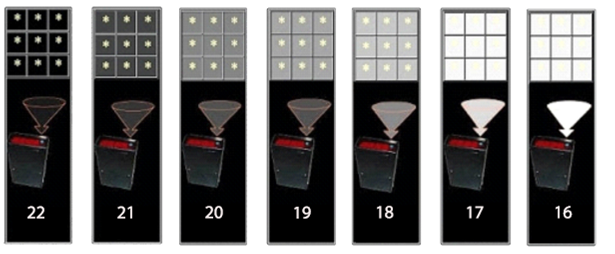
Fig. 4 Sketch showing the use of a sky quality meter (SQM) to measure the amount of light striking the sensor. Numbers in every panel correspond to the value of sky brightness (measured in units of mag. Arcsec-2) characterizing the quality of the sky. Taken from www.nightwise.org. The color figure can be viewed online.
Table 2 presents all the collected data during the observing session.
Table 2 presents all the collected data during the observing session.
| DATA | LOCAL TIME | UTC | SQM (mag.arcsec-2) | TEMPERATURE (oC) | PRESSURE (mbar) | MOON HEIGHT (o) | HUMIDITY (%) | STAGE |
| 1 | 19:40 | 0:40 | 17.11 | 32.3 | 1000 | 26.6 | 43 | C* |
| 2 | 13:45 | 0:45 | 17.04 | 32.2 | 1000 | 27.8 | 43 | C* |
| 3 | 19:50 | 0:50 | 16.94 | 32 | 1000 | 28.9 | 43 | C* |
| 4 | 19:55 | 0:55 | 16.92 | 31.9 | 1000 | 30.1 | 43 | C* |
| 5 | 20:00 | 1:00 | 16.95 | 31.8 | 1000 | 31.3 | 43 | C* |
| 6 | 20.05 | 1:05 | 16.9 | 31.8 | 1000 | 32.3 | 43 | C* |
| 7 | 20.10 | 1:10 | 16.82 | 31.7 | 1001 | 33.7 | 43 | C* |
| 8 | 20:15 | 1:15 | 17 | 31.6 | 1001 | 34.9 | 43 | C* |
| 9 | 20:20 | 1:20 | 17.2 | 31.6 | 1001 | 36 | 43 | C* |
| 10 | 20:25 | 1:25 | 17.15 | 31.6 | 1001 | 37.2 | 43 | C* |
| 11 | 20:30 | 1:30 | 17.18 | 31.5 | 1001 | 38.4 | 43 | C* |
| 12 | 20:35 | 1:35 | 17.03 | 31.5 | 1001 | 39.6 | 43 | C* |
| 13 | 20:40 | 1:40 | 16.72 | 31.3 | 1001 | 40.8 | 43 | C* |
| 14 | 20:45 | 1:45 | 16.5 | 31.2 | 1001 | 41.9 | 43 | C* |
| 15 | 20:50 | 1:50 | 16.35 | 31.1 | 1001 | 43.1 | 43 | C* |
| 16 | 20.55 | 1:55 | 16.29 | 31 | 1002 | 44.3 | 43 | C* |
| 17 | 21:00 | 2:00 | 16.71 | 31 | 1002 | 45.421:05 | 43 | C* |
| 18 | 21:05 | 2:05 | 16.76 | 30.9 | 1002 | 46.6 | 42 | C* |
| 19 | 21:10 | 2:10 | 16.73 | 30.8 | 1002 | 47.8 | 42 | C* |
| 20 | 21:15 | 2:15 | 16.6 | 30.6 | 1002 | 48.9 | 42 | C* |
| 21 | 21:20 | 2:20 | 16.51 | 30.5 | 1002 | 50.1 | 42 | C* |
| 22 | 21:25 | 2:25 | 16.49 | 30.2 | 1003 | 51.2 | 42 | C* |
| 23 | 21:30 | 2:30 | 16.36 | 30 | 1003 | 52.4 | 42 | C* |
| 24 | 21:35 | 2:35 | 16.39 | 29.8 | 1003 | 53.5 | 41 | C* |
| 25 | 21:40 | 2:40 | 16.27 | 29.7 | 1003 | 54.7 | 41 | C* |
| 26 | 21:45 | 2:45 | 16.27 | 29.6 | 1003 | 55.8 | 41 | C* |
| 27 | 21:50 | 2:50 | 15.52 | 29.6 | 1003 | 56.9 | 41 | C* |
| 28 | 21:55 | 2:55 | 15.55 | 29.6 | 1003 | 58 | 41 | C* |
| 29 | 22:00 | 3:00 | 15.57 | 29.6 | 1003 | 59.2 | 41 | C* |
| 30 | 22:05 | 3:05 | 15.52 | 29.7 | 1003 | 60.3 | 41 | C* |
| 31 | 22:10 | 3:10 | 15.79 | 29.7 | 1003 | 61.4 | 41 | C* |
| 32 | 22:15 | 3:15 | 15.91 | 29.8 | 1003 | 62.4 | 41 | C* |
| 33 | 22:20 | 3:20 | 15.84 | 29.8 | 1003 | 63.5 | 41 | C* |
| 34 | 22:25 | 3:25 | 15.57 | 29.9 | 1003 | 64.6 | 41 | C* |
| 35 | 22:30 | 3:30 | 15.50 | 29.9 | 1003 | 65.6 | 41 | C* |
| 36 | 22:35 | 3:25 | 15.44 | 30.0 | 1003 | 66.6 | 41 | C* |
| 37 | 22:40 | 3:40 | 15.38 | 30.0 | 1003 | 67.6 | 42 | C* |
| 38 | 22:45 | 3:45 | 15.32 | 30.0 | 1003 | 68.6 | 42 | C* |
| 39 | 22:50 | 3:50 | 15.26 | 30.1 | 1003 | 69.6 | 42 | C* |
| 40 | 22:55 | 3:55 | 15.20 | 30.1 | 1003 | 70.5 | 42 | C* |
| 41 | 23:00 | 4:00 | 15.14 | 30.2 | 1003 | 71.4 | 42 | C* |
| 42 | 23:05 | 4:05 | 15.08 | 30.2 | 1003 | 72.2 | 42 | C* |
| 43 | 23.10 | 4:10 | 15.02 | 30.3 | 1003 | 73.1 | 42 | C* |
| 44 | 23:15 | 4:15 | 14.95 | 30.3 | 1003 | 73.8 | 41 | C* |
| 45 | 23:20 | 4:20 | 14.89 | 30.4 | 1003 | 74.5 | 41 | C* |
| 46 | 23:25 | 4:25 | 14.83 | 30.4 | 1003 | 75.1 | 42 | C* |
| 47 | 23:30 | 4:30 | 14.77 | 30.5 | 1003 | 75.7 | 42 | C* |
| 48 | 23:35 | 4:35 | 14.71 | 30.5 | 1003 | 76.1 | 42 | C* |
| 49 | 23:40 | 4:40 | 14.65 | 30.5 | 1003 | 76.5 | 43 | C* |
| 50 | 23:45 | 4:45 | 14.59 | 30.6 | 1003 | 76.8 | 43 | C* |
| 51 | 23:50 | 4:50 | 14.53 | 30.6 | 1003 | 76.9 | 43 | P1 |
| 52 | 23:55 | 4:55 | 14.47 | 30.7 | 1003 | 76.9 | 43 | P1 |
| 53 | 0:00 | 5:00 | 14.40 | 30.7 | 1003 | 76.9 | 43 | P1 |
| 54 | 0:05 | 5:05 | 14.34 | 30.8 | 1003 | 76.7 | 43 | P1 |
| 55 | 0:10 | 5:10 | 14.28 | 30.8 | 1003 | 76.4 | 43 | P1 |
| 56 | 0:15 | 5:15 | 14.22 | 30.9 | 1003 | 76 | 43 | P1 |
| 57 | 0:20 | 5:20 | 14.16 | 30.9 | 1003 | 75.5 | 43 | P1 |
| 58 | 0:25 | 5:25 | 14.10 | 31.0 | 1003 | 74.9 | 43 | P1 |
| 59 | 3:30 | 5:30 | 14.04 | 31.0 | 1003 | 74.3 | 43 | P1 |
| 60 | 0:35 | 5:35 | 13.98 | 31.0 | 1003 | 73.6 | 43 | P1 |
| 61 | 0:40 | 5:40 | 13.91 | 31.1 | 1003 | 72.8 | 43 | P1 |
| 62 | 0:45 | 5:45 | 13.85 | 31.1 | 1003 | 72 | 43 | P1 |
| 63 | 0:50 | 5:50 | 14.28 | 28.1 | 1003 | 71.1 | 43 | U1 |
| 64 | 0:55 | 5:55 | 14.36 | 28.3 | 1003 | 70.2 | 43 | U1 |
| 65 | 1:00 | 6:00 | 14.42 | 28.3 | 1003 | 69.3 | 43 | U1 |
| 66 | 1:05 | 6:05 | 14.58 | 28.5 | 1003 | 68.3 | 43 | U1 |
| 67 | 1:10 | 6:10 | 14.62 | 28.6 | 1003 | 67.3 | 43 | U1 |
| 68 | 1:15 | 6:15 | 14.97 | 28.8 | 1003 | 66.3 | 43 | U1 |
| 69 | 1:20 | 6:20 | 15.33 | 29 | 1003 | 65.3 | 42 | U1 |
| 70 | 1:25 | 6:25 | 16.69 | 28.9 | 1003 | 64.2 | 42 | U1 |
| 71 | 1:30 | 6:30 | 18.33 | 28.8 | 1003 | 63.2 | 42 | U1 |
| 72 | 1:35 | 6:35 | 18.51 | 28.8 | 1003 | 62.1 | 40 | U1 |
| 73 | 1:40 | 6:40 | 18.74 | 30.2 | 1003 | 61 | 40 | U1 |
| 74 | 1:45 | 6:45 | 18.81 | 32.2 | 1003 | 59.9 | 40 | U1 |
| 75 | 1:50 | 6:50 | 19.56 | 32.2 | 1003 | 58.8 | 40 | U1 |
| 76 | 1:55 | 6:55 | 19.73 | 30.2 | 1003 | 57.7 | 40 | U1 |
| 77 | 2:00 | 7:00 | 19.85 | 30.2 | 1003 | 56.6 | 40 | U1 |
| 78 | 2:05 | 7:05 | 20.95 | 30.3 | 1003 | 55.4 | 40 | U1 |
| 79 | 2:10 | 7:10 | 21.03 | 30.4 | 1002 | 54.3 | 39 | U2 |
| 80 | 2:15 | 7:15 | 21.11 | 29.8 | 1002 | 53.2 | 40 | U2 |
| 81 | 2:20 | 7:20 | 21.13 | 29.8 | 1002 | 52 | 40 | U2 |
| 82 | 2:25 | 7:25 | 21.11 | 29.7 | 1002 | 50.9 | 40 | U2 |
| 83 | 2:30 | 7:30 | 21.2 | 29.3 | 1002 | 49.7 | 40 | U2 |
| 84 | 2:35 | 7:35 | 21.14 | 29.6 | 1002 | 48.6 | 41 | U2 |
| 85 | 2:40 | 7:40 | 21.15 | 29.8 | 1002 | 47.4 | 40 | U2 |
| 86 | 2:45 | 7:45 | 21.06 | 29.7 | 1002 | 46.2 | 41 | MAX |
| 87 | 2:50 | 7:50 | 21.03 | 29.4 | 1002 | 45.1 | 41 | U3 |
| 88 | 2:55 | 7:55 | 21.19 | 29.2 | 1002 | 43.9 | 42 | U3 |
| 89 | 3:00 | 8:00 | 21.24 | 29 | 1002 | 42.7 | 43 | U3 |
| 90 | 3:05 | 8:05 | 21.22 | 29.1 | 1002 | 41.6 | 45 | U3 |
| 91 | 3:10 | 8:10 | 21.15 | 28.6 | 1003 | 40.4 | 45 | U3 |
| 92 | 3:15 | 8:15 | 21.22 | 28.4 | 1003 | 39.2 | 46 | U3 |
| 93 | 3:20 | 8:20 | 21.22 | 28.3 | 1003 | 38.1 | 46 | U3 |
| 94 | 3:25 | 8:25 | 21.26 | 28.1 | 1002 | 36.9 | 44 | U3 |
| 95 | 3:30 | 8:30 | 21.19 | 28.4 | 1002 | 35.7 | 46 | U4 |
| 96 | 3:35 | 8:35 | 21.12 | 28.7 | 1002 | 34.5 | 47 | U4 |
| 97 | 3:40 | 8:40 | 20.59 | 28.9 | 1001 | 33.3 | 46 | U4 |
| 98 | 3:45 | 8:45 | 20.01 | 29.3 | 1001 | 32.2 | 47 | U4 |
| 99 | 3:50 | 8:50 | 19.39 | 29.2 | 1001 | 31 | 47 | U4 |
| 100 | 3:55 | 8:55 | 18.9 | 29.2 | 1001 | 29.8 | 47 | U4 |
| 101 | 4:00 | 9:00 | 18.74 | 29.2 | 1001 | 28.6 | 47 | U4 |
| 102 | 4:05 | 9:05 | 18.34 | 29.1 | 1001 | 27.4 | 41 | U4 |
| 103 | 4:10 | 9:10 | 18.04 | 29.1 | 1002 | 26.2 | 42 | U4 |
| 104 | 4:15 | 9:15 | 17.88 | 28.7 | 1002 | 25.1 | 42 | U4 |
| 105 | 4:20 | 9:20 | 17.79 | 28.7 | 1002 | 23.9 | 42 | U4 |
| 106 | 4:25 | 9:25 | 17.71 | 28.5 | 1004 | 22.7 | 42 | U4 |
| 107 | 4:30 | 9:30 | 17.67 | 28.5 | 1004 | 21.5 | 42 | U4 |
| 108 | 4:35 | 9:35 | 17.63 | 28.3 | 1004 | 20.3 | 42 | U4 |
C*: CALIBRATION OF EQUIPMENT AND SENSORS
4.Analysis and Results
Figure 5 displays the temporal variation of sky brightness as plotted from all acquired data. The multiple total lunar eclipse stages are identified at the corresponding times (see Table 1). The plot shows clear periods of stability, increase and decrease in the sky brightness, as follows: from P1 to U1 there are not many variations, but starting from U1 there is a continuous increase ending at U2. This moment marks the beginning of the totality phase, in which the sky brightness remains steady for the entire period, that extended until U3 is reached. Soon after, the trend of the plot reveals, for the first time, a decrease of sky brightness.
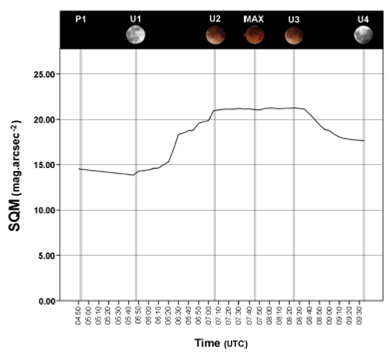
Fig. 5 Plot displaying the time evolution of the sky brightness during the total lunar eclipse observed in Colombia on 14-15 April 2014. The upper image shows the different stages as listed in Table 1. Note that times are shown in UTC. The color figure can be viewed online.
Detailed analysis of Figure 5 allows us to establish an average SQM value of 21.15 mag.arcsec-2 during the totality phase of the eclipse, which can be associated to a Bortle Class 4 of sky quality, as itemized in Table 3 on the international measurement scale. Up to this moment, and from the beginning of the eclipse, SQM values increased and therefore the sky quality improved (Rabaza et al. 2010) , meaning that during this period, the sky can be classified in a Bortle class ranging from 1 to 8.9.
Table 3. Scale measurements of the sky quality
| Sky brightness (mag.arcsec-2) | Bortle Class |
| > 21.90 | 1 |
| 21.90 - 21.50 | 2 |
| 21.50 - 21.30 | 3 |
| 21.30 - 20.80 | 4 |
| 20.80 - 20.10 | 4.5 |
| 20.10 - 19.10 | 5 |
| 19.10 - 18.00 | 6.7 |
| < 18.00 | 8.9 |
Figure 6 plots the temporal evolution of different physical parameters. The values of Moon height and sky brightness measurements are also included. In particular we are interested in the variation of pressure, humidity and temperature during the occurrence of the eclipse. As expected, there are no significant or abnormal changes in these variables for about 5 hours (from 00:40 to 05:40 UTC) before phase U1 of the eclipse. There is a slight decrease in the sky quality (SQM) associated with the rising of the Moon in the sky (from ≈ 25o to ≈77o). From phase U1 until U2 is reached (07:10 UTC), the temperature and humidity exhibit substantial changes, that remain up to phase U3 (08:35 UTC), corresponding to the finishing time for totality.The humidity evidences a peak value soon after, while a maximum temperature of 32.2o is reached closer to U2. On the other hand, the minimum temperature occurs at U3, about 40 minutes after the maximum (MAX) was observed. After totality, from U3 to U4, changes of these variables are still present, with an overall decrease of both.
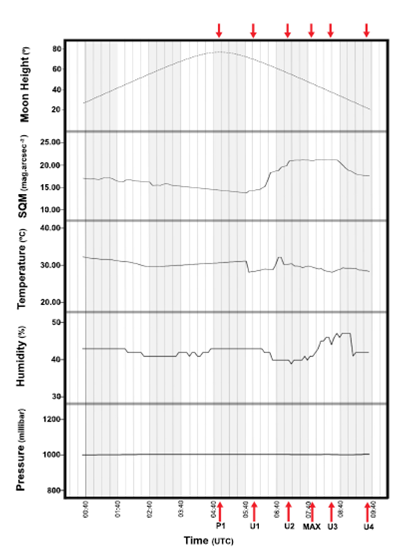
Fig. 6 Temporal evolution of physical parameters (Moon height, SQM, temperature, humidity, pressure) during the total lunar eclipse observed in Colombia on 14th-15th April 2014. The red arrows on top stand as a reference of the times pointed by the bottom arrows, for stages P1, U1, U2, MAX, U3 and U4, respectively. Note that times are shown in UTC. The color figure can be viewed online.
The relative humidity shows a clear decrease after U1, when the eclipse is on its way to totality, but once it is reached, it starts to increase up to a maximum value soon after U3. The maximum humidity value registered is 47% and the minimum value is 39%. Regarding pressure values, shown in the bottom panel in Figure 6, there is a tiny variation of pressure with extreme values of 1002 and 1004 millibars. During the totality phase (U2 to U3) the average value registered is 1002 millibars. Finally, during the maximum of the total lunar eclipse (07:45:40 UT) the Moon height was 46o and the azimuth was 251o from the observation point.
A statistical analysis was carried out in order to study the behavior of all different measurements before and during the eclipse, as shown in Figure 7 from the values listed in Table 4. It also includes statistics for all the acquired data.
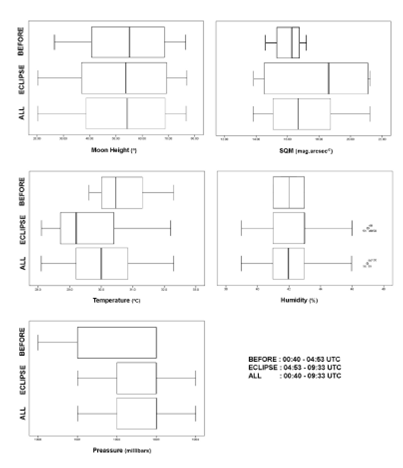
Fig. 7 Statistical box plots for several physical parameters before the occurrence of the eclipse (BEFORE), during the eclipse (ECLIPSE) and for all the acquired data (ALL) on 14th -15th April 2014. Every plot shows the median value (vertical solid line), ±σ, and total range. Atypical values for humidity are marked by small circles. The mean values and standard deviations are listed in Table 4.
Table 4 Descriptive statistics
| N | MINIMUM | MAXIMUM | MEAN | |||
| Value | Stand error | STANDARD DEVIATION | ||||
| ALL DATA (00:40 - 09:35 UT) | ||||||
|
SQM Temperature Pressure Humidity Height |
58 58 58 58 58 |
13.85 28.1 1001 39 20.37 |
21.26 32.2 1004 47 76.92 |
18.0598 29.552 1002.53 42.64 52.4621 |
0.37640 0.1383 0.099 0.284 2.36154 |
2.86654 1.0532 0.754 2.166 17.98499 |
| BEFORE THE ECLIPSE (00:40 - 04:45 UT) | ||||||
|
SQM Temperature Pressure Humidity Height |
50 50 50 50 50 |
14.59 29.5 1000 41 26.55 |
17.20 32.3 1003 43 76.73 |
16.0244 30.618 1002.16 42.06 54.2426 |
0.11687 0.1132 0.157 0.119 2.21850 |
0.82636 0.8004 1.113 0.843 15.68714 |
| DURING THE ECLIPSE (04:50 - 09:35 UT) | ||||||
|
SQM Temperature Pressure Humidity Height |
108 108 108 108 108 |
13.85 28.1 1000 39 20.37 |
21.26 32.3 1004 47 76.92 |
17.1175 30.045 1002.36 42.37 53.2864 |
0.23033 0.1041 0.092 0.164 1.62674 |
2.39368 1.0815 0.952 1.705 16.90561 |
5.Conclusions
The expedition to the Tatacoa Desert, in Colombia, to observe the total lunar eclipse on 14th-15th April 2014, was successfully accomplished. The team managed to complete 9 hours of continuous observation and registration of meteorological variables and sky brightness. The month of April is characterized by the occurrence of intense rainfalls in Colombia. Fortunately the conditions present during the total lunar eclipse in the selected location allowed the expedition team to observe and to record, which was not the case for some other observing locations where attempts failed. Nevertheless, from 09:35 UTC onwards, cloudiness at the observation area in the Tatacoa did not allow us to take measurements during the last part of the astronomical event, in the final penumbral phase. These conditions might have influenced the humidity and temperature values acquired close to the ending phase of the partiality, and future work will have to manage to register these data for the whole duration of the eclipse after P4 is reached.
As explained in § 4, it was possible to detect changes in these variables during the occurrence of the eclipse, except for pressure measurements, which were very stable for all recorded data. Particularly during the totality phase, the temperature and humidity show significant variations, as seen in Figure 6. The corresponding average of sky brightness during totality gives an SQM value of 21.15 mag.arcsec-2 and conditions are such as to classify the sky of the Tatacoa Desert according to the Bortle scale as 4. The maximum total lunar eclipse took place at 07:45:40 UTC on 15th of April, 2014, the moment where the measured temperature was 29.7o. At the initial phase of the lunar eclipse, from P1 to U1, the brightness of the sky slightly increased, reaching a minimum SQM value of 13.85 mag.arcsec-2. Once entering the umbral phase, the brightness of the sky began to decrease considerably, as expected from a reduction in the illumination of the lunar disc. A clear trend is shown in Figure 5. At the precise moment when the eclipse sequence surpassed the umbral phase, the SQM values start to increase. From U2 to U3 the values reached a plateau that remained stable for almost 1.5 hours. Note that the lowest value recorded by the SQM during the entire eclipse (13.85 mag.arcsec-2) corresponds to 8.9 according to the Bortle scale, whereas the highest value was 4. Sources of error in the sky brightness come from the error introduced by the SQM measurements, with a typical value of 0.2302, indicating that the samples were taken as accurately as possible based on the previous calibration of the equipment. Other external factors that can influence the local measurements and that should be borne in mind, are cloudiness, latitude from where it is observed, the environment, vegetation, and the time of year.
Close to the moment of maximum altitude of the Moon (77o), the humidity and pressure do not vary significantly. Humidity is about 43% with a pressure of 1003 mbar. Pressure values keep very stable throughout the whole observing session and ≈75% of the data collected for atmospheric pressure have variations of only 1 mbar. The pressure was the variable that registered the least variation compared to other variables. There was no noticeable variation of the pressure with the height of the Moon, and the humidity value at that time did not change significantly.
When the Moon enters the umbra, the twilight zone generated by Earth, it does not reflect the same amount of light from the Sun, and therefore a decrease in temperature is plausible. In our records, the ambient temperature varies depending on the transition zone the Moon reaches. In P1 the temperature is higher, compared to averages for the penumbra (U1) and umbra (U2), for which lower temperatures are registered. Nevertheless, in this period of time we noticed some clouds approaching to the location, and therefore the temperature decrease can not be directly associated to the totality phase of the eclipse. Further studies should be made to clarify if the actual dependence of the radiation from the Sun reflected by the Moon diminished during the totality phase and if the ambient temperature decreased. We can only determine that the maximum humidity coincides with a minimum temperature value.
Regarding the quality of the sky, depending on the levels of sky brightness, it was observed that SQM values start increasing when the eclipse is in phase U1 with a maximum value of 21.26 mag.arcsec-2. This means that the quality of the sky improves considerably, because there is less brightness of the sky, and therefore the sensor captures fewer photons. It is also discernible from the Moon height and SQM plots in Figure 5 that the sky brightness at the beginning (00:40 UTC) and the end (09:35 UTC) of the observing run are very similar with SQM values of 17.11 and 17.63 mag.arcsec-2, respectively, with also a rather similar Moon height values of 26.6o and 20.3o for every case. This confirms that the effect of sky quality variation depends almost entirely on the eclipse occurrence and not on the altitude of the Moon over the horizon and the way it affects the scattered light. Unfortunately, as mentioned before, the weather conditions were not favorable after U4 to continue acquiring data and measuring the conditions after P4 was reached. Nevertheless, it can be established without further inspection, that the sky quality of that night at the Tatacoa Desert corresponded to a Bortle Class value of 8.9 when the eclipse was not occurring.
Figure 7 displays statistical box plots for all the different parameters separated in three different intervals: before the occurrence of the eclipse (BEFORE), during the eclipse (ECLIPSE) and for all the acquired data (ALL), in order to quantify the influence of the eclipse on the normal conditions of at the beginning of the night, and how the median values are affected.
Our results were compared with recent studies based on comparative data, reports, and measurements associated with the extension project of the National Astronomical Observatory of Colombia entitled “Monitoring the quality of the sky in the Tatacoa Desert to obtain the Starlight certification as an astrotourism destination”2. The study included measurements obtained during the new moons over a year, from January to December 2018, and their respective analysis, confirming that the quality of the Tatacoa sky is compatible with the requirements as a Starlight astronomical destination3 This comparative study aims at monitoring the quality of the sky in three locations to characterize this destination; the authors recorded their data at the beginning, in the middle, and at the end of the night, in units of mag.arcsec-2 verifying that, according to their results, the required values are close to, or greater than, 21 mag.arcsec-2, in agreement with the the result for sky quality presented in our work during the totality phase of a lunar eclipse.

