


 nova página do texto(beta)
 Inglês (pdf)
 Artigo em XML
 Referências do artigo
 Enviar este artigo por email
 Citado por SciELO
  Similares em
SciELO
Similares em
SciELO 
 Permalink
1. INTRODUCTION
The eclipsing binary star TYC 2402-643-1 (NSVS 6868895 = GSC 02402-00643 = UCAC4 635-024089) was proposed as a variable star in the list provided by Gettel et al. (2006) which suggested a period of variability of 0.399579 days.
Based on the four values of the new times of minima (ToM’s), listed in Table 1, we propose the new ephemeris as:
TYC 2703-1235-1 (NSVS 8702136 = GSC 0270301235 = UCAC4 604-123844) was found to be a variable star by Wózniak et al. (2004) from the Northern Sky Variability Survey.
TABLE 1 CCD TIMES OF MINIMA FOR TYC 2402-643-1
| HJD | Epoch(1) | O−C(1) | Error | Source |
| 2458865.3249 | 0.0 | 0.0001 | 0.0021 | This paper |
| 2458865.5256 | 0.5 | 0.0010 | 0.0029 | This paper |
| 2458866.3232 | 2.5 | -0.0006 | 0.0028 | This paper |
| 2458866.5232 | 3.0 | -0.0004 | 0.0025 | This paper |
The first period was indicated by J. S. Shaw and collaborators in their online list (https://www.physast.uga.edu/∼jss/nsvs/) as P = 0.393128 days and the type of variability was suggested as the W UMa system. Using two ToM’s as obtained from literature Hoñkova et al. (2013)) and three ToM’s as observed by us (Table 2) we can propose a new ephemeris as follows:
TABLE 2 CCD TIMES OF MINIMA FOR TYC 2703-1235-1
| HJD | Epoch(2) | O−C(2) | Error | Source |
| 2455799.4988 | -8366.0 | 0.0020 | 0.0005 | OEJV 160 |
| 2455800.4776 | -8363.5 | -0.0020 | 0.0010 | OEJV 160 |
| 2459088.4634 | 0.0 | 0.0000 | 0.0034 | This paper |
| 2459089.4463 | 2.5 | 0.0001 | 0.0009 | This paper |
| 2459090.4289 | 5.0 | -0.0001 | 0.0012 | This paper |
TYC 2913-2145-1 also identified STAREaur01201= GSC 02913-02145 = UCAC4 654-032034, was suggested as a variable, with a period of 0.54634 days, during the observations of the STellar Astrophysics and Research on Exoplanets (STARE) operating in the Canary Islands, Spain (http://www.hao.ucar.edu/research/stare/lcdatabase.html). The proposed variability was EB type.
During our observations we obtained two ToM’s (Table 3) and the new ephemeris:
2. OBSERVATIONS AND DATA REDUCTION
The preliminary available information about the targets was taken from the AAVSO Variable Star Index database (VSX) and is presented in Table 4.
TABLE 4 PARAMETERS OF THE TARGETS FROM THE VSX DATABASE
| Target | RA(2000) | Dec(2000) | Period, d | Mag. | Ampl. | Reference |
| TYC 2402-643-1 | 05:18:58.08 | +36:58:05.96 | 0.399579 | 11.373(R1) | 0.442 | Gettel et al. (2006) |
| TYC 2703-1235-1 | 21:21:40.47 | +30:36:07.02 | 0.393128 | 11.94(R1) | 0.75 | Hoffman et al. (2009) |
| TYC 2913-2145-1 | 05:21:42.98 | +40:41:00.71 | 0.54634 | 10.61(R) | 0.40 | Brown & Charbonneau (2000) |
To investigate the absolute parameters, the eclipsing binary stars TYC 2402-643-1, TYC 27031235-1 and TYC 2913-2145-1 have been observed in 2020 with the 30-cm Ritchey Chretien Astrograph located into the IRIDA South dome of the NAO Rozhen - Bulgaria.
The astrograph was equipped with a focal reducer to work at f/5 and a CCD camera ATIK 4000M (2048 × 2048 pixels, 7.4 µm/pixel, pixel-scale of the optical system of 1.04 arcsec/pixel and a field of view of 35 × 35 arcmin).
The photometric observations were carried out with Sloan type filters in the g’, i’ bands and the log of CCD photometric observations is presented in Table 5.
TABLE 5 LOG OF PHOTOMETRIC OBSERVATIONS
| Target | UT Date [yyyymmdd] |
Exposures (g’,i') [s] |
Number (g’,i') | Mean error (g’,i') [mag] |
| TYC 2402-643-1 | 2020 Jan 16 | 30, 90 | 237, 237 | 0.011, 0.009 |
| 2020 Jan 17 | 30, 90 | 204, 204 | 0.009, 0.008 | |
| TYC 2703-1235-1 | 2020 Aug 26 | 60, 90 | 106, 106 | 0.008, 0.009 |
| 2020 Aug 27 | 60, 90 | 167, 167 | 0.004, 0.005 | |
| 2020 Aug 28 | 60, 90 | 86, 86 | 0.004, 0.005 | |
| TYC 2913-2145-1 | 2020 Jan 18 | 30, 90 | 240, 240 | 0.007, 0.006 |
| 2020 Jan 20 | 30, 90 | 98, 98 | 0.009, 0.009 | |
| 2020 Jan 21 | 30, 90 | 223, 223 | 0.006, 0.006 | |
| 2020 Jan 23 | 30, 90 | 113, 113 | 0.006, 0.007 |
The standard sequence (de-biasing, dark frame subtraction and flat-fielding) was applied for photometric data reduction by the software AIP4WIN2.0 Berry & Burnell (2006). The aperture ensemble photometry was carried out with the automatic photometry tool LesvePhotometry1 de Ponthire (2010).
The color transformation was applied along with the previously estimated transformation coefficients of the optical system. To obtain the magnitudes in the respective color bands for the comparison and check stars we used the catalogue APASS DR9 Henden et al. (2015) (Table 6).
TABLE 6 MAGNITUDES OF THE COMPARISON AND CHECK STARS
| Label | Star ID | RA(2000) | Dec(2000) | g' | i' |
| Target | TYC 2402-643-1 | 05 18 58.10 | +36 58 05.2 | 11.349 | 10.797 |
| Chk | UCAC4 636-024573 | 05 19 01.87 | 02 53.48 | 12.973 | 11.620 |
| C1 | UCAC4 636-024658 | 05 19 21.61 | 02 27.18 | 13.639 | 12.624 |
| C2 | UCAC4 636-024637 | 05 19 15.80 | 01 23.13 | 13.006 | 12.393 |
| C3 | UCAC4 635-024132 | 05 19 08.76 | 58 06.84 | 12.222 | 11.689 |
| C4 | UCAC4 636-024521 | 05 18 48.57 | 05 08.70 | 12.560 | 11.966 |
| C5 | UCAC4 636-024485 | 05 18 39.27 | 06 07.67 | 11.680 | 11.514 |
| C6 | UCAC4 635-024236 | 05 19 35.14 | 50 25.01 | 11.455 | 10.924 |
| Target | TYC 2703-1235-1 | 21 40.52 | +30 36 08.1 | 11.745 | 11.043 |
| Chk | UCAC4 604-123798 | 21 23.20 | 36 01.70 | 12.897 | 11.945 |
| C1 | UCAC4 604-123970 | 22 24.04 | 45 07.66 | 12.889 | 11.076 |
| C2 | UCAC4 604-123988 | 22 28.49 | 42 26.83 | 13.124 | 12.607 |
| C3 | UCAC4 604-123848 | 21 41.68 | 39 27.15 | 12.409 | 12.245 |
| C4 | UCAC4 604-123814 | 21 28.51 | 41 03.43 | 11.854 | 10.543 |
| C5 | UCAC4 603-128892 | 21 45.45 | 33 40.65 | 12.735 | 12.606 |
| C6 | UCAC4 604-123956 | 22 19.14 | 36 55.52 | 12.170 | 10.988 |
| C7 | UCAC4 604-123756 | 21 04.98 | 37 11.64 | 12.252 | 12.052 |
| Target | TYC 2913-2145-1 | 05 21 42.90 | +40 40 58.0 | 10.972 | 10.580 |
| Chk | UCAC4 654-031899 | 05 20 56.36 | 38 49.86 | 12.606 | 11.747 |
| C1 | UCAC4 654-032144 | 05 22 23.34 | 41 51.84 | 12.089 | 11.489 |
| C2 | UCAC4 654-031940 | 05 21 10.50 | 47 17.45 | 12.483 | 11.898 |
| C3 | UCAC4 654-032070 | 05 21 54.82 | 42 32.33 | 12.351 | 11.873 |
| C4 | UCAC4 653-032388 | 05 21 46.72 | 32 29.57 | 11.919 | 11.528 |
| C5 | UCAC4 655-033047 | 05 21 32.40 | 48 41.47 | 10.969 | 11.063 |
| C6 | UCAC4 654-032142 | 05 22 22.81 | 47 31.99 | 10.229 | 10.138 |
3. PHOTOMETRIC SOLUTIONS WITH THE W-D METHOD
No published photometric solutions have been found for all three systems. The latest version of the Wison-Devinney code, (Wilson & Devinney 1971, Wilson 1990, Wilson & van Hamme 2015) was used to perform a simultaneous analysis of the available light curves. The effective temperatures determined in different ways are shown in Table 7 where T
g−i
is determined by the measured index (g’ - I’) at quadrature while
TABLE 7 TARGET TEMPERATURES
| Target TYC 2402-643-1 |
Tg-i 5899 |
TG 6429 |
TLamost 6511 |
Tm 6280 |
| Target TYC 2703-1235-1 |
6180 |
5884 |
5736 |
Tm 5930 |
| Target TYC 2913-2145-1 |
Tg-i 6254 |
TG 6694 |
6530 |
Tm 6470 |
The shape of the light curves of these systems is similar to the most frequent light curve shapes of the W UMa type binary stars, so the classical Mode 3 (overcontact configuration) of the W-D code was used.
The q-search procedure was used, leaving as free parameters the temperature of the secondary components T 2, the inclination i of the systems, the non-dimensional surface potentials (Ω1=2) and the monochromatic luminosities of the primary components L 1. Other parameters such as g 2 ,A 2 ,L 2 ,x 2 and y 2 are not free but fixed to their theoretical values.
As soon as the Σ(res)2 showed a minimum value we also added the value of the mass-ratio q to the set of the free parameters and ran a new W-D working session that only stopped when the corrections to the parameters became smaller than their probable errors (Figure 1).

The mass-ratio converged to a value of q = 0.210 for TYC 2402-643-1, q = 3.05 (1/q = 0.327) for TYC 2703-1235-1 and q = 0.193 for TYC 2913-2145-1 in the final solution. The value of the mass ratios for the first and the third systems corresponds to a transit at the primary minima inherent to the A-subtype contact binaries, while for TYC 2703-1235-1 the value corresponds to an occultation at primary minima, a typical W-subtype contact binary in the Binnendijk (1965) classification.
The light curve of TYC 2703-1235-1 shows asymmetries between the two maxima with Max II higher than Max I by 0.02 mag in the g’ filter, the well known inverse O’Connell effect (O’Connell 1951), while in the i’ filter this effect is not detectable. To justify this asymmetry, a small 25◦ hot spot has been placed on the surface of the primary component of the system.
The fact that the presence of a hot spot tends to be less noticeable at longer wavelengths is already known and it is an indication of a wavelength-dependent hot spot activity, probably due to an impact from a mass transfer between the components.
It is well known that in the Wilson-Devinney program the errors of the adjustable parameters are unrealistically small. The problem of unrealistically small errors is not intrinsic to the WD method nor related only to parameter correlations. In fact the WD code provides the “probable” errors, which are derived by the differential correction routine and are related to the standard errors of the linearized least-squares algorithm, and the errors can be used as a measure of the uncertainties only for normal distributions of the photometric errors.
Many strategies are possible to obtain an independent estimate of the uncertainties in a light curve analysis. One of these is to approach the problem through the bootstrap technique (Efron & Tibshirani 1986, Esmer et al. 2021), that allows to estimate parameter confidence levels of least squares solutions.
For this purpose we have generated many different data samples of free parameters( i, Ω 1,2 , T 2, l 1 and q) by random resampling with repetitions (bootstrapping), performing the minimization procedure for each sample and deriving confidence intervals from the resulting distribution of parameters.
The full set of parameters from our solutions is listed in Tables 8 and 9. The results of our modeling and the obtained fitted curves are shown in Figure 2, while graphic representations of the three systems are shown in Figure 3, using the Binary Maker 3.0 software (Bradstreet & Steelman 2002).
TABLE 8 VALUES OF THE FITTED PARAMETERS
| Target | q | i [o] |
Ω1,2 | T1 [K] |
T2 [K] |
Θ [o] |
φ [o] |
y [o] |
Ts/T* |
| TYC 2402-643-1 | 0.210(6) | 86.79(43) | 2.2216(12) | 6280(fxd) | 6088(43) | - | - | - | - |
| TYC 2703-1235-1 | 3.054(30) | 81.77(44) | 6.5507(29) | 5930(fxd) | 5725(86) | 91.2(9) | 20.7(1.1) | 25.1(7) | 1.05(2) |
| TYC 2913-2145-1 | 0.194(5) | 88.61(58) | 2.1870(23) | 6470(fxd) | 5740(86) | - | - | - | - |
TABLE 9 CALCULATED PARAMETERS
| Target | r1 | r2 | f | l1 | l2 | Σ(res)2 |
| TYC 2402-643-1 | 0.530(10) | 0.266(2) | 0.273 | 0.798(23) | 0.177(3) | 0.000469 |
| TYC 2703-1235-1 | 0.299(2) | 0.491(2) | 0.238 | 0.286(34) | 0.665(5) | 0.000455 |
| TYC 2913-2145-1 | 0.535(2) | 0.258(2) | 0.221 | 0.861(23) | 0.122(1) | 0.001232 |
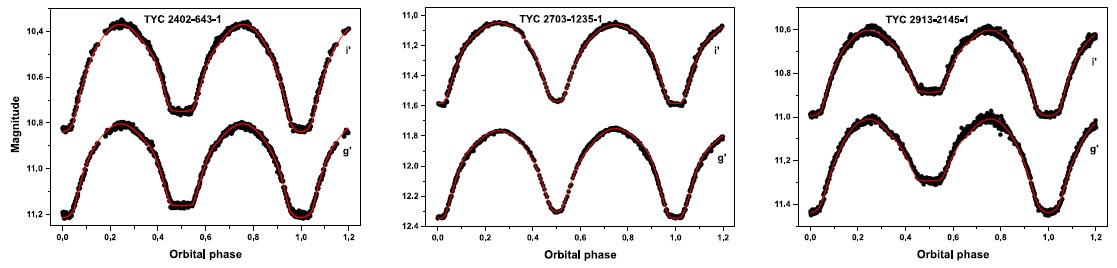
Fig. 2 CCD light curves of the systems. The points are the original CCD observations and the full lines are the theoretical fits with the surface spot contribution. The color figure can be viewed online.
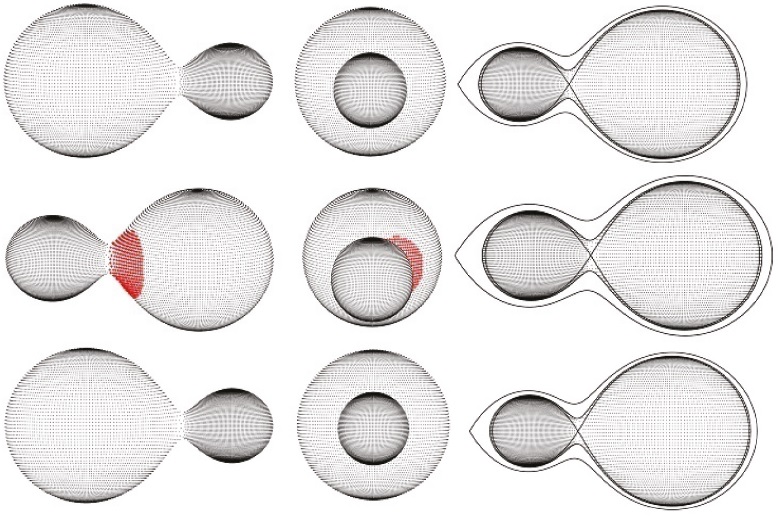
Fig. 3 Graphic representation of TYC 2402-643-1 (top), TYC 2703-1235-1 (middle) and TYC 2913-2145-1 (bottom) according to our solution, at quadrature (left) and at the primary minimum (center). Right: the configuration of the components of the systems in the orbital plane is shown. The color figure can be viewed online.
4. ESTIMATE OF THE ABSOLUTE RELATIVE ELEMENTS
Since no spectroscopic measurements of the orbital elements are available at present, the absolute parameters of the systems cannot be determined directly. Therefore, these results should be considered “relative” rather than “absolute” parameters and regarded as preliminary. The low galactic latitude of the systems implies that interstellar reddening E(B-V) may be large. Therefore, we have preferred to use a statistical method for the estimation of the absolute elements instead of a method based on the Gaia distance.
The empirically three-dimensional correlations from Gazeas (2009) M(P,q), R(P,q), given below, logM 1 = 0.725(59)logP−0.076(32)logq+0.365(32), logM 2 = 0.725(59)logP+0.924(33)logq+0.365(32), logR 1 = 0.930(27)logP−0.141(14)logq+0.434(14), logR 2 = 0.930(29)logP+0.287(15)logq+0.434(16), and the Stefan-Boltzmann law
allowed us to have a preliminary estimate of the relative parameters of the systems under study. It is important to note that the empirical law does not give the full solution but an approximation of their physical parameters, as the single quantities are affected by errors of 13% and 14% for M 1 and M 2, 5% and 7% for R 1 and R 2.
In the article by Gazeas (2009) it is stated that the empirical laws relating to the 3D domain are affected by an error of less than 5%. In order to verify whether this statement is a under or overestimated value, we have applied the above relations to the catalog of contact binaries reported in the article by Gazeas & Stępień (2008) thus calculating masses, radii and luminosity of all systems. Comparing the difference between the calculated parameters and those reported in the catalog, we found that the RMS of the residuals is much higher than 5%. This procedure has therefore allowed us to obtain more realistic values of the uncertainties of the estimated values of the absolute elements reported in Table 10.
TABLE 10 RELATIVE PARAMETERS
| Target | L1 [L⨀] |
L2 [ L⨀] |
R1 [R⨀] |
R2 [R⨀] |
α [R⨀] |
M1 [M⨀] |
M2 [M⨀] |
Sp.type |
| TYC 2402-643-1 | 2.91(76) | 0.68(20) | 1.44(7) | 0.74(5) | 2.68(12) | 1.34(17) | 0.28(4) | F7V+F9V |
| TYC 2703-1235-1 | 0.66(20) | 1.99(52) | 0.83(6) | 1.33(7) | 2.70(12) | 0.42(6) | 1.28(17) | G0V+G3V |
| TYC 2913-2145-1 | 6.00(1.6) | 0.91(28) | 1.95(10) | 0.97(7) | 3.55(16) | 1.69(22) | 0.33(5) | F5V+G3V |
Note: Spectral types are according to Pecaut & Mamajek (2013).
We used the estimated relative elements of the systems as reported in Table 10 to investigate the evolutionary states of our targets by comparing the location of their components on the main sequence (MS) diagrams expressed as logT-logL, logM-logL, logM-logR, and logM-logT. We built the isochrone tracks for the zero age main sequence (ZAMS) and the terminal age main sequence (TAMS) according to the PARSEC models (Bressan et al. 2012), as shown in Figure 4. As the PARSEC models extend up to 30 Gyr we limited the TAMS evolutionary tracks to stars with masses larger than 0.7M ⨀.
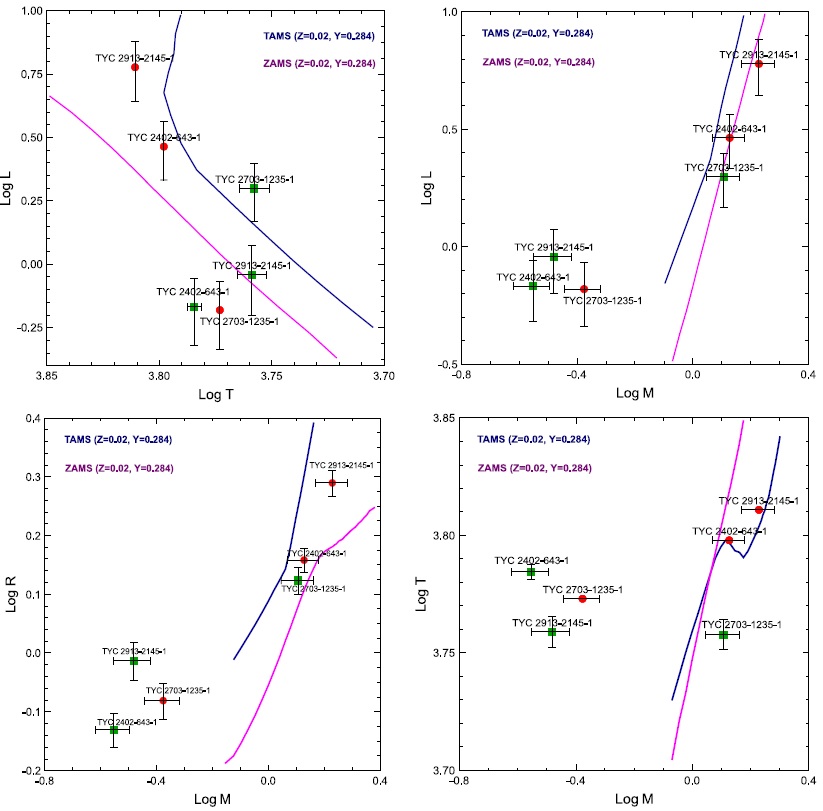
Fig. 4 Properties of our targets shown against evolutionary tracks of log T - log L, logM - log L, logM - logR, and logM - logT (Bressan et al. 2012). The primaries are marked with red circles and the secondaries with green squares. The color figure can be viewed online.
The correlations between the absolute parameters of our targets (W UMa stars) differ from the correlations between the parameters of the stars belonging to MS. The evolutionary states of the binary components of our targets are similar. The more massive components are near the ZAMS, meaning that they are little evolved stars, while the less massive components are located above the TAMS, implying that they have evolved away from the main sequence. These results are due to the mass and energy exchange between the binary components and their internal evolutionary transformations.
The three targets do not differ from the general cases of the EW type stars, where the less massive components of the binary systems have a luminosity larger than that of a main sequence star with the same mass and radius, (Yakut & Eggletton 2005, Yildiz & Doğan 2013). For the W subtype this phenomenon can be due to the energy transfer from the primary to the secondary star that changes the secondary and makes it over-sized and over-luminous for its mass (Webbink 2003, Li et al. 2008). The secondary components of the A-subtype are thought to have evolved from initially more massive stars (Zhang et al. 2020).
5. FROM DETACHED TO CONTACT PHASE
The formation of the W UMa type contact binaries is a complex process in which different mechanisms are combined.
Yildiz & Doğan (2013) developed a method for the computation of the initial masses of contact binaries. Their main assumption is that the mass transfer starts near or after the TAMS phase of the initially massive component, which is the progenitor of the currently less massive components. They discovered that binary systems with an initial mass larger than 1.8±0.1M ⨀ become A-subtype, while systems with initial masses smaller than this become W-subtype.
By applying their method to our systems we derived the masses of the progenitors of the systems M 2i and M 1i with the semi-major axis α fof and the orbital periods P fof at the time of the first overflow (i.e fof).
These parameters are computed from equations from Yildiz & Doğan (2013) as developed by Kriwattanawong & Kriwattanawong (2019) and are reported in our Table 11.
6. CONCLUSIONS
We have derived, for the first time, a photometric solution for the eclipsing binary systems TYC 2402-643-1, TYC 2703-1235-1 and TYC 2913-2145-1.
TYC 2402-643-1 and TYC 2913-2145-1 are found to be A-type contact binaries and, having mass ratios < 0.25, can be classified as extreme mass ratio binary systems (EMRBs) (Samec et al. 2015). The discovery of binaries with extremely low mass ratios as our targets and other similar, such as USNO-B1.0 1452-0049820 and ASAS J102556+2049.3 from Kjurkchieva et al. (2018a) and NSVS 2569022 with q = 0.077 and of some others as were pointed out in Table 3 of Kjurkchieva et al. (2018b) provoke future theoretical investigations to establish the lower mass ratio limit of the W UMa type stars.
TYC 2703-1235-1 was found to be a W-subtype with a mass ratio of q = 3.054 (q inv = 0.327) and a shallow fill-out parameter of f = 22.1%. These characteristics agree with those of most W-subtype contact systems.
Our systems have high orbital inclination, between 81 and 88 degrees, displaying total eclipses, so the photometric parameters obtained here are reliable (Terrell & Wilson 2005).
W UMa systems generally show an almost equal temperature for the components, and this is the case for two of the three systems. In contrast, TYC 2913-2145-1 is in a relatively poor thermal contact with ∆T = 730K. The relatively large difference in temperature and the shallow fill-out value could indicate that TYC 2913-2145-1 may be at a key evolutionary stage, as predicted by the thermal relaxation oscillation theory (TRO) (Lucy 1967, Lucy & Wilson 1979, Flannery 1976, Robertson & Eggleton 1977, Eggleton 1996, Qian & Ma 2001, Yakut & Eggleton 2005, Li et al. 2005, and Li et al. 2008).
From our observed ToM’s as well as from those obtained from the literature we cannot say much about the period variation of the systems, but we used the data in our analysis for refining the ephemeris.
Following the work of Qian et al. (2020) it is possible to see that the position of TYC 2913-2145-1 in the period-temperature correlation graph is just on the outer edge of the lower boundary, confirming that it is at the beginning of the evolutionary stage of contact binary evolution (Figure 5), as assumed by us due to both its relatively large temperature difference and the low value of contact between the components.
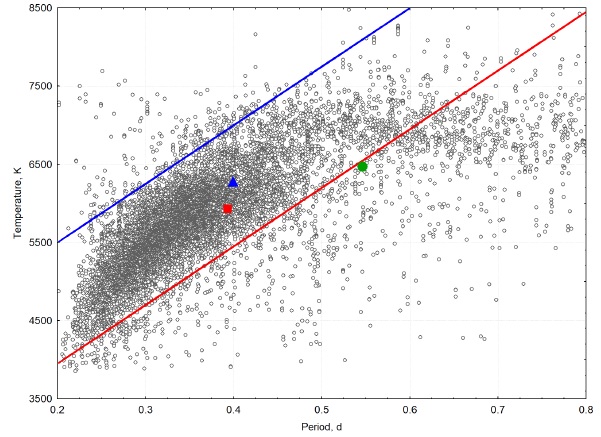
Fig. 5 Correlation between orbital period and temperature based on parameters of 8510 contact binaries from Qian et al. (2020). The position of TYC 2402-643-1 is marked in blue, the one of TYC 2703-1235-1 in red and the one of TYC 2913-2145-1 in green. The red and blue lines are the boundaries of normal EWs. Systems near the red border are marginal contact systems, while those close to the blue border are deep contact ones. The color figure can be viewed online.
The other two systems show a good thermal contact with difference in temperatures between the components of a couple of hundred K, and are well inside the boundaries for normal EW; they will approach the final evolutionary stage of the contact binary evolution (Figure 5).
Absolute parameters were estimated for the components. The overluminosity of the secondaries in the W UMa systems can be due to the energy transfer from the primary to the secondary for the W-subtype, and to the evolution of the secondary component from an initial more massive star of A-subtype.
The study of Yildiz & Doğan (2013) shows that the W UMa binary systems with an initial mass of the secondary component of the system (M2 i , the actual primary component) larger than 1.8±0.1MJ become A subtype, while the systems with initial masses smaller than this become W subtype.
By applying the method to our systems we are able to estimate the absolute relative parameters of the detached system, the progenitor of the contact system, as shown in Table 11. We found that the initial mass of the secondary component of the two A-subtypes would be greater than 1.8 solar masses, while for the W-subtype system it would be smaller than that value, as predicted.
The results show that the angular momentum of the three systems has decreased; consequently, the orbital period and the semi-major axis have decreased too. To verify the reliability of our results we used the relationship between masses and ratios as specified in Qian (2001). We found that our systems do not deviate from these correlations.

