


 nova página do texto(beta)
 Inglês (pdf)
 Artigo em XML
 Referências do artigo
 Enviar este artigo por email
 Citado por SciELO
  Similares em
SciELO
Similares em
SciELO 
 Permalink
1. INTRODUCTION
High amplitude δ Scuti stars, hereafter HADS, represent a very small percentage (<1%) of all δ Sct variables (Lee et al. 2008). Driven by the κ-mechanism (opacity pump) resulting from partial ionization of He II (Pamyatnykh 1999), they commonly oscillate (∆V > 0.1 mag) via low-order single or double radial pulsation modes (Poretti 2003a,b; Niu et al. 2013, 2017). Many (≈40%) are double pulsators exhibiting simultaneous pulsations in the fundamental and the first overtone mode with amplitudes generally higher in the fundamental mode (McNamara 2000). Although uncommon, non-radial pulsations were detected in the HADS variable V974 Oph (Poretti 2003a,b). HADS variables have historically been divided according to metallicity relative to the Sun where [Fe/H] is defined as zero. The metalpoor ([Fe/H]<<0) group is classified as SX Phe-like stars based on the prototype SX Phoenicis. Ostensibly they have shorter periods (0.02<P<0.125 d) and lower masses (≈1.0-1.3Mʘ) than their related HADS variables possessing near solar metal abundance (McNamara 2011). SX Phe stars frequently reside in globular clusters (GC) which are ancient collections of Population II stars. The majority of these pulsators are classified as blue straggler stars, paradoxically appearing much younger than their GC cohorts. Balona & Nemec (2012) proposed that it is not possible to differentiate between δ Sct and field SX Phe variables based on pulsation amplitude, the number of pulsation modes, period or even metallicity (Garg et al. 2010). Much more sensitive space instruments like NASA’s Kepler (Gilliland et al. 2010; Guzik 2021), the European Space Agency’s CoRoT (Baglin 2003) and the Canadian’s Microvariability and Oscillations of STars [MOST] (Walker et al. 2003) have found many examples that violate the traditional differentiation between HADS and SX Phe pulsators. Balona & Nemec (2012) further contend that the evolutionary status of each star is the only way to distinguish between these two classes.
An additional classification scheme for δ Scuti stars was recently proposed by Qian et al. (2018) wherein two distinct groups of δ Scuti stars were uncovered from the LAMOST survey that fundamentally differed in effective temperature. One group was identified as normal δ Scuti stars (NDSTs) when T eff ranged between 6700-8500 K while the other defined as unusual and cool variable stars (UCVs) with T eff had values less than 6700 K. A more restrictive fundamental pulsation range (0.09-0.22 d) coupled with being slightly metal poor ([Fe/H] = −0.25 − 0.0) further differentiates the UCVs from the NDST group. Furthermore, once the UCV stars were excluded from consideration, empirically based temperature-period, log g-period, and metallicity-period relationships were derived for NDSTs like PT Com.
The variability of PT Com (J2000-12:13:40.7640 +17h 14m 37.84; l = 259.5536 b = 76.8169) was first recorded in unfiltered photometric data collected during the ROTSE-I Survey (Akerlof et al. 2000; Woźniak et al. 2004). Additional monochromatic CCD-derived lightcurve data were captured from the Catalina Sky Survey1 (Drake et al. 2009), the All Sky Automated Survey2 (Pojmanski 2000), the All Sky Automated Survey for Supernovae3(Shappee et al. 2014). Other photometric data which ultimately lead to the determination of timeto-maximum (ToMx) light values were reported by Wunder (2012) and Wils et al. (2014). This report marks the first multi-bandpass photometric study on PT Com which also provides a detailed Fourier analysis of this radial pulsator and critically assesses its classification as a HADS variable.
2. OBSERVATIONS AND DATA REDUCTION
Precise time-series images were acquired at Desert Blooms Observatory (DBO, USA - 31.941 N, 110.257 W) using a QSI 683 wsg-8 CCD camera mounted at the Cassegrain focus of a 0.4-m Schmidt-Cassegrain telescope. A Taurus 400 (Software Bisque) equatorial fork mount facilitated continuous operation without the need to perform a meridian flip. The image (science, darks, and flats) acquisition software (TheSkyX Pro Edition 10.5.0) controlled the main and integrated guide cameras. This focal-reduced (f/7.2) instrument produces an image scale of 0.76 arcsec/pixel (bin=2×2) and a field-of-view (FOV) of 15.9×21.1 arcmin. The CCD camera is equipped with B, V and I c filters manufactured to match the Johnson-Cousins Bessell prescription. Dark subtraction, flat correction and registration of all images collected at DBO were performed using AIP4Win v2.4.0 (Berry & Burnell 2005). Instrumental readings were reduced to catalog-based magnitudes using the AAVSO Photometric All-Sky Survey (APASS) star fields (Henden et al. 2009, 2010, 2011; Smith et al. 2011) built into MPO Canopus v10.7.1.3 (Minor Planet Observer). An image showing the FOV for PT Com (T) and the ensemble of three non-varying comparison stars (1-3) is shown in Figure 1. The identity (HST Guide Star Catalog, Version GSC-ACT), Gaia DR2 J2000 coordinates and APASS color indices (B-V ) for these stars are provided in Table 1. Since all program stars share a relatively small FOV, differential atmospheric extinction was ignored while data from images taken below 30◦ altitude (airmass >2.0) were excluded.
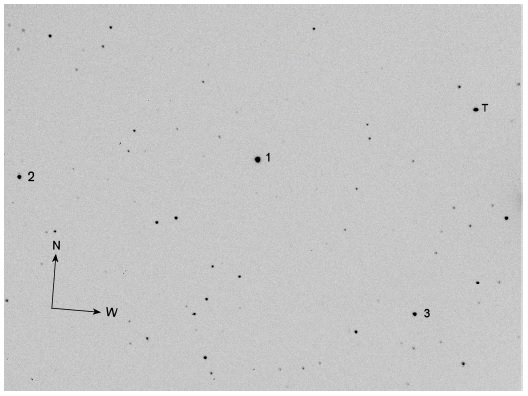
Fig. 1 FOV (15.9×21.1 arcmin) containing PT Com (T) along with the three comparison stars (1-3) used to reduce time-series images to APASS-catalog based magnitudes.
TABLE 1 GAIA DR2 ASTROMETRIC COORDINATES (J2000)*
| FOV ID |
GSC ID | R.A. h m s |
Dec. deg m s |
APASSa V-mag |
APASSa (B-V) |
| T | 1442-01358 | 12 13 40.7799 | +17 14 37.811 | 11.982 | 0.279 |
| 1 | 1442-02386 | 12 14 19.7713 | +17 11 46.075 | 10.754 | 0.791 |
| 2 | 1442-00715 | 12 13 49.2064 | +17 05 34.357 | 13.375 | 0.410 |
| 3 | 1442-00175 | 12 15 02.7262 | +17 10 18.301 | 13.073 | 0.708 |
* V-mag and color indices (B-V ) for PT Com (GSC 1442-01358) and three comparison stars (1-3).
aV-mag and (B-V ) derived from APASS DR9 database.
3. RESULTS
Photometric values in B (n=304), V (n=305), and I c (n=301) passbands were each processed to produce LCs that encompassed 25Mar2019 through 09April2019 (Figure 2). Times-of-maximum (ToMx) and associated errors were calculated according to Andrych & Andronov (2019) and Andrych et al. (2020) using the program MAVKA (https://uavso.org.ua/mavka/). Simulation of extrema was automatically optimized by finding the most precise degree (α) and best fit algebraic polynomial expression. This procedure, along with eight additional methods featured in MAVKA, are also well suited for other variable star LCs with symmetric or asymmetric extrema. Fundamental pulsation timing differences (PTD) vs. epoch were fit using scaled LevenbergMarquardt algorithms (QtiPlot 0.9.9 − rc9; https: //www.qtiplot.com/). Photometric uncertainty was calculated according to the so-called “CCD Equation” (Mortara & Fowler 1981; Howell 2006). During each imaging session brightness uncertainty typically stayed within ±0.006 mag for all three passbands. All relevant lightcurve data (HJD, APASS magnitude, err, filter) acquired during this study at DBO can be retrieved from the AAVSO archives (https://www.aavso.org/data-download). The sum total of all ToMx values included 30 from the literature (Wunder 2012; Wils et al. 2014), 12 acquired at DBO, 5 determined from V -mag LCs archived at the British Astronomical Association (BAA) website (https://britastro.org/photdb/data.php) and 18 derived from V-mag light curve data downloaded from the AAVSO VSX archives (https://www.aavso.org/ data-download). These results, which appear in Table 2, were used to evaluate possible changes in the fundamental pulse period. In this case, the relationship between PTD and cycle number can be described by a straight line relationship (Figure 3) from which a new linear ephemeris was calculated (equation 1):
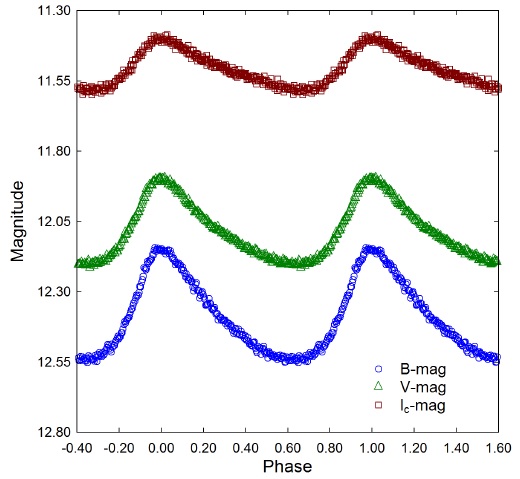
Fig. 2 Period folded (0.082112 ±0.000001 d) LCs for PT Com produced from photometric data obtained between 25Mar2019 and 09April2019 at DBO. LCs shown at the top (Ic), middle (V) and bottom (B) represent catalog-based (APASS) magnitudes determined using MPO Canopus. The color figure can be viewed online.
TABLE 2 PT COM: ToMx, MEASUREMENT UNCERTAINTY, EPOCH, PTD*
| ToMx (HJD-2400000) |
Err | Cycle No. |
PTD. | Ref. | ToMx (HJD-2400000) |
Err | Cycle No. |
PTD. | Ref. |
| 51315.9736 | nr | -97129 | -0.0004 | 1 | 58173.4359 | 0.0003 | -13616 | 0.0018 | 4 |
| 51543.9968 | nr | -94352 | -0.0036 | 1 | 58173.5152 | 0.0001 | -13615 | -0.0010 | 4 |
| 51617.9821 | nr | -93451 | -0.0016 | 1 | 58174.4189 | 0.0007 | -13604 | -0.0005 | 4 |
| 52638.0710 | nr | -81028 | 0.0039 | 1 | 58174.5014 | 0.0005 | -13603 | -0.0002 | 4 |
| 53740.0178 | nr | -67608 | 0.0011 | 1 | 58176.4722 | 0.0006 | -13579 | -0.0001 | 4 |
| 54204.8604 | nr | -61947 | 0.0049 | 1 | 58176.5539 | 0.0009 | -13578 | -0.0005 | 4 |
| 54867.8317 | nr | -53873 | -0.0001 | 1 | 58177.4557 | 0.0010 | -13567 | -0.0019 | 4 |
| 54878.0105 | nr | -53749 | -0.0032 | 1 | 58177.5410 | 0.0003 | -13566 | 0.0013 | 4 |
| 54886.8852 | nr | -53641 | 0.0034 | 1 | 58197.4102 | 0.0005 | -13324 | -0.0007 | 4 |
| 55185.0275 | nr | -50010 | -0.0047 | 1 | 58197.4928 | 0.0010 | -13323 | -0.0003 | 4 |
| 55209.0082 | nr | -49718 | -0.0009 | 1 | 58204.3900 | 0.0005 | -13239 | -0.0005 | 4 |
| 55268.8637 | nr | -48989 | -0.0054 | 1 | 58204.4717 | 0.0006 | -13238 | -0.0009 | 4 |
| 55276.8340 | nr | -48892 | 0.0001 | 1 | 58462.7156 | 0.0006 | -10093 | -0.0008 | 4 |
| 55290.7106 | nr | -48723 | -0.0004 | 1 | 58528.4882 | 0.0011 | -9292 | -0.0003 | 4 |
| 55336.6942 | nr | -48163 | 0.0002 | 1 | 58529.6386 | 0.0003 | -9278 | 0.0006 | 3 |
| 55358.7005 | nr | -47895 | 0.0004 | 1 | 58529.7222 | 0.0004 | -9277 | 0.0020 | 3 |
| 55576.9530 | nr | -45237 | -0.0021 | 1 | 58532.5111 | 0.0001 | -9243 | -0.0009 | 4 |
| 55615.9575 | nr | -44762 | -0.0011 | 1 | 58567.7378 | 0.0001 | -8814 | -0.0005 | 5 |
| 55681.8179 | nr | -43960 | 0.0051 | 1 | 58567.8195 | 0.0003 | -8813 | -0.0008 | 5 |
| 55959.8484 | nr | -40574 | 0.0027 | 1 | 58567.9022 | 0.0002 | -8812 | -0.0003 | 5 |
| 55975.9468 | nr | -40378 | 0.0071 | 1 | 58571.6788 | 0.0001 | -8766 | -0.0008 | 5 |
| 55988.8347 | nr | -40221 | 0.0033 | 1 | 58571.7618 | 0.0001 | -8765 | 0.0001 | 5 |
| 56035.7996 | nr | -39649 | -0.0001 | 1 | 58571.8430 | 0.0002 | -8764 | -0.0009 | 5 |
| 56072.4203 | nr | -39203 | -0.0016 | 1 | 58571.9255 | 0.0002 | -8763 | -0.0005 | 5 |
| 56073.4062 | nr | -39191 | -0.0010 | 1 | 58573.7323 | 0.0001 | -8741 | -0.0002 | 5 |
| 56075.3756 | nr | -39167 | -0.0023 | 1 | 58573.8143 | 0.0001 | -8740 | -0.0003 | 5 |
| 56075.4602 | nr | -39166 | 0.0002 | 1 | 58573.8969 | 0.0001 | -8739 | 0.0003 | 5 |
| 56076.4441 | nr | -39154 | -0.0013 | 1 | 58582.7641 | 0.0002 | -8631 | -0.0007 | 5 |
| 56354.8875 | 0.0004 | -35763 | -0.0013 | 2 | 58582.8465 | 0.0002 | -8630 | -0.0004 | 5 |
| 56358.8290 | 0.0006 | -35715 | -0.0012 | 2 | 58587.4455 | 0.0013 | -8574 | 0.0002 | 4 |
| 56721.6072 | 0.0003 | -31297 | 0.0040 | 3 | 59271.5245 | 0.0002 | -243 | 0.0001 | 3 |
| 58171.4657 | 0.0005 | -13640 | 0.0023 | 4 | 59291.4786 | 0.0002 | 0 | 0.0007 | 3 |
| 58171.5463 | 0.0004 | -13639 | 0.0008 | 4 |
*ToMx: Times of maximum.
PTD: fundamental pulsation timing differences used to calculate a linear ephemeris.
nr=not reported.
1. Wunder (2012); 2 Wils et al. (2014); 3 BAA; 4. AAVSO; 5. This study at DBO.
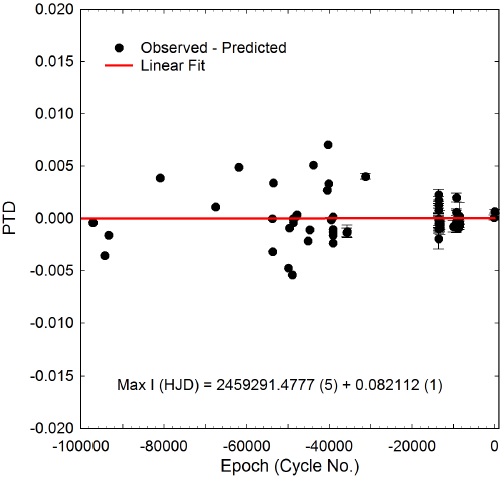
Fig. 3 Straight line fit (PTD vs. cycle number) suggesting that little or no change to the fundamental pulsation period of PT Com had occurred between 1999 and 2021. The color figure can be viewed online.
These results suggest that fundamental pulsation period has probably not changed since 1999. Furthermore period folded LCs from ASAS-SN photometric data acquired between 2013 and 2018 were very closely matched to V -mag LCs observed in 2019 at DBO (Figure 4). This would suggest the pulsation amplitude has also remained constant since at least 2013.
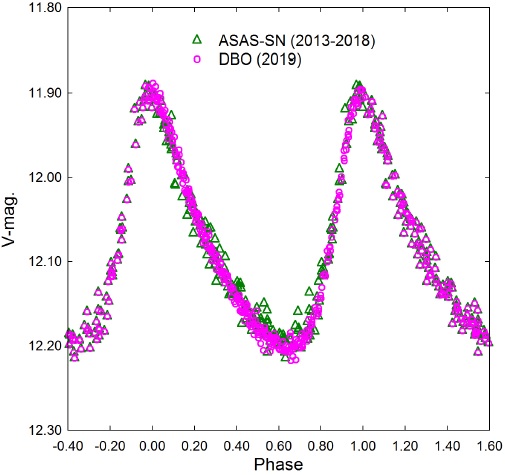
Fig. 4 Period folded (0.082113 ±0.000008 d) LCs for PT Com produced from photometric data obtained between 2013 and 2018 (ASAS-SN) and in 2019 at DBO. The color figure can be viewed online.
3.1. Light Curve Behavior
Morphologically, LCs from HADS variables are asymmetrical with a rapid increase in brightness producing a sharply defined maximum peak. Thereafter a slower decline in magnitude results in a broad minimum. The largest difference between maximum and minimum light is observed in the blue passband (∆B =0.39 mag), followed by V (∆V=0.27 mag) and finally the smallest difference detected in infrared (∆Ic=0.18 mag). Plotting (B-V)0 against phase (Figure 5) shows significant color amplitude (0.11 mag) going from maximum [(B-V )'0.20] to minimum light [(B-V )'0.31]. This behavior is commonly observed with pulsating F- to A-type stars.
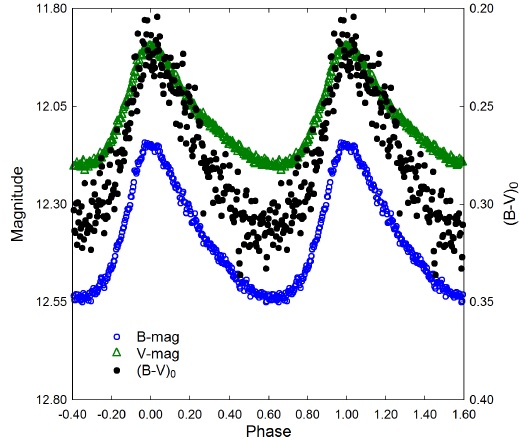
Fig. 5 PT Com LC illustrating significant color change as maximum light [(B-V )0'0.20 mag.] slowly descends to minimum light [(B-V )0'0.31 mag.]. The color figure can be viewed online.
Interstellar extinction was estimated according to Amôres & Lépine (2005)
4 which requires galactic coordinates (l, b) and distance (kpc). Accordingly, the Model A reddening value, E(B-V )=0.0270 ± 0.0001 mag, corresponds to an intrinsic color index (B-V )0 for PT Com that varies between 0.194±0.024 at maximum light and 0.309± 0.016 mag at minimum brightness. The average effective temperature (T
eff) was estimated to be 7473 ± 157 K according to the polynomial transformation equations derived by Flower (1996). These results based strictly on (B-V ) photometry at DBO are somewhat lower but within the uncertainty included
3.2. Lightcurve Analysis by Discrete Fourier Transformation
Discrete Fourier transformation (DFT) was used to extract the fundamental pulsating frequency (spectral window = 100 d−1) using Period04 (Lenz & Breger 2005). Pre-whitening steps which successively remove the previous most intense signals were employed to extract other potential oscillations from the residuals. Only those frequencies with a S/N≥6 (Baran et al. 2015) in each passband are presented in Table 3. In all cases, uncertainties in frequency, amplitude, and phase were estimated by the Monte Carlo simulation (n=400) routine featured in Period04. Representative amplitude spectra from B-mag data acquired at DBO are shown in Figure 6. Since the oscillation frequencies obtained from V - and I c-bandpasses are essentially redundant, they are not provided herein. A representative DFT-derived model fit with residual error indicates a very good fit for LC (B-mag) data acquired on 29Mar2019 (Figure 7). The amplitude decay for PT Com appears to be exponential as a function of harmonic order (Figure 8) a behavior consistent with other HADS variables such as VX Hyd (Templeton et al. 2009), RR Gem (Jurcsik et al. 2005) and V460 And (Alton & Ste¸pien´ 2019).
TABLE 3 FUNDAMENTAL FREQUENCY (d−1) AND CORRESPONDING PARTIAL HARMONICS*
| Freq. (d−1) |
Freq. Err |
Amp. (mag) |
Amp. Err |
Phase | Phase Err |
Amp. S/N |
|
| f 0-B | 12.1786 | 0.0001 | 0.1768 | 0.0006 | 0.5225 | 0.0006 | 202.5 |
| f 0-V | 12.1782 | 0.0001 | 0.1349 | 0.0005 | 0.6903 | 0.0006 | 322.7 |
| f0-Ic | 12.1770 | 0.0004 | 0.0796 | 0.0010 | 0.5688 | 0.0026 | 81.0 |
| 2f 0-B | 24.3576 | 0.0004 | 0.0519 | 0.0007 | 0.4978 | 0.0021 | 49.2 |
| 2f 0-V | 24.3568 | 0.0004 | 0.0429 | 0.0005 | 0.7744 | 0.0019 | 102.1 |
| 2f 0-Ic | 24.3572 | 0.0411 | 0.0272 | 0.0062 | 0.0203 | 0.0557 | 33.7 |
| 3f 0-B | 36.5344 | 0.0011 | 0.0194 | 0.0007 | 0.4159 | 0.0056 | 20.9 |
| 3f 0-V | 36.5336 | 0.0814 | 0.0149 | 0.0021 | 0.4487 | 0.0635 | 23.1 |
| 3f 0-Ic | 36.5374 | 0.0043 | 0.0080 | 0.0009 | 0.6356 | 0.0259 | 9.7 |
| 4f 0-B | 48.7169 | 0.0043 | 0.0067 | 0.0018 | 0.7035 | 0.1571 | 7.2 |
| 4f 0-V | 48.7103 | 0.0036 | 0.0042 | 0.0005 | 0.1210 | 0.0196 | 7.2 |
* Detected following DFT analysis of time-series photometric data (BVI c) from PT Com.
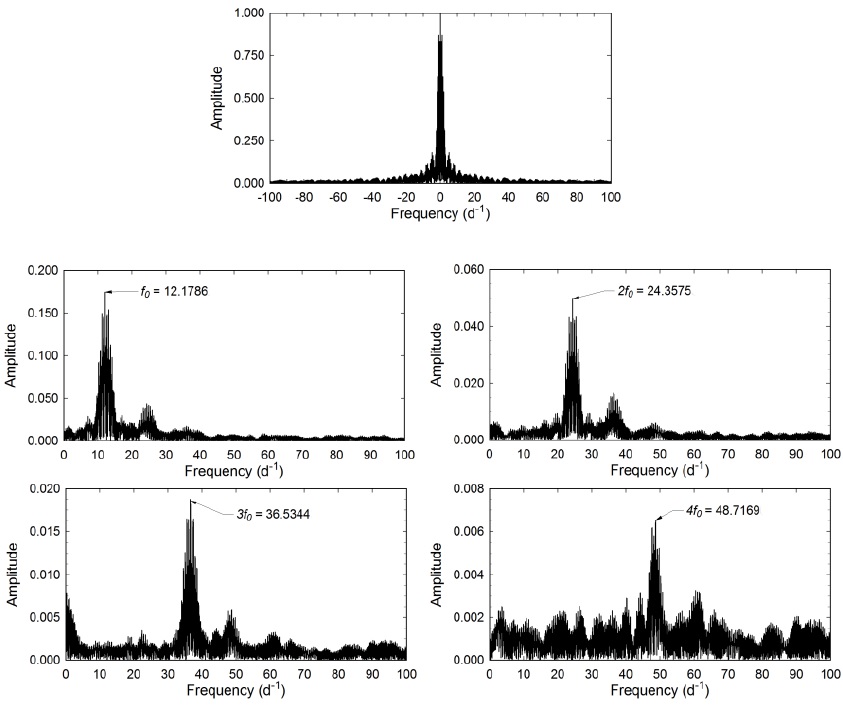
Fig. 6 Spectral window (top panel) and amplitude spectra (f 0, 2f 0, 3f 0 and 4f 0) showing all significant pulsation frequencies following DFT analysis of B-mag photometric data from PT Com acquired at DBO between 25 Mar 2019 and 09April2019.
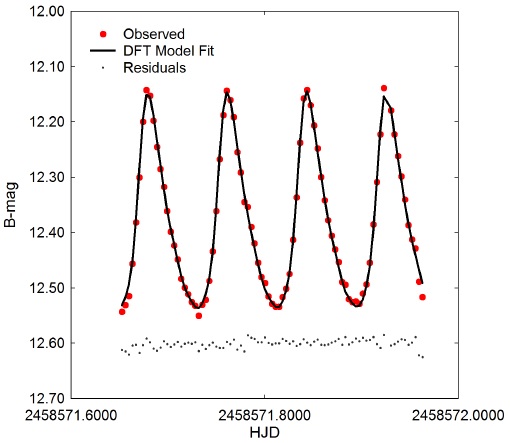
Fig. 7 DFT model fit from LC data (B-mag) acquired on 29 March 2019 at DBO. Residuals have been offset by a constant amount to compress the y-axis scale. The color figure can be viewed online.

3.3. Global Parameters
Ever since a period-luminosity relationship (PLR) between 25 Cepheid variables in the Small Magellanic Cloud was discovered (Leavitt & Pickering 1912), pulsating stars have served as standard candles for estimating cosmic distances to individual stars, clusters and galaxies. A new PLR (Ziaali et al. 2019) was adopted herein, which for the most part was established using the thus far most accurate distance values determined from parallax during the Gaia Mission (Lindegren et al. 2016; Luri et al. 2018). Accordingly this empirically-derived expression (equation 2):
is similar to the equation published by McNamara (2011) but with somewhat improved precision.
Absolute V mag (M V) was estimated (1.85 ±0.17) after substituting the fundamental pulsation period (0.082112 d) into equation 2. The reddening corrected distance modulus (equation 3):
produced an estimated distance (1062±83 pc) to PT Com using observed values for m (V
avg=12.065 ± 0.021) and A
V (0.0836 ±0.0003). By comparison, the Gaia DR2 parallax-derived distance (Bailer-Jones 2015) reported for this variable
The pulsation period and temperature/color were measured by direct observation. Similarly, the solar luminosity (13.86±2.15) was determined from equation 4:
when Mbol⊙=4.74, Mv=1.85±0.17 and BC= 0.034 then M bol∗ =1.89±0.17.
Photometric and spectroscopic observation of eclipsing binary stars are commonly used to determine component mass by applying the laws of gravity derived by Isaac Newton and Johannes Keppler. In contrast, the mass of an isolated field star like PT Com is very difficult to determine by direct measurement. However, it is possible under certain conditions (1.05 < M⊙≤ 2.40) to estimate mass according to Eker et al. (2018), who derived a mass-luminosity relationship from main sequence (MS) stars in detached binary systems. This expression (equation 5):
leads to its mass in solar units (1.85 ±0.7 M⊙) Fairly typical for a HADS variable, this result and all others derived from DBO data are summarized in Table 4. Finally, the radius in solar units (R ∗= 2.23 ±0.17) was estimated using the well-known relationship (equation 6):
TABLE 4 GLOBAL STELLAR PARAMETERS FOR PT COM*
| Parameter | DBO | PARSEC (Z=0.020) |
| Mean T eff [K] | 7451 ± 186 | 7451 ± 186 |
| Luminosity [L ⊙] | 13.86±2.15 | 13.86±2.15 |
| Mass [M ⊙] | 1.85 ± 0.07 | 1.79 ± 0.05 |
| Radius [R ⊙] | 2.23 ± 0.17 | 2.23 ± 0.03 |
| ρ [g/cm3] | 0.236 ± 0.055 | 0.228 ± 0.011 |
| logg [cgs] | 4.011 ± 0.067 | 3.994 ± 0.017 |
| Q [d] | 0.034 ± 0.003 | 0.033 ± 0.002 |
*Using values reported from observations at DBO and those predicted from evolutionary modelling.
Derived values for density (ρ ⊙), surface gravity (log g), and pulsation constant (Q) are also included in Table 4. Stellar density (ρ ∗) in solar units (g/cm3) was calculated according to equation 7:
where G is the cgs gravitational constant, m ⊙=solar mass (g) r ⊙ =solar radius (cm), M ∗ is the mass and R ∗ the radius of PT Com in solar units. Using the same algebraic assignments, surface gravity (log g) was determined by the following expression (equation 8):
The dynamical time that it takes a p-mode acoustic wave to internally traverse a star is strongly correlated to the stellar mean density. The pulsation constant (Q) is defined by the period-density relationship (equation 9):
where P is the pulsation period (d) and
The full derivation of this expression can be found in Breger (1990). The resulting Q values provided in Table 4 are within the expected value (Q=0.030.04 d) from fundamental radial pulsations observed for other δ Sct variables (Breger & Bregman 1975; Breger 1979; Joshi & Joshi et al. 2015; Antonello & Pastori 2005).
Finally, a comparative sense of how the physical size, temperature and brightness of PT Com changes over the duration of a single 1.97 hr pulsation can be estimated. As shown in Figure 4 there is a significant increase in reddening (B-V ) as maximum light descends to minimum light. Intrinsic color reveals that at maximum light, where (B-V )0= 0.194 ±0.024, the corresponding effective temperature is 7802 ±143 K, whereas at minimum light ((B-V )0= 0.309 ±0.016) the estimated effective temperature is 7170 ±84 K. Between these two extremes the putative rise in temperature (+632 K) would correspond to a 1.3-fold increase in luminosity despite an 8% decrease in surface area (∆R ⊙=3.9%). This inferred estimate for measuring changes in the angular diameter during each pulsation cycle might best be performed with a modern adaptation of the Baade-Wesselink method (Wesselink 1946) using optical interferometers 5.
4. EVOLUTIONARY STATUS OF PT COM
The evolutionary status of PT Com was evaluated (Figure 9) using the PAdova & TRieste Stellar Evolution Code (PARSEC) for stellar tracks and isochrones (Bressan et al. 2012) and then plotted (logT eff vs. log(L/L ⊙) in a theoretical Hertzsprung-Russell diagram (HRD). The thick solid maroon-colored line defines the zero-age main sequence (ZAMS) position for stars with metallicity Z=0.020. The two broken lines nearly perpendicular to the ZAMS delimit the blue (left) and red (right) edges of the theoretical instability strip for radial low-p modes (Xiong et al. 2016). Also included are the positions of several known HADS and SX Phetype variables (Balona 2018). The solid black circle indicates the position of PT Com using the DBO derived parameters (T eff and L ʘ) provided in Table 4.
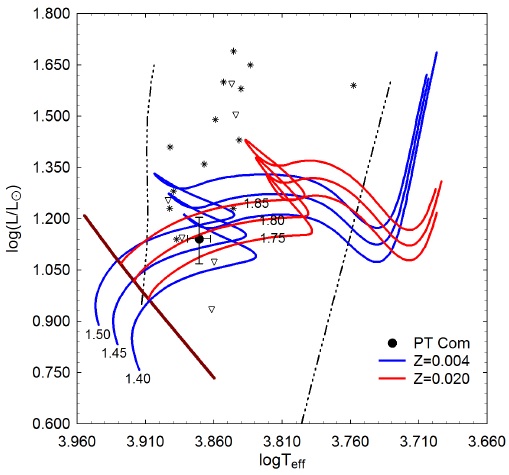
Fig. 9 Evolutionary tracks (red lines; Z=0.020 and blue lines; Z=0.004) derived from PARSEC models (Bressan et al. 2012) showing the position of PT Com (black filled circle) relative to ZAMS (thick maroon line) and within the theoretical instability strip (black dashed lines) for low-order radial mode δ Scutipulsators. The positions of other HADS (*) and SX Phe (open triangle) variables reported by Balona (2018) are included for comparison. The color figure can be viewed online.
Ironically a single undisputed value for metallicity from the star closest to us remains elusive. Over the last few decades, the reference metallicity values used by several authors for computing stellar models have ranged between Z=0.012 and 0.020 (Amard et al. 2019). Serenelli et al. (2016) took great exception to a high solar metallicity value (Z=0.0196±0.0014) based on in situ measurements of the solar wind (von Steiger & Zurbuchen 2016; Vagnozzi et al. 2017) rather than abundance traditionally determined by spectroscopic analysis. Despite the uncertainty in defining an absolute value for Z, an estimate for metal abundance is still required in order to determine the mass, radius and age of PT Com from theoretical evolutionary tracks. A Z-value can be estimated indirectly from its Galactic coordinates. According to the following expression (equation 11):
the distance below or above the Galactic plane can be calculated where d is distance in pc (1108) and b is the Galactic latitude (76.8169◦) of PT Com. In this case its position ≈1078 pc above the Galactic plane suggests residence in the thick disc (Li & Zhao 2017) rather than the halo where many metal poor ([Fe/H]<-1.6) stars like SX Phe-type variables reside (Carollo et al. 2010). Furthermore, Qian et al. (2018) reports an empirical relationship between metallicity ([Fe/H]) and the fundamental pulsation period P for an NDST star according to the following (equation 12):
As expected for a thick disk resident, the predicted value ([Fe/H]=-0.045 ±0.033) suggests that PT Com approaches solar metallicity, or at most a few times lower.
Two separate PARSEC evolutionary models (Bressan et al. 2012) ranging in age between 1×10⁸ and 2.21×10⁹ y are illustrated in Figure 9. The red solid lines show the model tracks (M ⊙=1.75, 1.80 and 1.85) over time when Z = 0.020 while the solid blue lines define the metal-poor models (M ⊙ =1.40, 1.45 and 1.50) where Z = 0.004. The latter simulations correspond to a decrease in metallicity by a factor of 3 to 5 depending on the reference solar metallicity. Assuming Z = 0.020, it can be shown by linear extrapolation that PT Com would have a mass of 1.79 ±0.05 M ⊙ and a radius of 2.23±0.03 R ⊙. The position of this intrinsic variable near the M ⊙=1.80 evolutionary track extrapolates to an age of 1.04±0.002 Gyr suggesting it is a moderately evolved MS object lying amongst other HADS variables closer to the blue edge of the instability strip.
By comparison, if PT Com is more metal deficient (Z=0.004), then it would have a somewhat greater radius (2.61 ± 0.07 R ⊙), but would be less massive (1.47 M ⊙). Its position closest to the 1.45 M ⊙ track lies prior to the HRD region where evolutionary tracks of low metallicity stars begin stellar contraction near the end of core hydrogen burning. This star would still be a MS object but with an age approaching 2.13±01 Gyr. It should be noted that the theoretical mass (1.79 M ⊙) where Z=0.020 favors the higher metallicity of PT Com is also in good agreement with results (1.85±0.07 M ⊙ independently determined using an empirical massluminosity relationship. If or when high resolution spectroscopic data become available in the future, uncertainty about the mass and metallicity of PT Com will likely improve.
5. CONCLUSIONS
This first multi-bandpass (BV I c) CCD study of PT Com has produced 35 new times-of-maximum. Secular analysis of the ToMx residuals suggests that the fundamental pulsation period has not changed since 1999. Deconvolution of time-series photometric data by discrete Fourier transformation shows that this star is a monoperiodic radial pulsator (f 0=12.1783 d−1) which also oscillates in at least 3 other partial harmonics (2f 0, 3f 0 and 4f 0). It is conceivable that a more expansive dataset collected at multiple sites over a much longer period of time could reveal other oscillation modes that were not detected in this study. A mean effective temperature for PT Com (7451 ±186 K) was estimated from a composite of Gaia DR2, 2MASS, LAMOST DR5 and DBO results, which likely corresponds to spectral type A7-A8. The pulsation period (≈0.082112 d), radial oscillation mode, V mag amplitude (0.30 mag), spectral type and LC morphology are all consistent with the traditionally defined characteristics of a HADS variable. It should be noted that these attributes do not necessarily exclude the possibility that PT Com is a field SX Phe-type variable. However, the generally accepted threshold for SX Phe stars is <1.3M ⊙ (McNamara 2011) which in this case is far less than the mass predicted from a M-L relationship (≈1.85 M ⊙) and evolutionary modeling (1.79±0.05 M ⊙). Given these results, the weight of evidence confirms the classification of PT Com as a HADS variable.

