


 nova página do texto(beta)
 Inglês (pdf)
 Artigo em XML
 Referências do artigo
 Enviar este artigo por email
 Citado por SciELO
  Similares em
SciELO
Similares em
SciELO 
 Permalink
1 Introduction
Since the detection of the novel coronavirus SARS-CoV 2 we have seen it grow to become a pandemic [7]. Studding epidemic origins, worldwide dispersal and epidemiological history is critical for decision making and issuing accurate information to the population.
SEIR models are among the widely used approaches to study infectious diseases [1,17,20]. SEIR models and its several variations, have many parameters that usually depends on geographical distributions, initial population and the specific diseases under study.
The combination of dynamical modelling with substantial fluctuations calls for data assimilation methods for parameter inference [4]. Hence, fitting the SEIR model parameters is a difficult task and at the same time of paramount importance.
Several recent studies aim to include restriction policies in the modelling SARS-CoV 2 epidemic. In [4], the authors estimate the per-capita transmission rate of a stochastic SEIR model based on available data. The per-capita transmission rate is considered a function of time that accounts for the application of restriction policies. This work only considers the best fitting parameters and neglects other possible explanations of currently observed data.
Other works have successfully modelled the application of restriction policies in a different way, for example, by including a compartment for patients in quarantine [21].
Other introduced models do not consider the application of restriction policies at all.
For example, the authors of [13] use a machine learning approach as an alternative to SEIR models producing accurate results as long as no significant interruption occurs, such as, the application restriction policies. It is worth noticing that the accuracy of such models is evaluated in a time interval of nine days, hence, no empirical results suggest long time accuracy.
From a different perspective, some authors have successfully used meta-heuristic algorithms to fit SEIR model parameters. In a work by Mulder, the Simulated Annealing algorithm is used to fit SEIR model parameters using active infected and recovered time series [12]. It only considers the best fitting parameters and does not consider other possible explanations of currently observed data and does not study the effect of restriction policies in the epidemic development. In [14], the Particle Swarm Optimization algorithm is used to fit SEIR model parameters. This work does not address the possibility of multiple explanations of currently observed data nor study the effect of restriction policies in the epidemic development.
Recently, Rajiv Chowdhury et al. conducted a scenario analysis of SARS-CoV 2 coronavirus in more than 16 countries [2]. They used the most up-to-date SEIR transmission parameters to construct their adaptive models from previous works, hence, analyses were based on several transmission parameter assumptions. In such work, authors assumed a constant transmission rate during each modeled cycle, which is likely to vary by a population's adherence to the restriction policies and a mix of specific measures put in place.
In this paper, we introduce an approach to find SEIR parameters that best explains the observed infected and recovered time series. Here, we refer to observed infected time series to the times series of active infected patients, that is, patients that are infected not yet recovered. In addition, we refer to observed recovered time series to the time series of patients that were infected at some point but are currently recovered.
We define a search space containing SEIR parameters and a fitness function that accounts for the error between the SEIR model forecasting and the observed times series: infected and recovered.
We provide intuition and previous experimental results behind our hypothesis that such fitness function is multi-modal with several local minima that accounts for different outcomes of the epidemic in the future. Here we use the terms SEIR model parameters, local minima and future possible outcomes indistinctly.
Our goal is not to find the global optimum of the fitness function, but to locate the local minima in the search space. In order to do so, we use a meta-heuristic optimization method named Firefly Algorithm (FA) [19]. Inspired in the social behavior of fireflies, FA keeps a set of solutions during the course of optimization. Previous, experimental results suggest that the solutions optimized by FA converges in clusters around local minima [16].
Here we focus on SARS-CoV 2 data from Cuba, Spain and Italy. Results show the formation of clusters of possible SEIR parameters around local minima. We sample the four best possible local minima according to its fitness value (how much each local minima fits current observed data) and its diversity (how much different is each local minima from the others). We ended up with four groups of SEIR model parameter sets that describes possible outcomes in the future and can be used by epidemiological specialists to take decisions and study the statistical distributions of the SEIR parameters.
Different to other works, our approach considers the application of restriction policies to reduce the per-capita transmission rate in different scenarios. The rate at which the restriction policies affect the model parameters are directly learned from the data without relying in parameter distributions from previous works. Secondly, as we use a meta-heuristic approach, the way we fit SEIR model parameters is expected to be robust to noise in the active infected and recovered time series. Finally, we are not considering a single best fitting of the SEIR model parameters, but several of them, which should provide wider insights on the epidemic development.
The organization of this paper is as follow: Section 2 formally introduces our approach for finding SEIR model parameters and describes the SEIR model used to fit current observed data and the FA meta-heuristic algorithm.
Section 3 shows the results of finding local minima in the SEIR parameter's space and the parameter distributions for the possible outcomes of the pandemic in the future. We discuss limitations and advantages of the introduced approach in Section 4.
2 Methods
In this section we introduce our approach for searching SEIR model parameters based on current active infected and recovered time series. In addition, we describe the SEIR model used to study the SARS-CoV 2 epidemic and for completeness we also describe FA optimization algorithm. Throughout this article we use x for scalars, x for vectors and X for sets.
2.1 Searching SEIR Model Parameters
Let
where
A valid option here would be to use multi-objective optimization and should be studied in the future. We are interesting in solving the following optimization problem:
Here we will only consider the case of
Finding the local minima in the SEIR parameter space, as defined in equation 2, can be rephrased as finding the most likely outcomes in the future that explain current observations. Algorithm 1 clarifies the steeps proposed in the present work to search and summarize such outcomes.
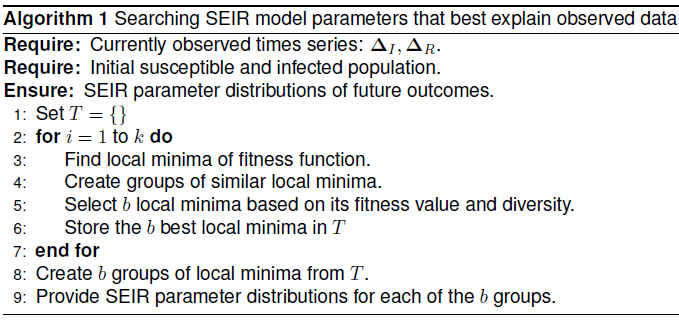
In step 1, we initialize the set of possible future outcomes T as empty. In step 3, we search for local minima in the SEIR parameter space and after this we create groups of similar local minima obtaining a representative sampling in step 4. We select the b best local minima based on its fitness value and diversity, storing them in the set of possible future outcomes T, steps 5-6. As the search of local minima is a non-deterministic stochastic process, we repeat the previously described steps a number k times. In step 8, we create b groups of local minima from T. In the following subsections we describe Algorithm 1 in detail.
2.1.1 Finding Local Minima of Fitness Function
In step 3, we must find the local minima of the fitness function. Considering the scenario of a multi-modal fitness function, gradient based optimization methods are discouraged as those are usually intended for local optimization [3], although, a local search method with restart may be an option here. Therefore, we focus in global optimization methods and specifically in meta-heuristic methods.
Meta-heuristic are approximate, stochastic search algorithms. Most population-based-meta-heuristics1 have been designed for global optimization. Meta-heuristic algorithms do not provide any warranty of convergence or optimality. However, we must consider that the current observed times series are actually a noisy measure of the real number of infected or recovered cases (for example: there are undetected cases). In such scenario, looking for an exact solution may be misleading.
Currently, there are several global optimization meta-heuristic algorithms based in populations in the literature. The FA algorithm is a nature inspired meta-heuristic that is based in populations and share some features with the more widely known Particle Swarm Optimization (PSO) meta-heuristic. In PSO, each solution explores the search space considering the position of the best solution found so far and the best previous position of each solution. However, in FA each solution explores the search space considering all solutions that have a better fitness value. This particular feature allows FA optimized solutions to converge in clusters near the local minima and not only in a single, possibly global optimum. For completeness, we provide a detailed description of FA algorithm in section 2.3.
2.1.2 Creating Groups of Similar Local Minima
In step 4, we take all the solutions optimized by FA algorithm, and remove redundant and very similar solutions that may have converged nearby. By doing this, we expect to reduce the number of local minima while keeping a representative sampling of the search space. In addition, having repeated or very similar local minima may artificially alter the statistical distributions of the SEIR model parameters. We propose to conduct an unsupervised clustering analysis and to take the final cluster centroids as future outcomes.
Here we face two possible approaches: hierarchical or agglomerative clustering analysis. Hierarchical analysis has the advantage of not requiring an initial pre-defined number of clusters to perform the analysis as opposed to agglomerative clustering. However, at the end in both cases we must manually select the number of clusters that better describe the data based in some inter/intra cluster measure. Here, we propose to consider K-Means algorithm to perform the clustering analysis and the Silhouette Coefficient (SC) to select the final number of clusters [22].
2.1.3 Selecting the Best Local Minima based on its Fitness Value and Diversity
In step 5, we select future outcomes based on its fitness function and diversity, that is, the cluster centroids provided by the K-Means algorithm. First, the selection is based in how well such centroids, that represent sets of parameters of the SEIR model, explains the current number of infected and recovered cases. The fitness function, as defined in equation 1, models how well a given set of SEIR model parameters fit current observed data.
Secondly, we want to select centroids that are different from each other, for example, two centroids may have a similar fitness value but are distant in the search space. This will allow to examine different future outcomes of the epidemic outbreak that may explain current trends. Given a sequence of centroids provided by the K-Means algorithm w1, w2, ..., wr, Algorithm 2 describes how the best local minima are selected based on its fitness value and diversity.
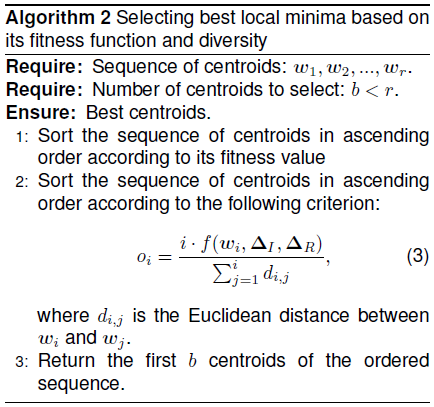
The centroids that best fit the infected and recovered time series are located at the beginning of the sequence in step 1. After this, in step 2, the sequence of centroids is re-ordered based not only on the fitness value of the centroids, but also based on how close they are in the search space.
The idea is to push back in the sequence centroids that are similar to the previous ones. This provides a chance to different future outcomes, that still explains current observed data, to be studied and analyzed. The equation 3 models this idea by dividing the centroid fitness value by the average Euclidean distance of each centroid with the previous ones in the sequence.
Here is critical to notice the balance between the fitness value and the diversity. The fitness value is of paramount importance (centroids that do not explain current observed data with accuracy are not useful) but diversity is required to avoid losing possible future outcomes of the epidemic.
2.1.4 Summarizing Future Outcomes
After running several times the FA optimization algorithm and having a set of future outcomes from the FA solutions in steps 3-6, we have a number of k • b local minima that represent future outcomes of the epidemic. The k • b local minima should represent, at least, the top b local minima in the search space that fit current observed data. In step 8, we use K-Means with a number of clusters equals to b to group the local minima stored in T. This should compensate the non-deterministic nature of FA algorithm and K-Means, providing statistical stability and confidence intervals for the SEIR model parameters. Finally, in step 9 we provide SEIR model parameter distribution for each future outcome based on the different centroids.
2.2 SEIR Model and Description of Scenarios
This section describes the SEIR model used in this work to study SARS-CoV 2. This SEIR model have four main compartments:
— Susceptible: population that can be infected.
— Exposed: population that has being exposed to the infection but cannot infect others yet.
— Infected: population that can infect others.
— Recovered: population that had the infection and do not infect others anymore.
The parameters of the model are the per-capita transmission rate, the exposed-to-infectious rate and the infectious-to-recovered rate. Each of these parameters describe how the population migrates from one compartment to another:
— Per-capita transmission rate (β): number of susceptible persons that are exposed per each infected person.
— Exposed-to-infectious rate (γ0): number of exposed persons that go to transmissible compartment.
— Infectious-to-recovered rate (γ1): number of infected persons that go to recovered compartment.
Each parameter is usually treated as a constant. However, in order to model restriction policies, we treat the per-capita transmission rate as a function of time
In order to narrow the possible values of β(t) to an interval already observed for SARS-CoV 2, we set the maximum value of this parameter to be
No-pharmacological preventing solutions are available for the control of COVID-19 pandemic. Thus, at present, the intervention politics are the best way to control the national and international expansion of this disease. Policies are mainly based on isolation and quarantine measures.
Isolation separates sick people with a contagious disease from people who are not sick. Quarantine2 separates and restricts the movement of people who were exposed to a contagious disease to see if they become sick. In most cases a combination of isolation and quarantine measures have been applied by governments.
In our study, we propose several scenarios in order to model real situations. We assume that the disease is present with a relative extension in the entity (country, state, province, city) and that isolation and/or quarantine measures have been taken. To define the scenarios, three states related to the applied politics were considered:
State A: Voluntary home quarantine for the majority of people, closure of schools, universities, majority of services, shopping and social distancing measures. At national level means partial or total closure of national borders (immigration is not an infection factor) and inside the country closure of state borders, province and/or county borders.
State B: It consists in a relaxation of the restriction politics mentioned in state A. For example: opening of public spaces with a limited number of people, opening of schools, universities and factories while keeping social distancing measures.
State C: Stricter polices with respect to state A are considered. For example, mandatory home quarantine for the majority of people, mandatory use of mask.
Considering these states, we are interested in modelling three scenarios: relaxing restriction policies at the current time and hardening such policies after some time, keeping restriction policies as they are currently implemented or with even more strict policies for as long as required and relaxing and hardening restriction policies.
1. Relaxing restriction policies at the current time and hardening such policies after some time. For this, we will model the per-capita transmission rate as a wave function of time:
where
Starting from state A, at t = 0 such state is kept until the current day, then, restriction policies are completely lifted. After that, an increase in the number of infected is expected and then a hardening policy will be applied again as in state A.
2. Keeping restriction policies as they are currently implemented or with even more strict policies for as long as required. In this scenario, we will model the per-capita transmission rate as an exponentially decreasing function of time similar to [5]:
where
This scenario involves in the transition from state A to state C (almost total quarantine for all the people). For this scenario, the per-capita transmission rate abruptly decreases in time. This scenario is very similar to that applied in Wuhan, Hubei, China. Here, is important to consider that the per-capita transmission rate will be adjusted to the specific country infected and recovered time series, hence, if no state C have been implemented during that time, the per-capita transmission rate will not reflect a decrease.
3. Relaxing and hardening restriction policies. Here, we will combine the previous two scenarios with a damped cosine wave, modelling restriction policies being relaxed and hardened as required. The per-capita transmission as a function of time can be defined as:
Considering such function we can define a search space with four continuous search parameters:
In this scenario, starting from state A, we move to state B and then back to state A again. As we move from state A to state B, a few relaxation of policies are applied but not all.
The dynamics of the SEIR model used in the present work can be described by the following equations. Let, N(t) = S(t) + E(t) + I(t) + J(t) + R(t) where S(t) is the number of susceptible patients, E(t) is the number of exposed patients, I(t) is the number of infected patients and R(t) is the number of recovered patients in time t:
1. Susceptible population: susceptible population diminishes in proportion to the per-capita transmission rate. As the susceptible population diminishes, also the rate S(t)/N(t) decreases as well:
2. Exposed population: exposed population increases in the same rate that the susceptible population decreases. When the decrease in susceptible population is significant, the exposed-to-infectious rate begins to dominate, making the exposed population start a decrease dynamic:
3. Infectious population: infectious population grows in the same rate that exposed population decreases. When the decrease in exposed population is significant, the infectious-to-recovered rate begins to dominate, making the infectious population start a decrease dynamic:
4. Recovered population: the recovered population grows in the same rate that infectious-to-recovered rate and the infectious population:
2.3 The Firefly Meta-Heuristic Algorithm
The FA is a meta-heuristic optimization algorithm introduced in 2009 inspired in the flashing behavior of fireflies [19]. When considering this algorithm, each candidate solution is represented by a firefly. The basic idea is that fireflies use their light to attract others of its kind. This way, the fireflies with stronger light, or fitness, will attract more than others. The equation to move a firefly i to a brighter one j is given by equation 11:
where di,j, as before, is the Euclidean distance between wi and wj.
In equation 11,
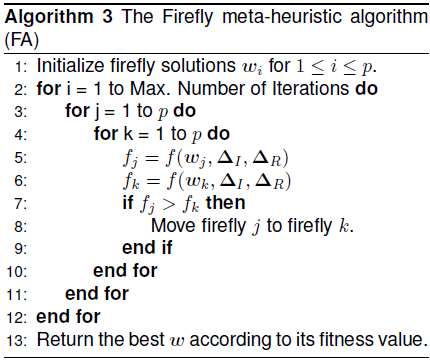
In step 1 of Algorithm 3, the SEIR model parameters, represented here by the concept of firefly solution, are initialized randomly using a uniform distribution. At each iteration, each firefly fitness is compared with the rest in step 7. In case that a firefly has more bright than another, the one with less bright is moved to the brighter in step 3. This makes that the solutions of this algorithm, do not move to the same, possibly global best solution, but to all solutions that have a better fitness value. This is essential in order to find several local minima in the search space and not only the global optimum, as optimized solutions usually form clusters around them [16].
3 Results
In this section we describe the data used in the present paper to analyze SARS-CoV 2 in Cuba, Spain and Italy. In addition, we present the results of finding SEIR model parameter distributions of possible future outcomes using the three scenarios explained in Section 2.2.
3.1 SARS-CoV 2 Data
SARS-CoV2 data was retrieved from the World Health Organization reports3. Using this data, we create a daily time series of the number of active infected and recovered patients. The start of the epidemic for each country is selected based in the apparition of the first cases, hence, the time series length is different for each country.
To optimize our SEIR model parameters we will use information of the first 50 days only. All data and source code for the experiments is provided publicly at Internet: https://github.com/ml-opt/cys-covid.
3.2 Searching the Set of Possible Outcomes
We use FA algorithm to find local minima in the SEIR parameter space, which corresponds to step 3 of Algorithm 1. FA algorithm hyper-parameters are selected based in the literature standard recommendations, that is:
Using the optimized FA solutions as points in
After this, we select the top b = 4 clusters based on its fitness value and diversity according to step 5 of Algorithm 1. We repeat the previously described steps 3-6 a number of k = 10 times. This is done for each of the three scenarios in Section 2.2.
3.3 Summarizing Possible Outcomes
We present the epidemiological development for each of the three scenarios described in section 2.2. We present an epidemic forecast of the number of infected patients for the first 500 days and information on how well such forecast fits observed infected and recovered cases.
In addition, we present the SEIR model parameter distributions for each scenario and how the per-capita transmission rate controls the epidemic outbreak.
3.3.1 Scenario 1 : Relaxing Restriction Policies at the Current Time and Hardening such Policies After some Time
In Figure 1, we show the number of active infected cases and the value of the per-capita transmission rate in the first 500 days of SARS-CoV 2 in Cuba, Spain and Italy. In the figure, we show the top b = 4 clusters found by Algorithm 1, denoted as A, B, C and D. The red area around the mean represents the standard error.
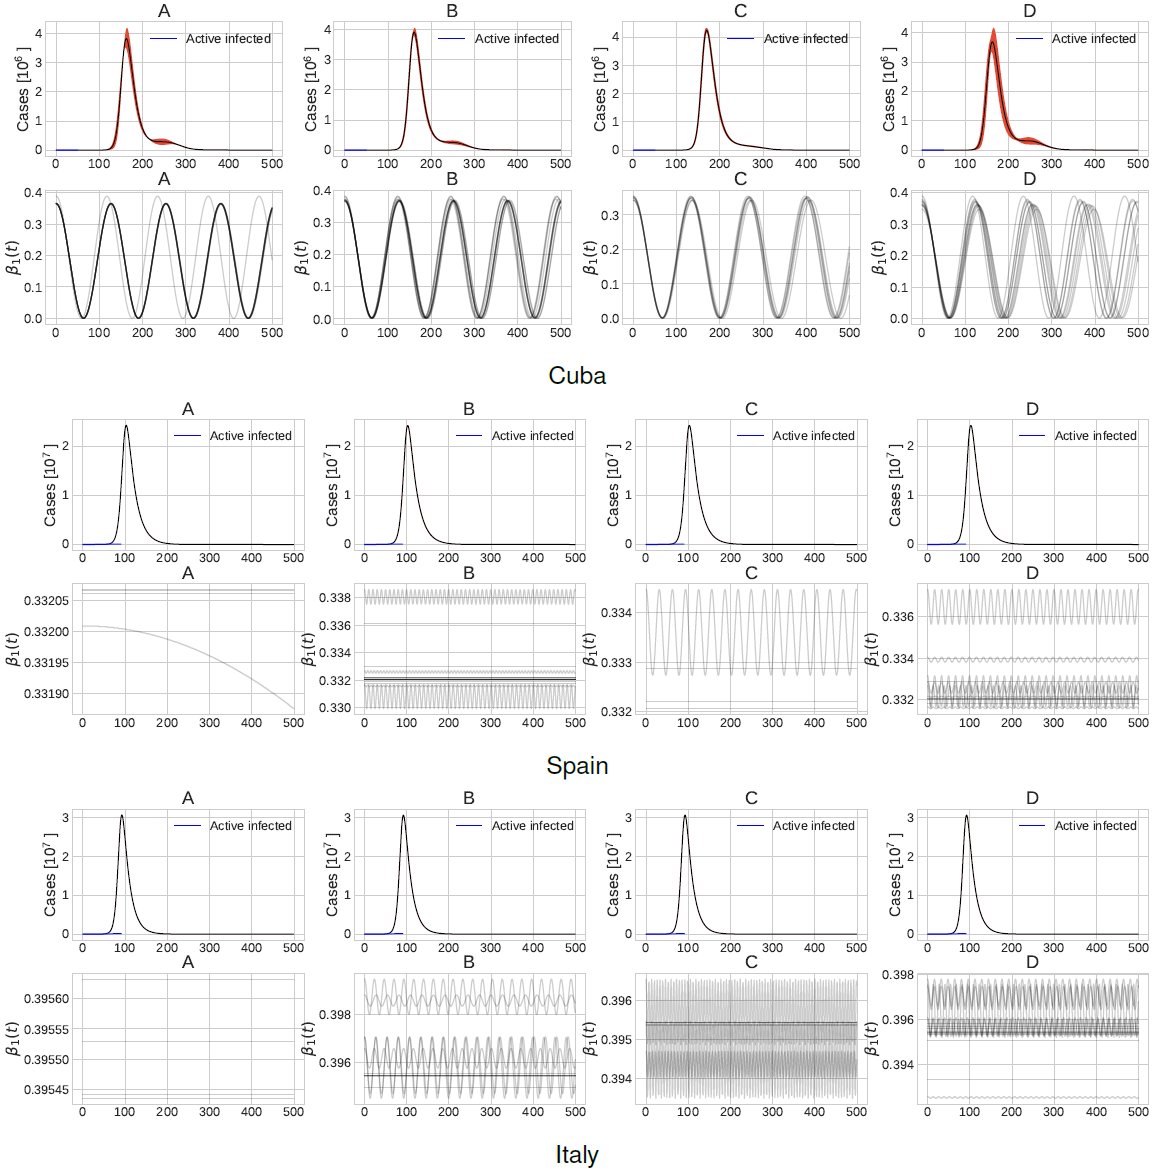
Fig. 1 Number of active infected patients and values of the per-capita transmission rate in the first 500 days corresponding to scenario 1. Plots A, B, C and D show clusters of different possible future outcomes
Figure 2 presents a zoom in the first 50 days of the active infected patients and recovered patients adding the current observed times series in blue lines.

Fig. 2 Active infected and recovered time series forecast and the current observed times series in blue corresponding to scenario 1. Plots A, B, C and D show clusters of different possible future outcomes
As before, the black line represents the mean of the local minima of each of the top 6 = 4 clusters, denoted as A, B, C and D.
In case of Cuba, the four possible outcomes show that the value of the per-capita transmission rate in the 50-th day was between 0.1 and 0.2.
Relaxing restriction policies in the 60-th to 80-th days, makes the number of active infected patients to raise to about four million. This even holds if the restriction policies are hardened in approximately the 120-th day. This exemplifies the extremely important fact of not relaxing restriction policies too much or too soon.
These findings are consistent with those in Hubei, China where lifting quarantine would have led to a second epidemic peak in March [20]. Moreover, notice that restriction policies are being lifted since the 60-th to 80-th day, but, we see an exponential increase in the active infected time series nearly in the 120-th day. This give us an important hint in how much caution we must have when relaxing restriction policies.
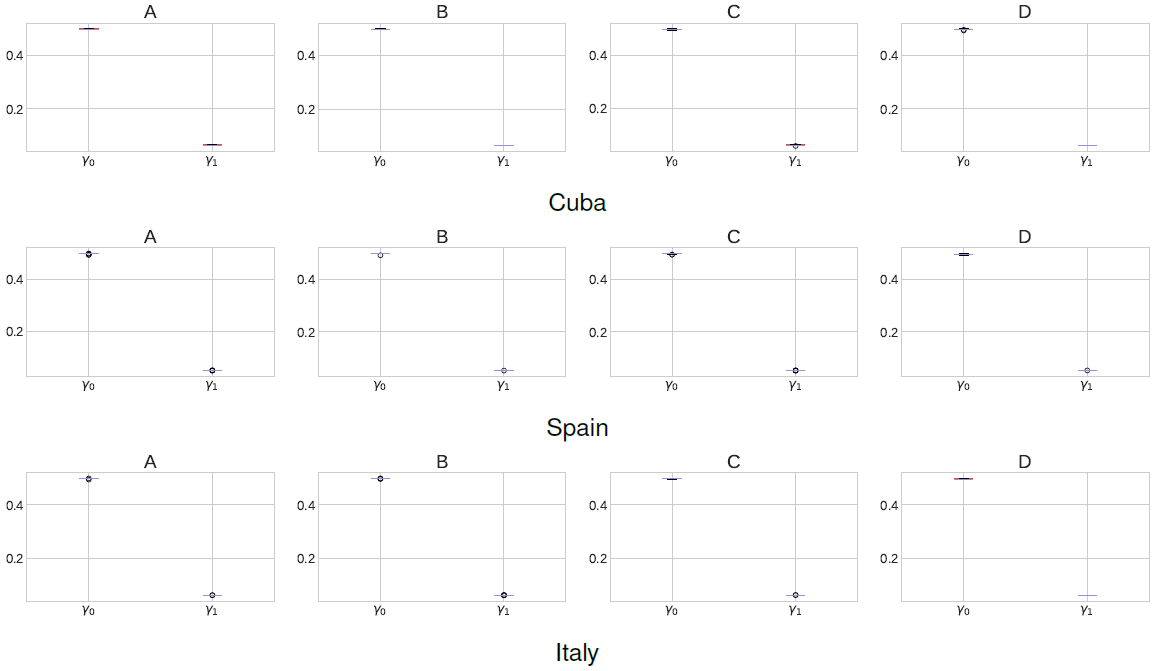
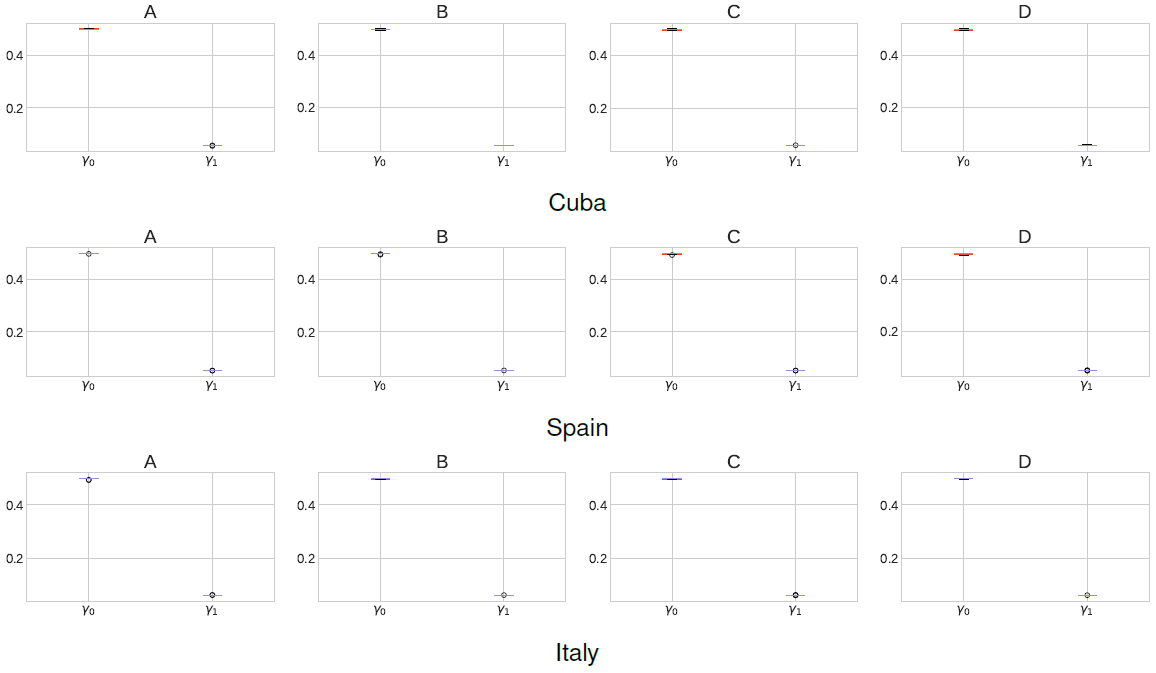
In case of Spain and Italy the values of the per-capita transmission rate are nearly constant in this period. This shows how the epidemic spread went without control during the first 50 days. Actually, in Spain the quarantine lockdown was applied in about day 45, hence, the per-capita transmission rate do not record any decrease in the first 50 days. This scenario is similar to the findings of [21] where under a regime without restriction policies, the peak of active infected cases is predicted to happen in the first 270-650 days representing about 10-20% of the total population. Figure 3 shows the SEIR model parameters distribution for each of the top b = 4 possible outcomes studied in the present work. The bottom and top lines in the box plots represents the first and third quartiles, the line in the middle represents the median of the measurements and the whiskers represents standard deviation. Notice how the values of γ0 and γ1 are similar across the different countries.

3.3.2 Scenario 2: Keeping Restriction Policies as they are Currently Implemented
Figure 4 shows the number of active infected cases in the first 500 days of SARS-CoV 2. The figure, as in the previous scenario, shows four possible outcomes of the epidemic. In the figure, we show that the per-capita transmission rate diminishes in the first days of the outbreak to a minimum and then the restriction policies are kept in time. Here is interesting to see how the predicted value of β2(t) keeps diminishing in time after day 50 in the case of Cuba. In the case of Spain and Italy, we again observe a nearly constant value for the per-capita transmission rate, which is consistent with the outcomes of the first scenario. Here is interesting to notice how scenario 1 and scenario 2 mostly agree on the per-capita transmission rate and number of infected cases before day 50 and depicts different outcomes for the future.
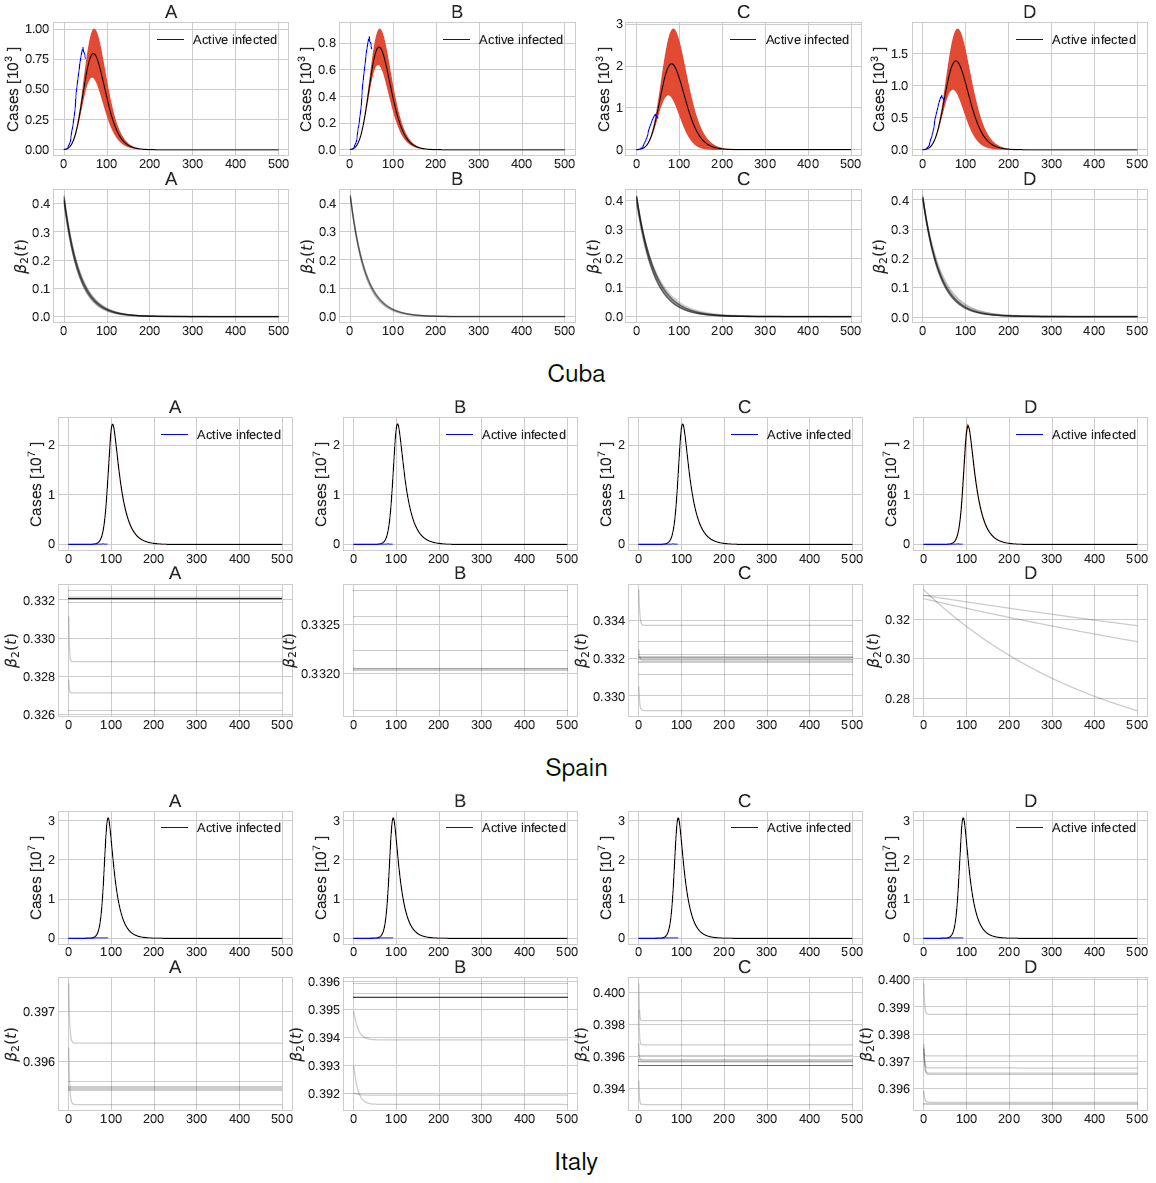
Fig. 4 Number of active infected patients and values of the per-capita transmission rate in the first 500 days corresponding to scenario 2. Plots A, B, C and D show clusters of different possible future outcomes
Figure 5 presents a zoom in the first 50 days of the active infected patients and recovered patients adding the current observed times series in blue lines. Furthermore, Figure 6 shows the SEIR model parameters distribution for each of the top b = 4 possible outcomes under consideration.
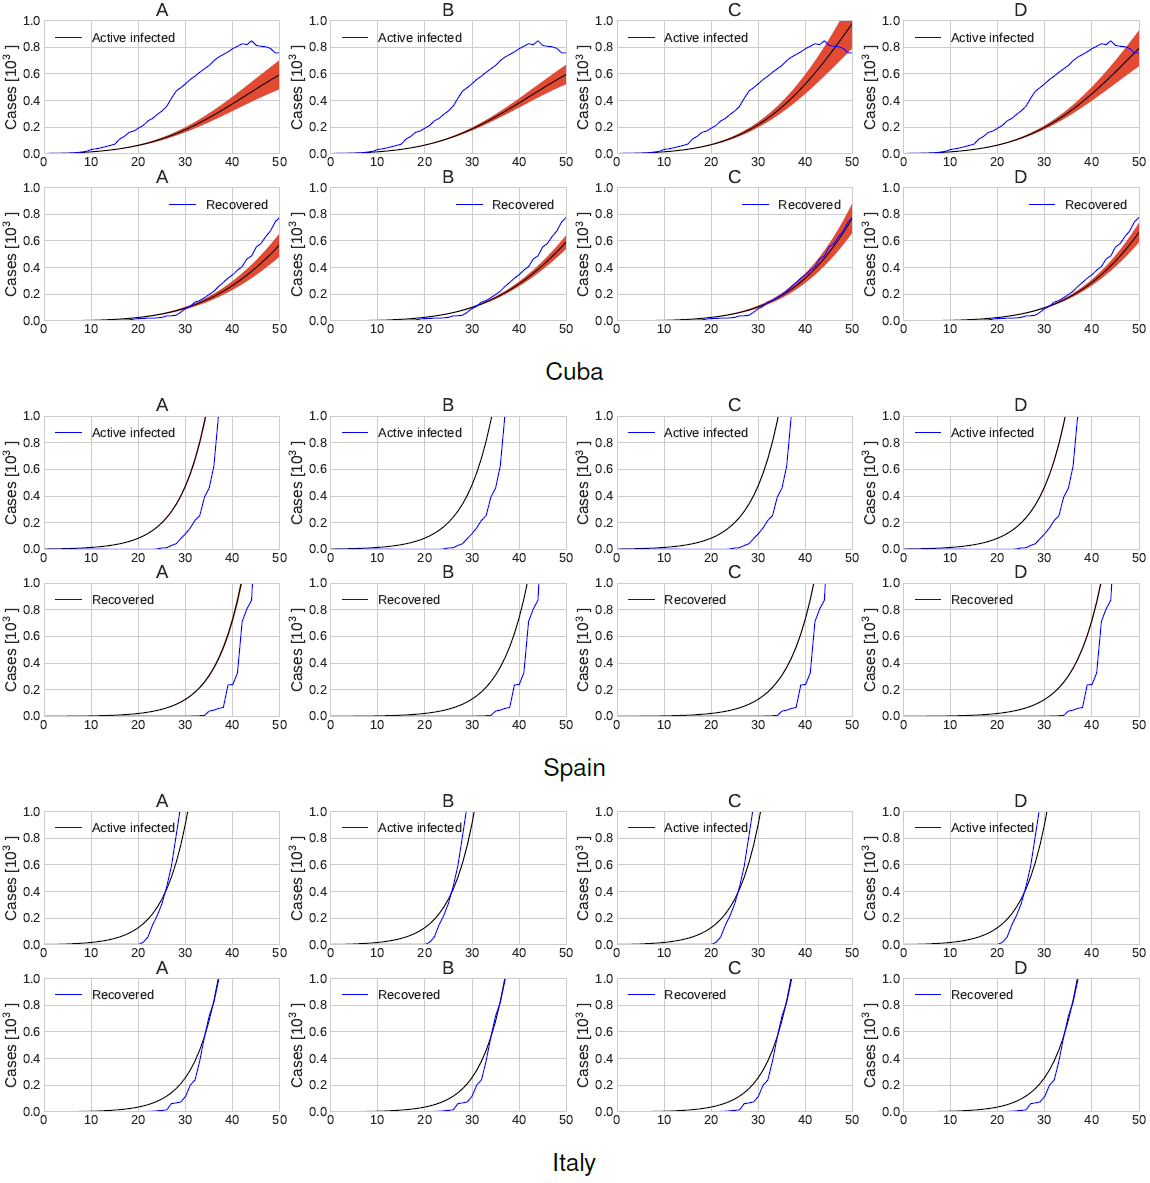
Fig. 5 Active infected and recovered time series forecast and the current observed times series in blue corresponding to scenario 2. Plots A, B, C and D show clusters of different possible future outcomes
3.3.3 Scenario 3: Relaxing and Hardening Restriction Policies as Required
Figure 7 shows the number of active infected cases in the first 500 days of SARS-CoV 2. As before, we present four possible outcomes of the epidemic development.
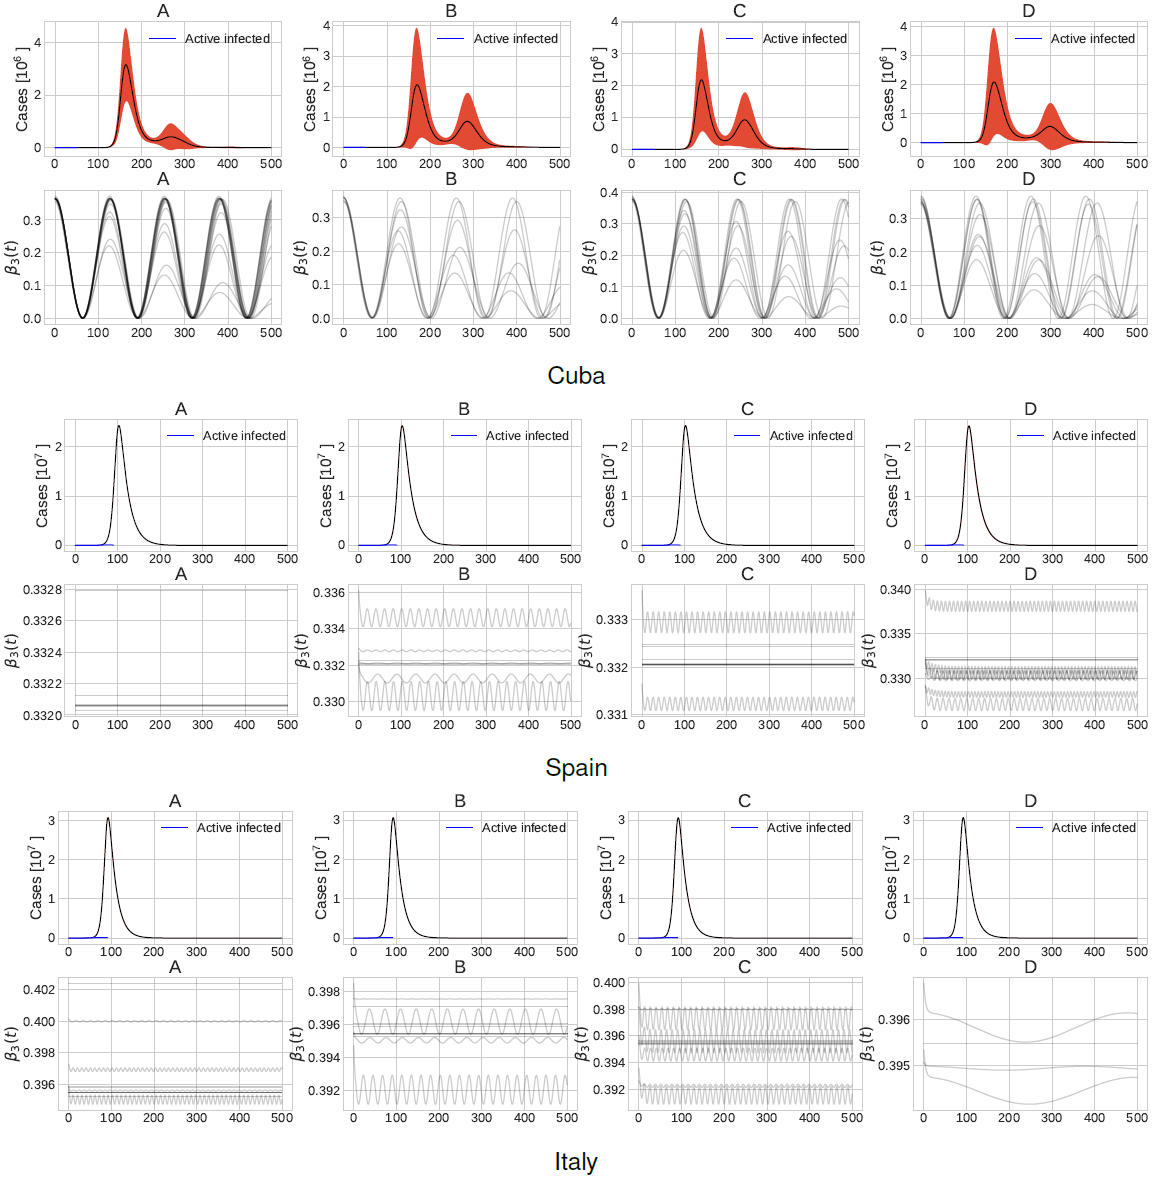
Fig. 7 Number of active infected patients and values of the per-capita transmission rate in the first 500 days corresponding to scenario 3. Plots A, B, C and D show clusters of different possible future outcomes
In the case of Cuba, it can be observed what would happen if the restriction policies are hardened and relaxed, but only partially. Notice that special care should be taken when relaxing restriction policies: if the restriction policies are relaxed too much, that would create a peak of infected cases, as can be confirmed from the first scenario. What we see now in scenario 3, is that a considerable peak can also happen, tough in a much smaller scale (take into account the error in the plot ranging from less than half million cases to four million cases).
Figure 8 presents a zoom in the first 50 days of the active infected patients and recovered patients adding the current observed times series in blue lines. As before, the black line represents the mean of the local minima of each of the top b = 4 clusters, denoted as A, B, C and D. The red area around the mean represents the standard error of the mean.
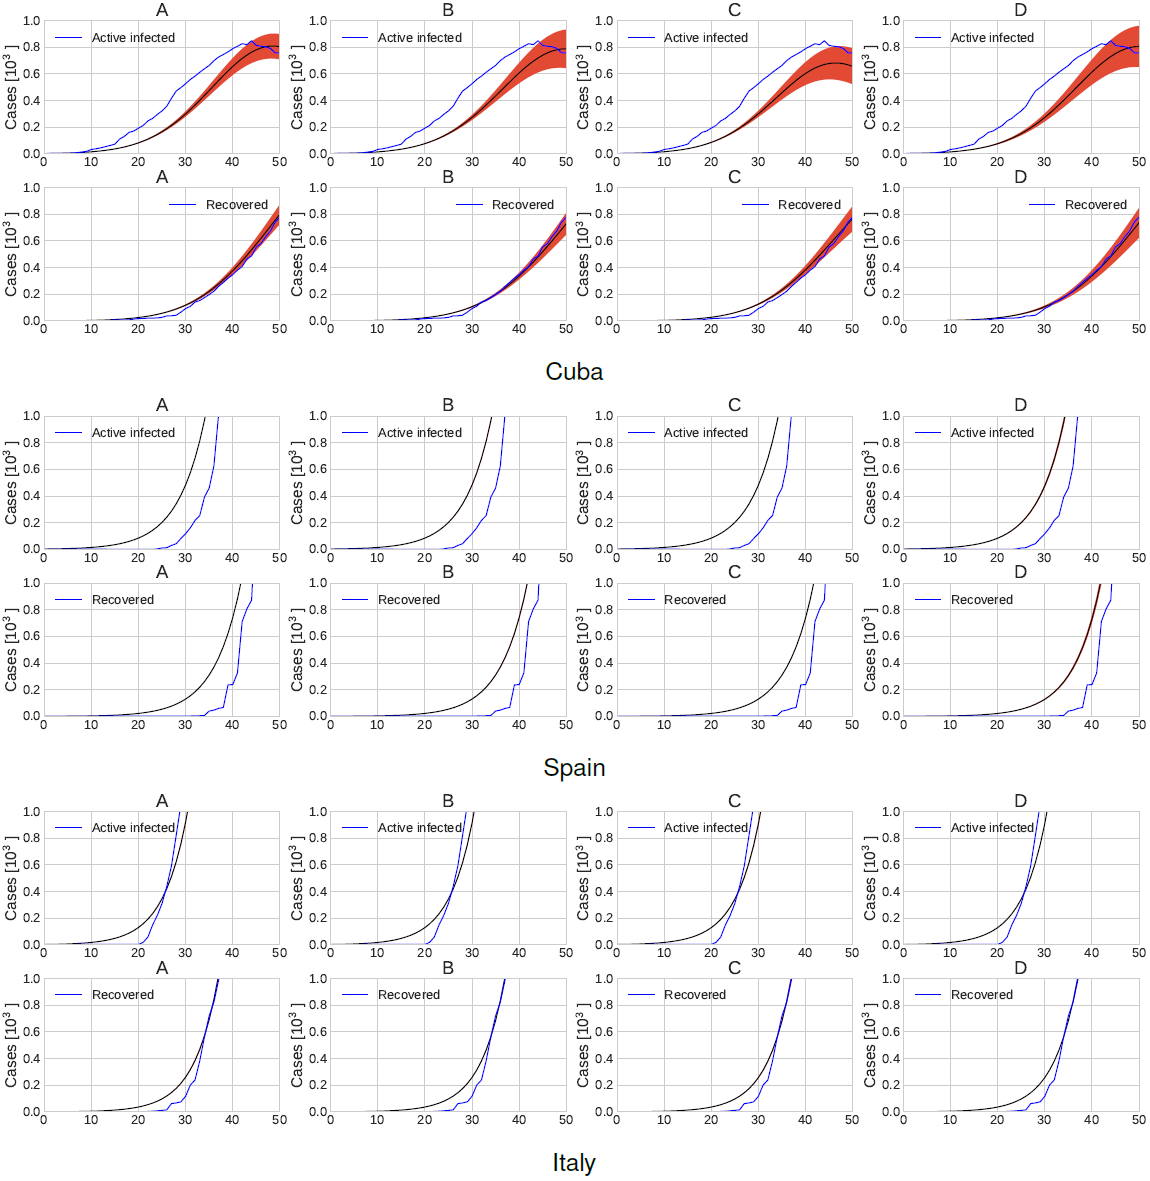
Fig. 8 Active infected and recovered time series forecast and the current observed times series in blue corresponding to scenario 3. Plots A, B, C and D show clusters of different possible future outcomes
Notice that this scenario is fundamentally different from scenario 2, where restriction policies are kept for a long time, which is really difficult to achieve from a practical point of view. In the cases of Spain and Italy, the per-capita transmission rate is kept mainly constant as the data do not capture the effect of restriction policies at this point.
Figure 9 shows the SEIR model parameters distribution for each of the top b = 4 possible outcomes studied in the present work. As before, the results obtained in this scenario are similar to the already obtained values of γ0 and γ1 in the first and second scenario. This somehow highlight how our meta-heuristic approach is able to find such parameters even under different per-capita transmission regimes.
4 Discussion
Our proposal allows a fast analysis of several scenarios with adequate accuracy. This approach has the potential of fitting SEIR models not only for an entire country, but also for provinces, municipalities and small geographical regions based only in the data. Considering the case of Cuba, where social distance measures were applied in the first 50 days, we observe a reduction of about 65-80% of the per-capita transmission rate in that period of time. Interestingly, similar results were obtained by Jarvis et al. who reported a 73% reduction in the average daily number of contacts observed per participant after the implementation of restriction policies [8].
For the case of Spain and Italy, we do not observe any reduction in the per-capita transmission rate during this period of time. This is somehow consistent with the delay in the application of social distance measures (for example, in the case of Spain the lockdown was imposed in approximately day 45 of the epidemic). Moreover, this situation highlights an important limitation of our scenario modelling, as neither the wave function of scenario 1 and 3 nor the exponentially decreasing function of scenario 2 will be able to fit accurately the expected decay in the per-capita transmission rate after day 50 in such countries. Future work should account for a function with more degrees of freedom to model such situation.
Surprisingly, the exposed-to-infectious rate for the three studied countries was similar in approximately γ0≈0.5. This even holds when we consider the three scenarios under study. This value of the exposed-to-infectious rate is similar to other results obtained for Spain and Italy [6] but different to the exposed-to-infectious rate γ0≈0.2 observed in China [10].
The analysis of the scenarios highlights the importance of keeping restriction policies during a reasonable time, providing further evidence of its efficacy in preventing future waves of infection [18]. At this point, the main limitation of our approach is the accuracy of the real infected time series that may be biased. Despite this, even when the official infected time series may not be accurate, we may expect it to be correlated with the actual number of infected patients.
In practice, the real number of infected patients is larger than that officially reported by countries and institutions4. The informed official number critically depend on the applied tests. For this reason, in our study, we have selected countries with a good system of data retrieval, which allows us to conduct analysis on this data with a reasonable confidence. Moreover, reports show that the real number of infected patients for the three studied countries in the first wave of the disease is very low compared to the total population. For example, surveys based on PCR tests have found that around 4-5% of the population in Spain has been infected5. This means that, at present, the susceptible population is more than 95% of the total population.
In addition, to reach herd immunity, a significant fraction of the population has to get infected [15]. In that condition we guess that our predictions will be semi-quantitatively correct and useful in order to take decisions about relaxing or restricting policies. Particularly, the modelled results of scenario 2 (keeping restriction policies as they are currently implemented), is compatible with the excellent results obtained by China in the management of the crisis in Wuhan, Hubei.
We need to consider several core limitations of our approach. First, the meta-heuristic FA search algorithm is a stochastic search method, hence, there is not warranties of finding all possible fittings. Moreover, FA hyper-parameter optimization is a difficult task as, in general, this is a class of challenging optimization problems, whose objective functions tend to be non-smooth, discontinuous, unpredictably varying in computational expense and include continuous, nominal and/or discrete variables [9].
Our approach might be used carefully and it is critical to take into account the following elements:
— Care must be taken in selecting the number of iterations of the FA algorithm. A low number of iteration will cause poor fitting around local minima while a large number of iterations will cause a lack of diversity of the firefly solutions.
— Care must be taken in selecting the number of top b clusters. Choosing a small value of b may leave important outcomes out of the analysis, while a large number will render too many future outcomes, increasing the difficulty of studding them.
— Finally, our approach cannot be used before having data, hence, it will be only available after the epidemic have already began. However, as the epidemic advance, the number of possible future outcomes will reduce, increasing the forecasting accuracy.
5 Conclusions
We have developed a meta-heuristic approach to find parameters of the SEIR model that best explains the observed infected and recovered time series. Further, we have shown that there are several possible parameter vectors of such models able to explain current epidemic trends and by studding them is possible to obtain insights into the future possible outcomes. Our approach allowed to study several scenarios in different countries at medium and long term. The proposed method could be more exact depending on the time series accuracy. In this sense, as the time passes, the number of possible future outcomes will reduce, increasing the forecasting accuracy.

