


 nova página do texto(beta)
 Inglês (pdf)
 Artigo em XML
 Referências do artigo
 Enviar este artigo por email
 Citado por SciELO
  Similares em
SciELO
Similares em
SciELO 
 Permalink
1. Introduction
Copper based composites are one of the best broadly used materials because of their malleability to different conditions and the comparative affluence of mixture with other materials to serve precise purposes and show appropriate properties (Prabagaran,Chandramohan, & Shanmughasundaram, 2014). conditions and the comparative affluence of mixture with other materials to serve precise purposes and show appropriate properties (Prabagaran, Chandramohan, & Shanmughasundaram, 2014). Cu based composites materials are superior to components such as ITER parts, spot welding electrodes, heat exchangers and trolley wires in electric railways due to their good strength, better fatigue resistance, exceptional resistance to corrosion, affluence of fabrication and better tribological properties (Purcek, Yanar, Saray, Karaman, & Maier, 2014). Copper-Chromium matrix alloy has good thermal conductivity, corrosion resistance, enhanced strength and hardness. However minor loss in electrical conductivity is due to the attachment of fine ceramic particles such as carbides, oxides, nitrides and borides. ZrC has high hardness, high melting point, and abrasion resistance with sensible electrical conductivity. Ceramic strengthened metal matrix composites show enhanced strength and wear resistant properties (Rajkumar & Aravindan, 2011).
The ZrC particle dispersed into the matrix reinforcement yields to enhancement in strength depends primarily on: size, distribution, spacing and thermodynamic stability into the matrix (Fathy, Shehata, Abdelhameed, & Elmahdy, 2012). Chromium in copper has low solid solubility even at eutectic temperature and has been focused on the solid solution preparation method, in which mechanical alloying has lot of responsiveness as a modest method (Zhao et al., 2014). Cu-based composites can be fabricated by Mechanical Alloying (MA) and through Powder Metallurgy (P/M) method. The near-net shape products and better control of grain size can be attained by hot working processes through P/M (Pourkhorshidi, Parvin, Kenevisi, Naeimi, & Khaniki, 2012). The wear resistance of the composites improves by mechanical alloying; strengthening particles are dispersed well and therefore with more fine particles (Abdollahi, Alizadeh, & Baharvandi, 2014). Most of the studies have been endeavoured to enhance some alloy elements (Cr, Ag, Zr, Ni, Nb, Mg, etc.) to the Cu matrix in order to realize a good mixture of strength and conductivity. Though, the addition of several elements increases the defects of Cu-based alloys, leading to the improvement of electron scattering, which increases the electrical resistance (Yang, Li, Yuan, & Lei, 2015). The electrical conductivity diminutions marginally however the micro hardness improves, by enriching the tensile elongations of Cu-Cr-Zr alloy at each temperature from 100 to 300 °C (Zhang, Zhang, & Wei, 2015). In general the work on this definitely includes high cost and intense time since lots of experimental work need to be carried out to recognize the implementation of research methodology via trial and error method. Design of Experiment (DOE) method can be implemented to decrease the number of experiments.
In the present study, the SWR and COF were chosen as responses and three-factor (reinforcement, sliding distance and load) at four-level were selected for the design of experiments using generalized full factorial design and has been used to explore instantaneously possessions of individual and interactional parameters on the performance of Cu-4Cr-xZrC composites. The SEM shows the presence of Cu, Cr and ZrC particles in the composites. The electrical resistivity was measured by four point probe tester for the composites and also the hardness was measured by Rockwell hardness tester.
2. Experimental procedure
2.1 Materials
Electrolytic copper 99.7% purity with 10 µm purchased from M/s. Metal Powder Company Limited, India. Chromium powder with purity of 99.5%, with 40 µm and zirconium carbide powder with 99.9% with 0.4-1.2 µm was purchased from US Research Nanomaterial’s, Inc. USA. Fig. 1(a-c) shows that the SEM images of received powder micrograph of copper, chromium and zirconium carbide having the structure of tiny and irregular, hexagonal and cubic.

2.2 Powder preparation
Mixing is important in P/M route. The three reinforcements are taken in proper proportion by using rule of mixtures. The reinforcements by weight percentage are measured in an electronic weight balance machine. The measured weight proportions are then mixed by MA in high energy planetary ball mill for 1h at 300rpm and the ball to powder ratio is 30:1. From the SEM image it is also exposed that the sharp firmed structure of copper has been shattered due to the ZrC particle which has easily been bonded with the Cu-Cr alloy. To increase the strength of the soft copper material regardless of different wt. % of ZrC particles has been strengthened into the matrix. It was clearly imagined in the SEM micrographs shown in Fig. 2(a-c).
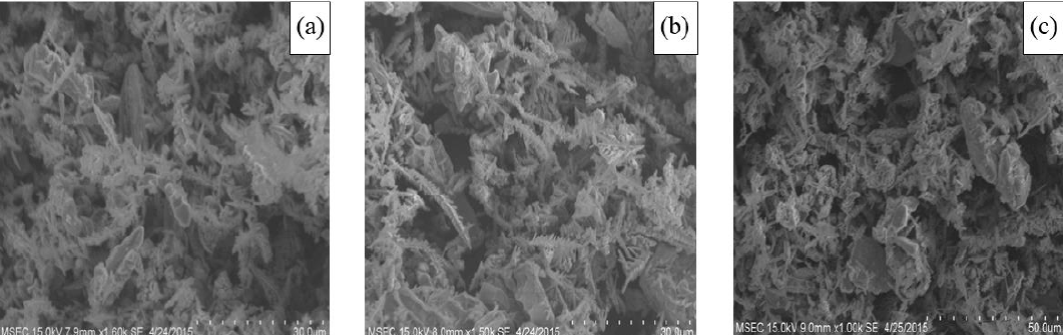
Fig. 2 (a-c) SEM micrographs of composites after mixing (a) Cu-4Cr-0ZrC, (b) Cu-4Cr-4ZrC, (c) Cu-4Cr-8ZrC.
It is noticed that all the particles are distributed homogenously throughout the sample. This is due to the usage of ball mill for the steady mixing of powders. The X-Ray Diffraction (XRD) analysis for the prepared Cu-4Cr-xZrC composites is shown in Fig. 3. These results specify the existence of Cu and Cr (in the major peaks), and ZrC is specified by minor peaks. The ZrC peak is clearly visible and can be identified in the Cu-4Cr-xZrC composites. There is an evidence for the increase in the intensity of the ZrC peaks with the increase in wt. % content of the Cu-4Cr-xZrC composites. A steady marginal shift of the pure Cu peaks to greater angles with an increase in the wt. % of the ZrC content is also noticed. From the Fig. 3, it can be inferred that there is no oxidation in the samples during sintering process.

2.3. Compaction, sintering and hot extrusion
Consequently, mixed powder compositions were compressed to cylindrical preforms of 20mm diameter using suitable die and punch assembly in a compression testing machine (1MN). The essential pressure for compression was applied progressively to 1.1GPa for all the specimens. Zinc cerate was applied as grease to the punch and die for easy expulsion of the cylindrical preforms. The green density of 87% was reserved by applying pressure to the specimens. MPIF standard 35 were used for compaction of cylindrical performs (Singh & Selvakumar, 2017). The cylindrical shaped preforms were sintered in an argon atmosphere at 900o C in a muffle furnace for 2h and afterwards the furnace was ventilated to room temperature. The sintered specimens were taken out from the furnace and cleaned by a wire brush. Finally, the Cu-4Cr-xZrC composites specimens were obtained without oxidation and contamination. Extrusion of the sintered performs was executed at 650o C without canning and degassing using an extrusion ratio of 30:1 to confirm an improvement in density after extrusion. A thin layer of a mixture of Zinc stearate and oil were applied to the surfaces of the die, aiding as a lubricant. The sintered pre-forms were extruded to form cylindrical rods of 8mm in diameter and around 20 mm long (Selvakumar & Vettivel, 2013).
2.4. Wear tests
In this study the pin-on-disc wear testing apparatus with standard ASTM G99 was used for studying the dry sliding wear and coefficient of friction of Cu-4Cr-xZrC composites to evaluate wear characteristics. The cylindrical preforms were polished with 800 grit size SiC paper and cleaned with acetone prior to wear testing. The weight loss of the cylindrical preforms before and after wear test were weighed in a weighing balancing instrument with an accuracy of 0.001 g. EN 31 steel having a hardness
In this study the pin-on-disc wear testing apparatus with standard ASTM G99 was used for studying the dry sliding wear and coefficient of friction of Cu-4Cr-xZrC composites to evaluate wear characteristics. The cylindrical preforms were polished with 800 grit size SiC paper and cleaned with acetone prior to wear testing. The weight loss of the cylindrical preforms before and after wear test were weighed in a weighing balancing instrument with an accuracy of 0.001 g. EN 31 steel having a hardness value of 64HRC was used as counter surface. Disc surfaces were dressed with acetone prior to wear testing. Wear performance of the Cu-4Cr-xZrC composites was deliberate as a determination of sliding speed, load and reinforcements. The SWR and COF are calculated based on the reference (Selvakumar & Ramkumar, 2016).
2.5. Electrical resistivity
Copper has enhanced the electrical conductivity than its alloys. Electrical resistivity is a measure of a material that faces the flow of electron. The subsequent relationship V = IRe and Re = qx(Ls/As) where Re is electrical resistance, q is electrical resistivity, and Ls and As are the length and cross-sectional area of specimens correspondingly and the electrical resistivity was well-defined by a four-point probe tester (SES Instruments Pvt. Ltd., Roorkee, India) in a dynamic nitrogen atmosphere with changing temperature, constant current (I = 0.5 Amp) and amount of the voltage (V). The temperature was changed with the help of thermo couple and the specimen prepared for the test was 8mm in diameter and a length of 20mm and the contact points were primed by adhesion with a thin layer of high conductivity silver paste and the measurements were taken by direct current. To increase the contact, the junction points were fine-tuning by emery sheet. The microstructural effects and the excellence of the contact points might be known by different resistivity acquired for a temperature greater than 323K. However, the conductivity is the reciprocal of the resistivity.
2.6. Full factorial design
An experimental design with three levels and three factors were executed by L27 orthogonal array for dry sliding wear behavior of Cu-4Cr-xZrC composites by the P/M method. In the 33 full factorial designs, it is hypothesized that the final properties obtained by experiments can be expressed as a quadratic function of experimental factors. Subsequently a portentous session, three factors and there levels were chosen as independent input factors: i.e. reinforcement, load and sliding distance. L27 orthogonal array were selected as the experimental design method to identify the factors which have the order of significance of each effect. Table 1 Experimental factors and number of levels used in Design -Expert 9.0.5 and the 33 full factorial design, measured and predicted responses on SWR and COF are shown in Table 2.
Table 1 Experimental factors and number of levels.
| Factor | Levels | Values |
|---|---|---|
| Reinforcement ( A) | 3 | 0, 4, 8 (ZrC) |
| Sliding distance (B) | 3 | 1000, 1500, 2000 |
| Load (C) | 3 | 16, 20, 24 |
Table 2 Shows the experiment on 33 full factorial design, measured and predicted responses on SWR and COF.
| Run order | A (wt. %) | B (m) | C (N) | Actual value (SWR)x10-5 mm 3 /N-m | Predicted value (SWR)x 10-5 mm 3 /N-m | Actual Value (COF) | Predicted value (COF) | Rank |
|---|---|---|---|---|---|---|---|---|
| 1 | 4 | 2000 | 16 | 9.1804 | 9.25 | 0.48 | 0.48 | 15 |
| 2 | 0 | 2000 | 20 | 12.084 | 11.86 | 0.535 | 0.54 | 27 |
| 3 | 4 | 1000 | 16 | 8.6511 | 8.63 | 0.47 | 0.47 | 12.5 |
| 4 | 0 | 2000 | 12 | 11.086 | 11.21 | 0.51 | 0.51 | 21.5 |
| 5 | 8 | 1500 | 20 | 7.8815 | 7.97 | 0.44 | 0.44 | 7.5 |
| 6 | 4 | 1500 | 16 | 8.9447 | 8.94 | 0.48 | 0.48 | 15 |
| 7 | 4 | 1500 | 20 | 9.1576 | 9.13 | 0.485 | 0.49 | 17 |
| 8 | 0 | 1000 | 16 | 10.982 | 11.05 | 0.505 | 0.51 | 20 |
| 9 | 8 | 2000 | 16 | 8.0151 | 8.09 | 0.44 | 0.44 | 7.5 |
| 10 | 8 | 1500 | 16 | 7.7742 | 7.78 | 0.43 | 0.43 | 5 |
| 11 | 8 | 1000 | 20 | 7.6461 | 7.66 | 0.43 | 0.43 | 5 |
| 12 | 0 | 1500 | 20 | 11.523 | 11.55 | 0.53 | 0.53 | 26 |
| 13 | 8 | 2000 | 12 | 7.5952 | 7.62 | 0.43 | 0.43 | 5 |
| 14 | 0 | 1000 | 20 | 11.221 | 11.24 | 0.52 | 0.52 | 23.5 |
| 15 | 4 | 2000 | 20 | 9.4274 | 9.44 | 0.49 | 0.49 | 18.5 |
| 16 | 4 | 1000 | 12 | 8.2652 | 8.16 | 0.45 | 0.45 | 9.5 |
| 17 | 0 | 1000 | 12 | 10.489 | 10.59 | 0.49 | 0.49 | 18.5 |
| 18 | 8 | 1500 | 12 | 7.3969 | 7.31 | 0.42 | 0.42 | 2.5 |
| 19 | 0 | 2000 | 16 | 11.838 | 11.67 | 0.525 | 0.52 | 25 |
| 20 | 4 | 2000 | 12 | 8.7333 | 8.79 | 0.47 | 0.47 | 12.5 |
| 21 | 8 | 1000 | 16 | 7.4565 | 7.47 | 0.42 | 0.42 | 2.5 |
| 22 | 0 | 1500 | 12 | 10.818 | 10.9 | 0.51 | 0.51 | 21.5 |
| 23 | 4 | 1000 | 20 | 8.7591 | 8.82 | 0.48 | 0.48 | 15 |
| 24 | 8 | 1000 | 12 | 7.1468 | 7 | 0.41 | 0.41 | 1 |
| 25 | 0 | 1500 | 16 | 11.401 | 11.36 | 0.52 | 0.52 | 23.5 |
| 26 | 4 | 1500 | 12 | 8.5212 | 8.48 | 0.46 | 0.46 | 11 |
| 27 | 8 | 2000 | 20 | 8.2505 | 8.28 | 0.45 | 0.45 | 9.5 |
Bold Values specify the optimal results attained from the modeling
3. Results and discussion
3.1. Influence of zrc on hardness
Hardness of Cu-4Cr-xZrC composites was measured using Rockwell hardness tester (Soraj Engineering Udyog (P) Ltd., Jaysingpur, Maharastra, India) using B scale by applying load of 980 N. The bearing surface, test specimen and bore of diamond holder were cleaned before testing. The specimens were executed randomly at minimum five different location and averaged to acquire the exact hardness of the specimen. Subsequently the hot extrusion process, the specimens were refined and the depression technique was carried out. Hardness was found to be enhanced after hot extrusion due to the severe plastic deformation, recrystallization and grain refinement and uniform bonding taking place between the elements in the Cu-4Cr-xZrC composites.
Future the wear tests of the specimens were refined and the depression technique was reiterated. So, heat was produced at the bottom of the pin for different loads, sliding distance and sliding velocity. Thermal aging occurred during the loading of the specimen bottom surface and contact with counter surface. Figure 4 shows the assessment of the hardness of the specimens with different wt. % of ZrC content. From the given Fig. 4, it is clear that the hardness of the specimen increases due to the accumulation of ZrC into the Cu-4Cr-xZrC composites (Kalaiselvan, Murugan, & Parameswaran, 2011). Because of the improvement in hardness, the Cu-4Cr-xZrC composites material can be used in ITER parts.

3.2. Effect of zrc on electrical resistivity
Figure 5 shows the electrical resistivity of Cu-4Cr-(0 - 8 wt. % ZrC) P/M composites specimen prepared at 900o C sintering temperature and then hot extruded at the temperature of 650o C to lower the electrical resistivity. By extrusion process, the pores and clusters of nanoparticles will be bonded together and there by the electrical resistivity can be reduced little more. The electrical resistivity of the Cu-4Cr-0ZrC composite is 2.466 * 10 -8 Ω m at 900o C and addition of weight percentage of ZrC gives increasing resistivity. The electrical resistivity of Cu-4Cr-0ZrC is increasing when compared to the reference value of Cu = 1.7241 * 10 -8 Ω m. This is mainly due to the pores and the accumulation of powders. The pores present in the composites are in fact the insulation sites which increase the resistivity of the Cu-4Cr-xZrC composites (Vettivel, Selvakumar, Leema, & Lenin, 2014). The percentage of increasing the ZrC contents in the Cu-4Cr composites increases the electrical resistivity owing to the size of the pores and the pores are likely to be interrelated within the Cu-4Cr grains by the ZrC nano particles. The ZrC nano particles are located at the grain boundaries of Cu-4Cr particles and the reduction in the electrical resistance is by filling and joining the vacant regions of the Cu-4Cr matrixes.

3.3. Xrd analysis, crystalline size and lattice strain on addition of zrc
X-Ray Diffraction (XRD) arrays of the Cu and Cu-4Cr strengthened with different wt. % of ZrC particles are shown in Fig. 3. Cu, Cr and ZrC peaks were indexed using JCPDS files (file numbers 851326, 882323, and 654932 respectively). XRD analysis showed in Fig. 3 confirms the presence of ZrC strengthening within the matrix. The peak of ZrC is increasing with increased ZrC content while the peaks of Cu and Cr are found to be decreasing. It is also interesting to note that the peak of Cu in the composite was little bit shifted to lower 2θ when compared to that of Cu. It is also evident from the XRD pattern that the nano ZrC particles did not react with Cu matrix and produce any other compounds. The ZrC particles are thermodynamically stable at the synthesizing temperature used in this work. This may be due to the formation of Cr compound layer around nano ZrC particles which tend to act as a response barrier and prevent the interfacial reactions between the ZrC and Cu matrix. There was a distinctive singularity that the diffraction peaks of Cu and Cr became wide-ranging and low-slung with the content of ZrC enhanced. It means the crystalline size of Cu and Cr is reduced and their lattice strain is increased with more nano ZrC content. The diffraction peaks of ZrC were shielded by the wide diffraction peaks of Cu and Cr. The crystalline size and lattice strain rate can be determined by Scherrer’s formula for the composites.
From Fig. 6 the crystalline size and lattice strain of Cu-4Cr-xZrC composites were calculated using the Williamson-Hall method as a function of the strengthening content (Singh & Selvakumar, 2017). The crystalline size of the Cu-4Cr-xZrC composites decreases with an increasing ZrC concentration and the lattice strain increases with higher amounts of ZrC as a result of the higher thermal incompatibility between the strengthening and the matrix. Moreover, second phase can increase the thermal stability of crystalline materials via a drag-force mechanism on the grain borders. The crystalline size decreases from 77.7 nm to 55.9nm and the lattice strain increase from 0.23% to 0.30%. This phenomenon is due to the inclusion of nano ZrC content into the matrix from 0 wt. % to 10 wt. %. Constant volume of Cr increases plastic deformation of soft matrix compositions, and the existence of hard and brittle ZrC hurries the deformation more, causing large strains in the matrix compositions. The particles have additional lattice strain, lattice defects (Zhang et al., 2015) and huge surface energy and so, the particles are likely to have high activation and good sinter properties.

3.4. Effect of reinforcements as a function of specific wear rate
Figure 7(a-c) shows the variation of SWR with the function of varying weight percentage of reinforcements of Cu-4Cr-xZrC composites. Figure 7(a-c) shows the method of exploring individual reinforcements with a constant track diameter of 100 mm, constant sliding velocity 2.618 m/s and sliding distances of (1000, 1500 and 2000 m) for the applied loads (12, 16, and 20 N) respectively. The load was increased in stepwise as 4N. Fig. 7 shows the SWR during wear test for different weight percentages Cu-4Cr-xZrC composites. The lowest value of SWR in wear test was distinct for Cu-4Cr-8ZrC and the higher SWR in wear test was for bare Cu-4Cr-0ZrC alloy. The SWR for the matrix composites increases linearly with increase in the sliding distance.
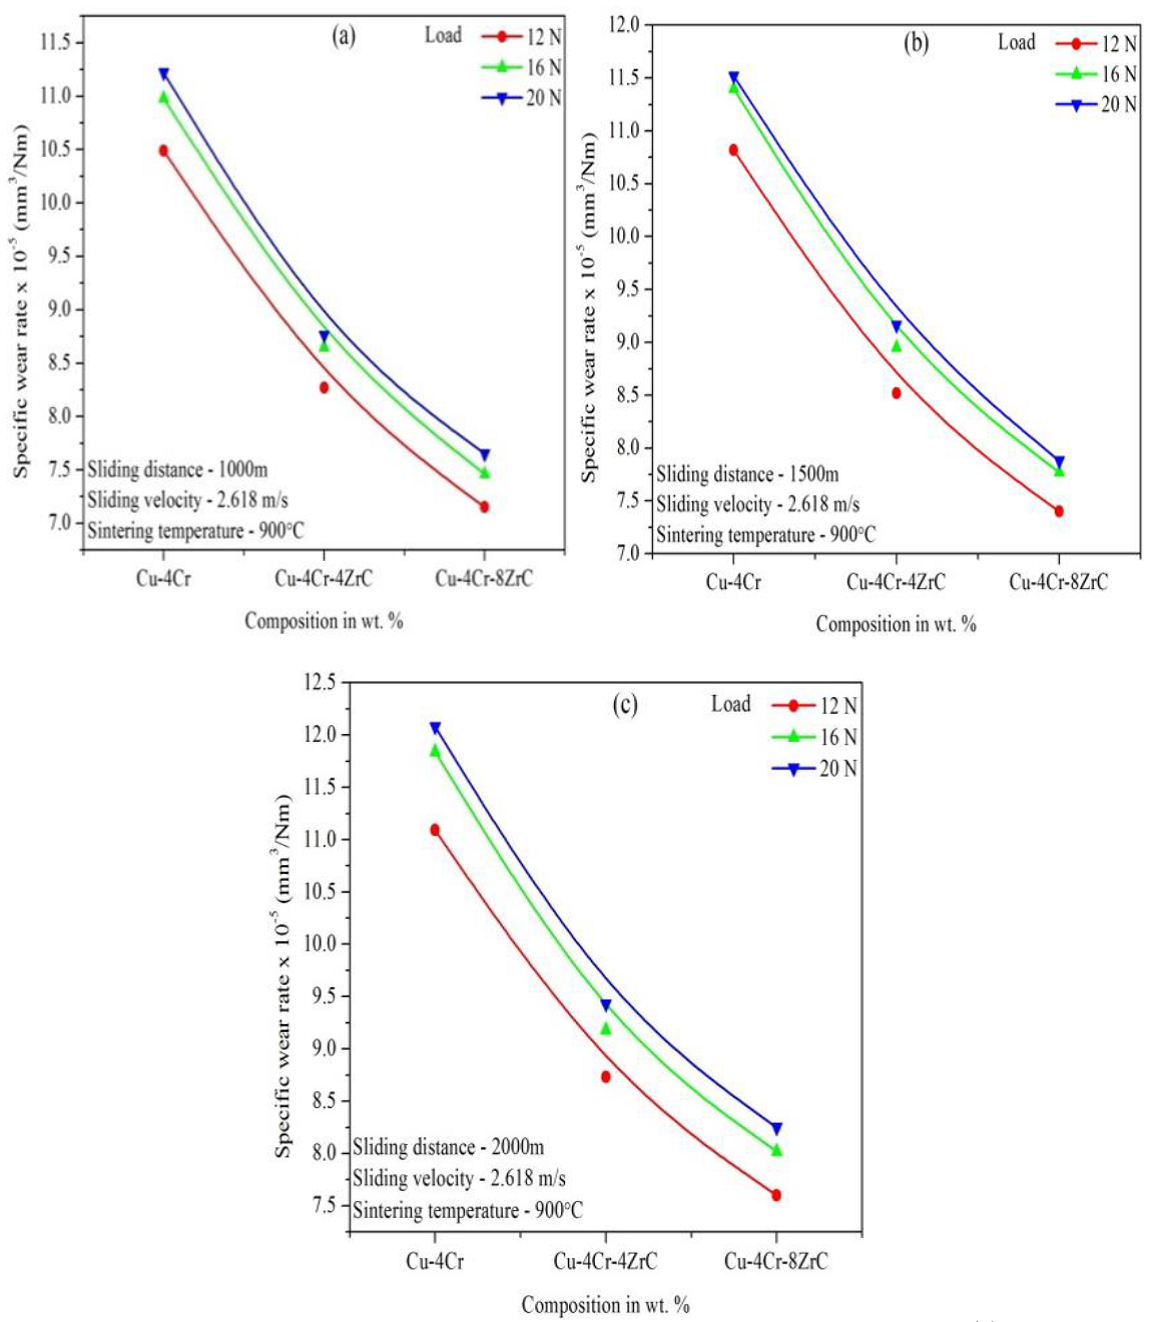
Fig. 7 Shows the SWR as a function of reinforcements against load and sliding distance for (a) Cu-4Cr-0ZrC, (b) Cu-4Cr-4ZrC, (c) Cu-4Cr-8ZrC.
The wear resistance of the composites is significantly improved due to the addition of the ZrC nanoparticles and increases with increasing ZrC weight fraction up to 8 wt. %. Mostly, the improved wear resistance of all composites is the existence of ZrC nano particles whose hardness is much better than the matrix alloy (Vettivel et al., 2014). It is well known that hard ZrC nanoparticles in the matrix alloy offer fortification to the softer matrix during sliding and reinforce the Cu-Cr matrix. This fortification will limit the deformation, and also resists the infiltration and wounding of the asperities of the sliding disc into the surface of the composites. The ZrC nano particles also improve load-bearing capacity and thermal stability of the composites. Also, SWR were decreased, due to the increase in hardness of the Cu-4Cr-xZrC composites. This is due to the inclusion of secondary ZrC nanoparticle reinforced on the soft Cu-Cr matrix.
3.5 effect of reinforcements as a function of coefficient of friction
Figure 8(a - c) shows the variation of COF with the function of varying weight percentage of reinforcements for the increase in normal load over the entire sliding distance for the Cu-4Cr-xZrC composites. It is perceived that the COF decreases with increasing normal load and same tendency is perceived for all the reinforcements. Figure 8(a-c) shows the method of exploring individual reinforcements with a constant track diameter of 100 mm, constant sliding velocity 2.618 m/s and sliding distances of (1000, 1500 and 2000 m) for the applied loads (12, 16, and 20 N) respectively. The load was increased in stepwise as 4N. The COF of the matrix alleviated at about 0.535 under the load of 20 N for the Cu-4Cr-0ZrC composites. The Cu-4Cr-8ZrC composites surface showed a low steady-state COF at about 0.41 under the load of 12 N. There was a slight increase in COF for composites surface at loads above 20 N. The COF of composites surface is quite lower than the Cu-4Cr-0ZrC composites matrix. Figure 8(a-c) shows the COF during wear test for different weight percentages of Cu-4Cr-ZrC composites. The COF as a function of reinforcements for the Cu-4Cr-ZrC composites is presented in Fig. 8(a-c). Specifically for the composite, excessive value and fluctuation of COF represent seizure of material which may be attributed to excessive sub-surface fracturing and delamination at such high value of applied load (Singh & Selvakumar, 2017). The ZrC particles or debris can act as solid lubricants on the sliding surface that would be one reason for the lower COF of composites surface layer. This may be attributed to the presence of ZrC which, during dry sliding, comes out on the sliding surface to form a lubricating layer reducing friction.
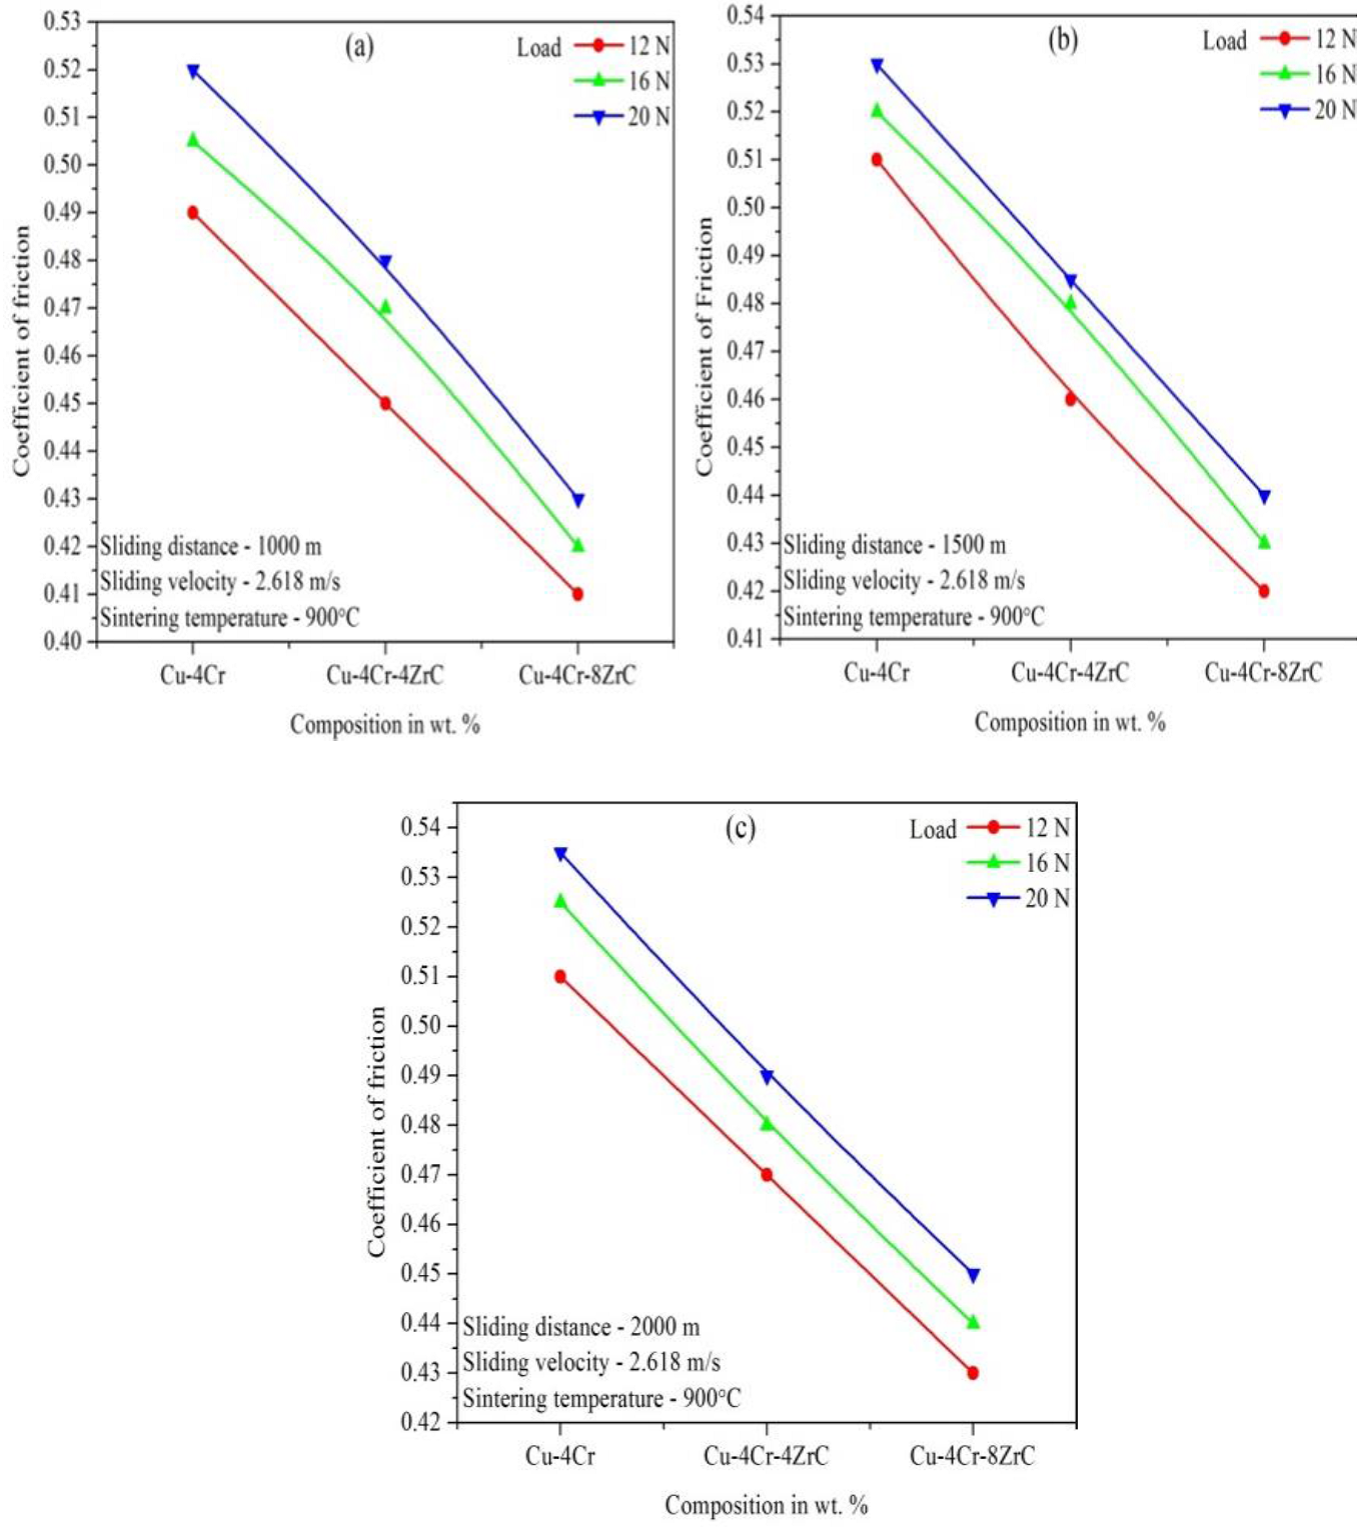
Fig. 8 Statistical analysis of COF as a function of reinforcements against load and sliding distance for (a) Cu-4Cr-0ZrC, (b) Cu-4Cr-4ZrC, (c) Cu-4Cr-8 ZrC.
However, the ZrC containing composites show a relatively lower COF than the Cu-4Cr-0ZrC composites. However, the trend observed for the COF i.e. it increased linearly with applied load at constant sliding speed was similar to the trend observed in this work.
3.6 Analysis of Variance (ANOVA)
Table 1 shows the implementation of 33 full factorial designs by using design expert software 9.0. The % contributions (P) were tabulated in the last column to determine the influence of main effects such as reinforcements, sliding distance and load. Therefore the predominant factors that influence the SWR and COF was reinforcements and the remaining two factors sliding distance and load are very small and the interaction effects are negligible. To test the 95 % confidence level on the input parameter the interaction effects was rejected and hence it is considered as a residual error. Now, the F0 value can be obtained by the residual error. In Tables 3 and 4 columns 5 and 7 shows the significance level and % contribution (P) for main effects.
Table 3 ANOVA for SWR.
| Source | Sum of Squares | df | Mean Square | F0 Value | p - value Prob > F | % Contribution (P) |
|---|---|---|---|---|---|---|
| A | 60.27 | 2 | 30.13 | 3311.60* | < 0.0001 | 93.82 |
| B | 1.74 | 2 | 0.87 | 95.50* | < 0.0001 | 2.71 |
| C | 2.05 | 2 | 1.02 | 112.48* | < 0.0001 | 3.19 |
| Residual Error | 0.18 | 20 | 9.100E-003 | - | - | 0.28 |
| Total | 64.24 | 26 | - | - | - | 100 |
Table 4 ANOVA for COF.
| Source | Sum of Squares | df | Mean Square | F0 Value | p - value Prob > F | % Contribution (P) |
|---|---|---|---|---|---|---|
| A | 0.033 | 2 | 0.017 | 1766.76* | < 0.0001 | 89.18 |
| B | 1.372E-003 | 2 | 6.861E-004 | 72.65* | < 0.0001 | 3.7 |
| C | 2.467E-003 | 2 | 1.233E-003 | 130.59* | < 0.0001 | 6.66 |
| Residual error | 1.889E-004 | 20 | 9.444E-006 | - | - | 0.46 |
| Total | 0.037 | 26 | - | - | - | 100 |
Compared to main effects, the % contribution of the interaction effects is less than 20% and it can be rejected from the ANOVA Tables 3 and 4. There is only a 0.01% chance that an F0-value this large could occur due to noise. Values of "Prob > F0" less than 0.05 designate model terms are significant (Carrera-Cerritos, De León, Ledesma-García, Fuentes-Ramírez, & Arriaga, 2014). The statistical analysis clearly shows that the reinforcements were mostly influenced on sliding wear and friction.
3.7. Half-normal probability plot for swr and cof
Alternative test to confirm the effects of variables (eliminating the influence of degrees of freedom) is the half-normal probability plot for variables; see Fig. 9(a-b). The benefit of the probability plot is in the agreement of effects from variables on the “noise” line (red line in the Fig. 9). If the additional distant variable is from the “noise” line, the better effect on the SWR and COF with greater precision can be achieved. Fig. 9(a-b) confirms the decisions of 3 significant factors present in the model (Timma, Sams, Valtere, Vilgerts, & Blumberga, 2014). From Fig. 9(a-b) the half - normal probability plot for main effects reveals that the reinforcements is the predominant factor influencing SWR and COF those of sliding distance and load are very small and have a little bit influence on SWR and COF. The results revealed that interaction effects of SWR and COF are below the 5 % significance level.

3.8. Worn surface analysis
The SEM images of the worn surface of the reinforced Cu-4Cr-xZrC composites with 0 to 8 wt.%, after sliding distance of 2000m under an applied load of 20N is shown in Fig. 10. The worn surface of the Cu-4Cr-xZrC composites was normally much coarser than that of the unreinforced matrix material which was exposed by the investigation of the worn surfaces. In detail, the ZrC nano particles were found inside the sponginess showing that some ZrC nano particles were worn-out and other particles encumbrance out from the surface. It indicates an abrasive wear mechanism which is meritoriously a result of hard ZrC nano particles displaying on the worn surface and unattached debris between two surfaces (Itoi, Gonda, & Hirohashi, 2011). Abrasive wear effects in surface deformation and destruction in the form of deep grooves along the sliding direction, is shown clearly in Fig. 10(a-c). Likewise, broad surface destruction ensuing from plastic deformation is also observed on all worn surfaces. In precise, deformation of the original pin specimen along the wear direction is clearly observed on the worn surface in Fig. 10(c). As the ZrC nano particles oppose the restriction process, the wear resistance is more in the case of Cu-4Cr-xZrC composites.

Conclusions
In the present analysis, the Cu-4Cr-xZrC composites were tested against steel counter body for different load and sliding distance. The subsequent conclusions can be drawn based on the experimental work:
The Cu - Cr matrix composite increases the electrical resistivity with the addition of weight percentage of ZrC nanoparticles.
The hardness of the Cu-4Cr-xZrC composites was increased with increasing ZrC content reinforcement into the Cu-Cr matrix.
Based on the results of ANOVA, the polynomial models of the specific wear rate and friction coefficient are well fitted to the experimental values. The influence of the wear parameters on the specific wear rate and friction coefficient was deliberate by the mathematical model.
The outcomes revealed that all variables had significant effects on the SWR and COF at 95 % confidence level. Aggressive and synergistic interfaces between the variables have been shown statistically through full factorial design and by application of the half-normal probability plot analysis.
The specific wear rate and friction coefficient of the composites decreases with the addition of ZrC nano particle reinforcement and also at the same time it increases with increase in load and sliding distance respectively.
SEM analysis of the worn surface exploration indicates that the enhancement in hardness and improvement in the wear behavior of the composites material were studied.

