


![Unveiling [3 + 2] Cycloaddition Reactions of N-Methyl-C-3-Bromophenyl-Nitrone to Dimethyl Maleate: Molecular Electron Density Theory Perspective](/img/pt/next.gif)


 nova página do texto(beta)
 Inglês (pdf)
 Artigo em XML
 Referências do artigo
 Enviar este artigo por email
 Citado por SciELO
  Similares em
SciELO
Similares em
SciELO 
 Permalink
Introduction
Cinnamon is an important traditional herbal medicine that is widely used in pharmaceutical preparations, cosmetics, aromatic condiments and flavoring additives (in foods and drinks), and chemical industries, and has a considerable economic value [1]. Since time immemorial, human beings have known and used cinnamon as a spice in their food and traditional herbal medicine [2]. The bioactivity of cinnamon compounds has opened a wide venue for the biological studies of these compounds [2-9]. Cinnamic acid and cinnamaldehyde are the most famous cinnamon compounds, not only because of their high biological and pharmaceutical importance but also because of the value of their derivatives, such as acids and amides, as biological agents. Therefore, it will be the main focus on in this work. Cinnamic acid (C9H8O2) and Cinnamaldehyde (C9H8O) as well as their derivatives have been reported to be naturally occurring in a wide variety of fruits and vegetables with a variety of biological activities, such as anticonvulsant, antidepressant, antimalarial, antioxidant muscle relaxant, anti-allergic, antineoplastic, anti-infective, antimicrobial agents, antituberculosis, and anticancer [2-9]. The United States and Europe have approved both compounds as flavor ingredients. Also the international Joint Food and Agriculture Organization (FAO) and World Health Organization (WHO) Expert Committee on Food Additives (JECFA, 2000) have assessed these materials and found them to have no safety concerns [10].
Both cinnamic acid and cinnamaldehyde exist in two conformational isomers, s-cis and s-trans. The s-trans isomer of cinnamic acid is of interest due to its use in flavoring [11]. The s-trans isomer of cinnamic acid can be synthesized as well as isolated from natural sources such as the extract of essential oils of basil, cinnamon, melaleuca bracteata, alpinina galanga, peru balsam, storax and cocoa leaves, fruit (strawberry and starfruit), cognac, beer, and loquat. However, the s-cis isomer has been found in alpinia malaccensis, Rose [11]. The s-trans cinnamaldehyde is the most abundant component of the bark oil extract [1]. Over the years, cinnamic acid and cinnamaldehyde have been investigated experimentally and theoretically [12-20]. Lamb et al. have investigated the UV spectra of cinnamic acid at different pH levels. As a result, they have obtained a procedure to assess the cinnamic acid in plant tissues [12]. The molecular structure and reactivity of cinnamic acid have been investigated using B3LYP/6-31G** [13]. Furthermore, the effect of alkali metals such as Li, Na, K, Rb, and Cs on the electronic structure of cinnamic acid has been studied both experimentally (FT-IR, FT-Raman, 13C and 1H NMR spectroscopy) and theoretically, and the increase in the total electron density of the cinnamate has been reported [14]. Moreover, a good correlation has been found between the calculated and observed NMR chemical shifts (13C and 1H) in dimethyl sulfoxide and methanol [20]. S-trans cinnamaldehyde is found to be the source of the strong odor of cinnamon and gives it a sweet taste [8]. Sirichote et al. have studied the experimental and theoretical FT-IR of s-trans-cinnamaldehyde using different semi-empirical methods [16]. The s-trans cinnamaldehyde has been isolated from cinnamomum zeylanicum bark oil and investigated using FT-IR spectrometry and HPLC analysis [18093;. The physico-chemical characteristics of the isolated cinnamaldehyde from cinnamon essential oil have been reported [8]. Cinnamaldehyde and cinamyl acetate were isolated from cinnamon oil via adsorption onto an-cyclodextrin polyurethane polymer, and their structures were studied experimentally as well as theoretically using the DFT B3LYP function with a 6-31G (d) basis set [21]. The result shows that the DFT method gave a satisfactory result in terms of accuracy and execution time. Chang et al. have investigated the characteristics and hazards of the cinnamaldehyde oxidation process [22].
In this paper, we investigated the structural parameters, conformational preference, and vibrational and electronic spectra of cinnamic acid and cinnamaldehyde in the gas phase. Because real systems are neither isolated nor separated from their surroundings, it is important to investigate the solubility of the titled molecules because the preferred conformation of conformational isomers may change depending on the solvent [23-25]. Thus, we paid special attention to the influence of solvation on conformational preference using nine different solvents characterized by their dielectric constants. To the best of our knowledge, the solvation effects on the conformational stability and molecular structures of cinnamaldehyde have not yet been studied. Therefore, this work is set to provide a complete and systematic theoretical study of both cinnamic acid and cinnamaldehyde. The influence of different solvents on the conformational stability of cinnamic acid and cinnamaldehyde is also investigated using the IEF-PCM (Integral Equation Formalism Polarized Continuum Model).
Computational methods
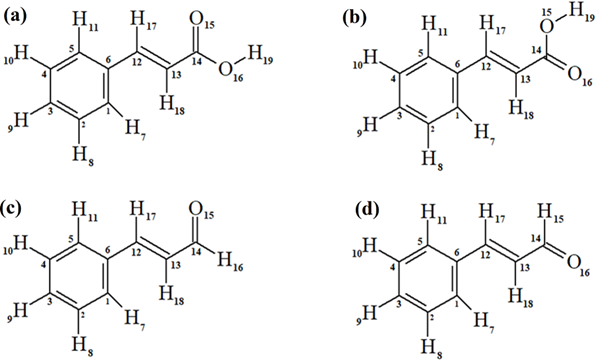
The Gaussian 09 program suit [26] was used to optimize and predict the conformational preference, energy, and vibrational wavenumbers of the s-cis and s-trans conformational isomers of cinnamic acid and cinnamaldehyde shown in Fig. 1. The calculations were performed at DFT using B3LYP hybrid functional along with the 6-311++G (d, p) basis set [27-29] to enable a very fast and reliable prediction of the calculated energies. In addition, this level of calculation has been successfully used for accurate prediction of the molecular structures, electronic and vibrational properties of different organic compounds [23-24]. The optimization of the initial structure generated from GaussView [30] does not always give the minimum energy structure [31]. Thus, to establish the minimum energy conformers, the barrier to internal rotation along a defined dihedral angle was carried out using the B3LYP/6-311++G(d,p) method. The potential energy scans were obtained by optimizing the total energy at a fixed dihedral angle ((C12C13(C14O15) from the initial angle of 0° and increasing by 15° until 360°. Frequency computation (without geometry constraint) was carried out using the minimum energy configurations from the potential energy profile of the molecules. The structures of s-cis cinnamic acid and s-trans cinnamaldehyde are confirmed to be local minima structures with no imaginary wavenumbers. Transition states were optimized at the same level of theory and characterized by the presence of an imaginary frequency. The relative energy ∆E of the conformers is given by ∆E= ∆E s-cis - ∆E s-trans . Solvation effects on the conformational stability were investigated using nine solvents with different dielectric constant values (ε). For solvation studies, solvents with a wide range of dielectric constant values are used, starting with a non-polar solvent (heptane, ε = 1.92) and increasing the polarity gradually to polar solvents (water, ε = 78.39). The dielectric constant values of 1.92 for heptane, 4.90 for chloroform, 7.58 for tetrahydrofuran, 10.36 for dichloroethane, 20.70 for acetone, 24.55 for ethanol, 32.63 for methanol, 46.70 for dimethylsulfoxide, and 78.39 for water are used for the calculations. To consider the solvation, we used the IEF-PCM of the SCRF [32-38] as implemented in the Gaussian 09 program package. The IEF-PCM method, which gives a good representation of solute-solvent systems has been successfully used for accurate prediction of the conformational stability of different organic compounds [23-25]. In this model, the universal force field is used to construct the molecular cavity in which the cavity adapts the shape of interlocking spheres centered on the solute atoms with radii equal to the van der Waals radii of atoms scaled by a factor of 1.1. Solvation energy, (ΔE sol) is the difference between the energy of the molecule in the continuum ∆E (PCM) and the energy of the molecule in the gas phase ∆E (gas phase). ∆E sol = ∆E(PCM) ( ∆E(gas phase). The VEDA 4 program [39] was used to determine the assignments of the calculated vibrational modes based on potential energy distribution (PED) using appropriate coordinates of the molecule as previously described [40]. The more stable structures were used to compute the NMR chemical shifts (1H and 13C) in the gas phase, dimethylsulfoxide (DMSO), and chloroform with the Gauge Invariant Atomic Orbitals (GIAO) method using the optimized geometrical parameters. The optimized structural parameters were also used for the calculation of the electronic absorption wavelengths and their corresponding oscillator strengths were calculated using the time-dependent DFT (TD-DFT) in the gas phase, chloroform, methanol, and water. The natural atomic orbitals (NBO), and HOMO-LUMO energies were also reported in this study.
Results and discussion
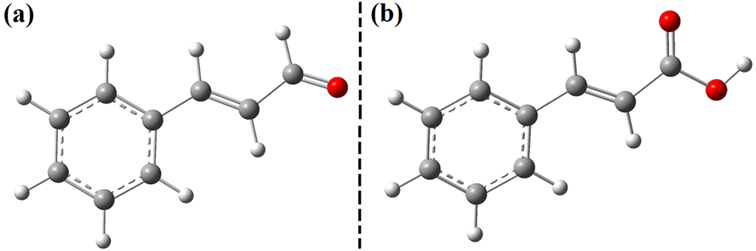
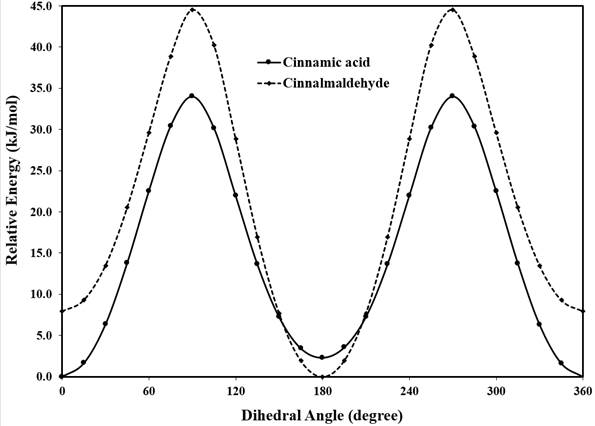
Table 1 summarizes the total energies of s-cis, s-trans, and transition states in the gas phase for cinnamic acid and cinnamaldehyde (in kJ/mol). The relative energy ∆E (E s-cis - E s-trans ) and rotational barrier are given in kJ/mol. For cinnamic acid, the s-cis conformer is more stable than the s-trans conformer by -2.34 kJ/mol. However, a previous study has reported that cinnamic acid commonly occurs in the s-trans configuration [2]. On the other hand, the s-trans conformer of cinnamaldehyde is more stable than the s-cis conformer by 7.95 kJ/mol. The results indicate that the substitution of the hydroxyl group (OH) attached to the carbonyl group by (H) in cinnamic acid does affect the conformational preference. To perceive the internal rotation of (-CO2H functional group in cinnamic acid) and (-COH functional group in cinnamaldehyde) around C-C single bond, the dihedral angles ϕ (C12C13(C14O15), in cinnamic acid and cinnamaldehyde were varied from ϕ = 0º (OC-s-cis corresponding to a configuration in which the exocyclic double bond is s-cis to the carbonyl group) to ϕ = 180º (OC s-trans corresponding to a configuration in which exocyclic double bond is s-trans to the carbonyl group). Geometry optimization was then carried out at the ground state without any geometry constraints, and the minimum structures (Fig. 2) were confirmed by the absence of imaginary wavenumbers. The potential energy scans of the two molecules as a function of the dihedral angle (ϕ) are depicted in Fig. 3. The transition states occur at the dihedral angles of about 90º for both cinnamic acid and cinnamaldehyde.
Table 1 Calculated absolute energy (in kJ/mol), relative energy (kJ/mol), and rotational barrier (kJ/mol) for cinnamic acid and cinnamaldehyde in gas phase.
| Parameter | Cinnamic acid | Cinnamaldehyde |
|---|---|---|
| Total Energy (s-cis) | -1308474.361 | -1110822.735 |
| Total Energy (s-trans) | -1308472.044 | -1110830.669 |
| Energy (Transition State) | -1308440.360 | -1110786.154 |
| Relative Energy | -2.34 | 7.95 |
| s-trans-s-cis Rotational Barrier | 31.67 | 44.52 |
| s-cis-s-trans Rotational Barrier | 34.02 | 36.57 |
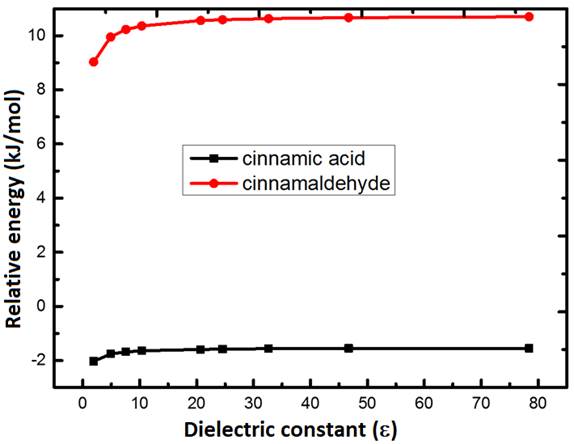
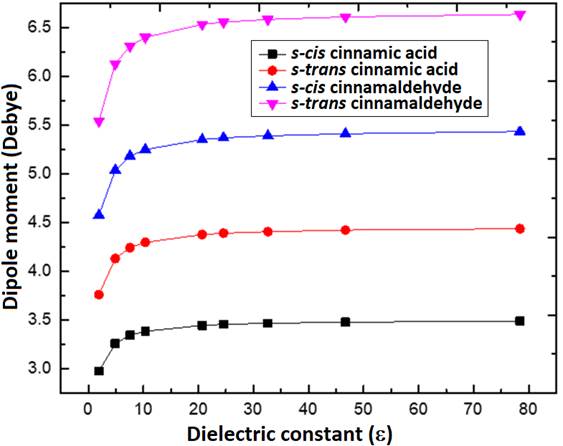
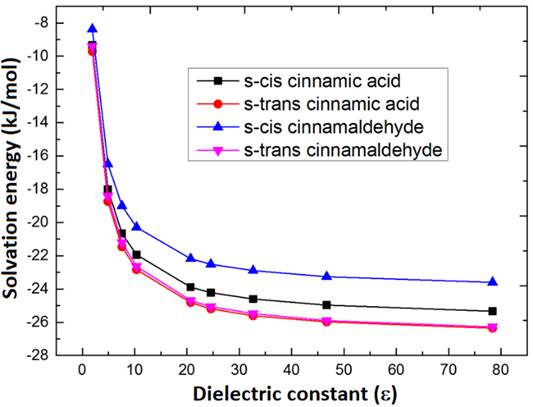
The computed relative energies ∆E (E s-cis ( E s-trans ) of cinnamic acid and cinnamaldehyde in the gas and solvents are reported in Table 2. For both cinnamic acid and cinnamaldehyde, the solvent effect is not enough to change the conformational stability. Therefore, s-cis cinnamic acid and s-trans cinnamaldehyde are energetically favored in solution as well as in the gas phase. The s-cis(s-trans relative energy of cinnamic acid decreases with an increase in the solvent polarity from a value of -2.03 kJ/mol in a non-polar heptane solvent to a value of -1.55 kJ/mol in a polar water medium (Table 2). While the relative energy of cinnamaldehyde increases from 8.01 kJ/mol in heptane to 10.70 kJ/mol in water medium. This implies that the stability of the s-trans conformers of the two molecules increases in the solvent medium, but the solvent effect is not large enough to make the s-trans of cinnamic acid more stable than the s-cis. Fig. 4 represents the variation of relative energies with the dielectric constant of the solvents. For both the acid and the aldehyde the relative energy increases as the dielectric constant of the solvent increases, but the aldehyde has higher energy than the aldehyde because the acid is more soluble in the PCM than the aldehyde. The dipole moments of cinnamic acid and cinnamaldehyde are reported in Table 2. For both compounds, the dipole moments of the s-trans isomers are higher than those of the s-cis isomers, and the dipole moment of both s-cis and s-trans isomers increases with the increase in the dielectric constant of the solvents. Nevertheless, the overall values of the dipole moments increase in solution, and this is not surprising because the PCM predicts an increment of the dipole moment for small organic molecules by up to 30% in aqueous solution compared to gas phase values [41]. Fig. 5 illustrates the variation of the dipole moment with dielectric constant of the solvents. The s-trans conformers of both cinnamic acid and cinnamaldehyde are more soluble within the PCM compared to the s-cis conformer. Even though cinnamic acid has two electronegative oxygen atoms, but the hydroxyl (OH) and carbonyl (CO) of the acid are not in the same plane. Thus, the dipole moment of the acid is less than that of the aldehyde because the two oxygen atoms in the acid cancel each other out. Solvation energies are reported in Table 2. Fig. 6 represents the variation of the solvation energy with the dielectric constant of the solvent. In the PCM, the interaction between the solvent and the solute is strictly electrostatic, meaning that the solute has a certain charge distribution, which polarizes the solvent and the solute. Therefore, within the PCM, structures with polarized charge distributions should be energetically preferred. The dipole moment allows us to somewhat quantify this impact. As such, the s-trans conformers of both cinnamic acid and cinnamaldehyde, which have higher dipole moments, are more soluble within the PCM compared to the Moreover, the solvation energies of the s-trans cinnamaldehyde and cinnamic acid in the different media are very close, but the solvation energy of the aldehyde is slightly higher.
Table 2 Calculated relative energy (∆E = E s-cis - E s-trans ) (in kJ∕mol), dielectric constant (ε), dipole moment (μ) (in Debye), and solvation energy (∆Esol) of cinnamic acid and cinnamaldehyde in different phases.
| medium | ε | Cinnamic acid | Cinnamaldehyde | ||||||||
|---|---|---|---|---|---|---|---|---|---|---|---|
| ∆E | ∆Esol | µ | ∆E | ∆Esol | µ | ||||||
| s-cis | s-trans | s-cis | s-trans | s-cis | s-trans | s-cis | s-trans | ||||
| Gas phase | - | -2.33 | - | - | 11.09 | 14.02 | 8.01 | - | - | 17.07 | 20.59 |
| Heptane | 1.92 | -2.03 | -9.33 | -9.71 | 12.47 | 15.73 | 9.03 | -8.37 | -9.41 | 19.16 | 23.18 |
| Chloroform | 4.90 | -1.76 | -18.00 | -18.74 | 13.64 | 17.28 | 9.95 | -16.48 | -18.41 | 21.09 | 25.65 |
| THF | 7.58 | -1.68 | -20.66 | -21.46 | 14.02 | 17.74 | 10.23 | -19.00 | -21.21 | 21.67 | 26.40 |
| Dichloroethane | 10.36 | -1.64 | -21.94 | -22.84 | 14.18 | 17.99 | 10.36 | -20.29 | -22.64 | 21.97 | 26.78 |
| Acetone | 20.70 | -1.59 | -23.89 | -24.81 | 14.43 | 18.33 | 10.56 | -22.18 | -24.69 | 22.38 | 27.32 |
| Ethanol | 24.55 | -1.58 | -24.22 | -25.19 | 14.48 | 18.37 | 10.59 | -22.51 | -25.06 | 22.47 | 27.45 |
| Methanol | 32.63 | -1.56 | -24.60 | -25.61 | 14.52 | 18.45 | 10.63 | -22.89 | -25.48 | 22.55 | 27.53 |
| DMSO | 46.70 | -1.55 | -24.97 | -25.98 | 14.56 | 18.49 | 10.67 | -23.26 | -25.90 | 22.64 | 27.66 |
| Water | 78.39 | -1.55 | -25.34 | -26.36 | 14.60 | 18.58 | 10.70 | -23.60 | -26.28 | 22.72 | 27.74 |
Some of the structural parameters obtained from geometry optimization for the s-cis/s-trans cinnamic acid and cinnamaldehyde are listed in Table S1 of the supplementary information. For cinnamic acid, the calculated geometric parameters are in good agreement with the previous results [20]. For both cinnamic acid and cinnamaldehyde, the calculations revealed that there are no significant changes in the bond lengths of the (s-cis /s-trans) of the same molecule; all the bond lengths are almost equal. The nature of the functional groups (-COOH and -COH) has no noteworthy effect on the structural parameters of the two molecules. The carbonyl (C=O) bond lengths in s-cis/s-trans cinnamaldehyde are ca. 1.22 Å and 1.21 Å, respectively. The presence of the substituents (C2H2COOH and C2H2COH) on the benzene ring affects the C-C bond distance for the benzene ring of the two molecules. The C-C bond distances in the aromatic ring were found to be in the range of 1.39 Å to 1.41 Å. Moreover, for both compounds, there are no significant changes in the C-C-C bond angles in the aromatic ring of the (s-cis /s-trans) of the same molecule. The average C-C-C bond angles in the aromatic ring were found to be in the range of 118.2° to 120.7° for both cinnamic acid and cinnamaldehyde, respectively.
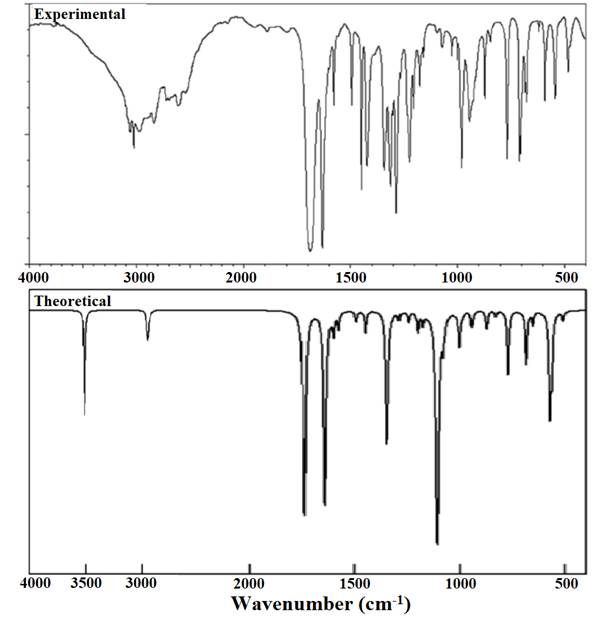
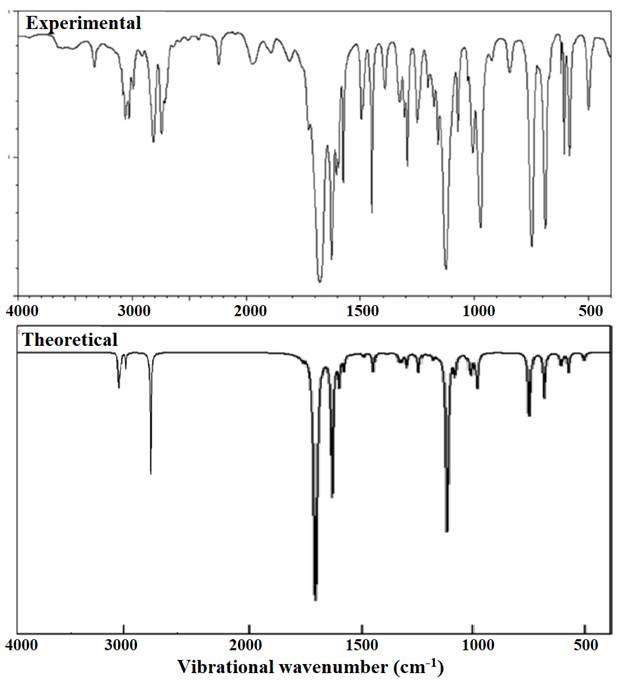
The vibrational wavenumbers and their intensities are used for the simulation of the vibrational IR and Raman spectra of the two molecules. Figures 7-10 represent the simulated IR and Raman spectra of cinnamic acid and cinnamaldehyde along with their experimental IR and Raman spectra obtained from the spectra database for organic compounds, SDBS website [42]. The simulated IR and Raman spectra of the molecules matched the experimental FTIR and Raman spectra of the two molecules. The vibrational IR and Raman spectra of the two molecules are dominated by the high intensity of the carbonyl (C=O) group stretching mode. This band is calculated to be at 1739 and 1709 cm-1 for cinnamic acid and cinnamaldehyde, respectively. These carbonyl bands are observed to be at 1688 and 1727 cm-1 in the IR spectrum of cinnamic acid and cinnamaldehyde, respectively. The OH broadband of cinnamic acid at around 3000 cm-1 in the experimental IR spectrum is calculated to be 3599 cm-1. The CH stretching modes of the phenyl rings of cinnamic acid observed at 3067/3027/2977 cm-1 are calculated to be in the range of 3054-3006 cm-1. The values are similar to CH stretching modes for cinnamaldehyde, which are observed at 3047 - 2743 cm-1 and calculated to be at 3045 - 2744 cm-1. The olefinic C=C stretching modes, which are observed at 1688 and 1627 cm-1 in the vibrational spectra of cinnmic acid and cinnamaldehyde, are calculated to be at 1640 and 1633 cm-1 respectively. In general, the calculated IR and Raman spectra of the two molecules show good agreement and a strong correlation with the experimental spectra. The characteristic peaks of the major functional groups are evident in the spectra of the molecules.
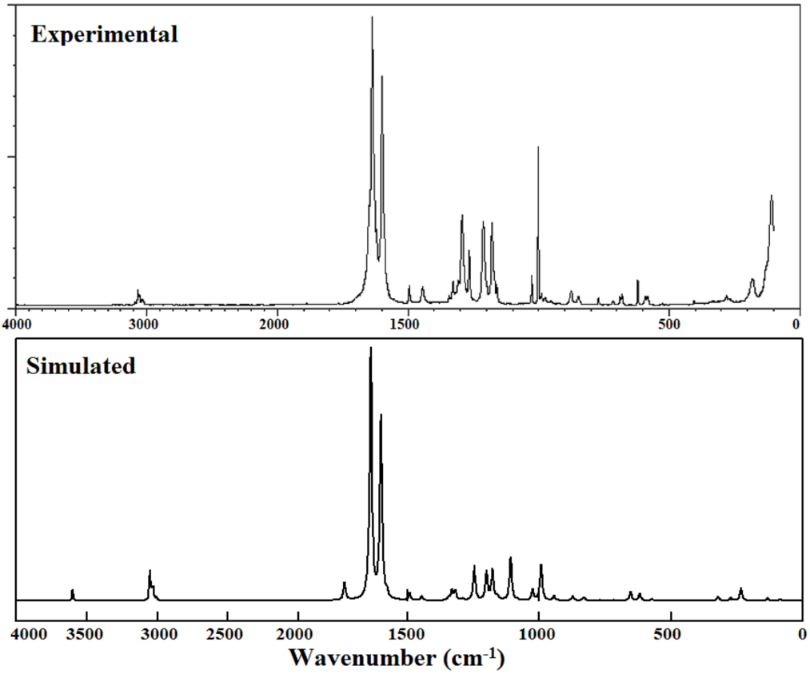
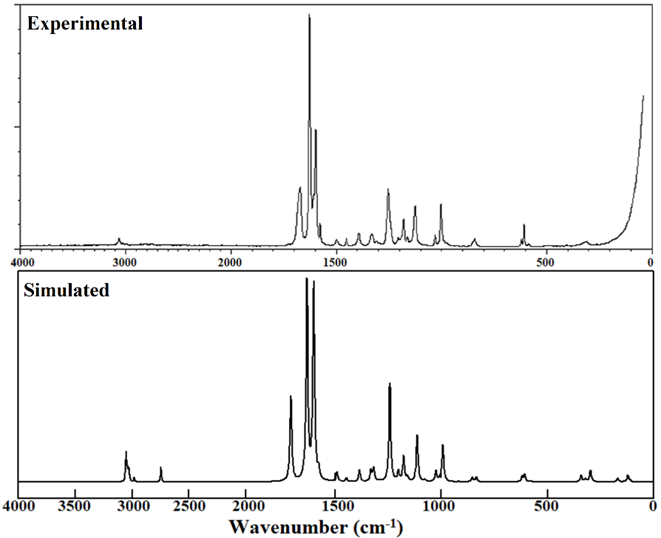
The maximum number of normal modes of a nonlinear molecule is equal to (3N-6), with N the number of atoms in the molecule, and 6 represents the subtraction of three translational and three rotational degrees of freedom [43-45]. Cinnamic acid is composed of 19 atoms and thus has 51 normal modes of vibrations, while cinnamaldehyde has 18 atoms with 48 normal modes of vibrations. The scaled vibrational wavenumbers (51 modes for cinnamic acid and 48 modes for cinnamaldehyde) and some of their corresponding experimental values for the more stable conformers of the two molecules are presented in Table S2 for cinnamic acid and Table S3 for cinnamaldehyde. The assignments of the vibrational modes that were calculated based on the potential energy distribution (PED) using the VEDA4 program [34] are presented in the last column of Tables S2 and S3. The calculated vibrational mode (v1) at 3559 cm-1 in the vibrational data of cinnamic acid is a pure OH stretching mode with a PED value of 100 %. However, the high intensity carbonyl frequencies of cinnamic acid and cinnamaldehyde have a 79% and 89 % contribution to PED, respectively. All the C-H stretching vibrational modes of cinnamic acid (v2-v8) and cinnamaldehyde (v1-v8) are calculated to be between 2744 cm-1 and 3054 cm-1 with a PED of 78 % to 99 %. The C=C stretching modes which are observed at 1631 cm-1 for cinnamic acid and 1627 cm-1 for cinnamaldehyde are calculated to be 1631 and 1627 cm-1 with about 61% and 58% contributions to PED. The detailed descriptions of other vibrational modes along with their percentage contributions to the PED are provided in the last column of Tables S2 and S3. The assignments are supported and confirmed by the visual inspection of the vibrational modes of the GassView program. The obtained vibrational wavenumbers for s-cis cinnamic acid are in agreement with the previous study [20], while the vibrational wavenumbers for s-trans isomers of cinnamic acid are in agreement with results reported by Kalinowska et al [14].
The 13C and 1H NMR chemical shift calculations are very important quantum chemical tools in the identification and characterization of organic compounds. The GIAO method of the Gaussian program is a well-known method that has been used for the reliable calculations of the NMR (13C and 1H ) of organic compounds [46,47]. In the current work, the NMR spectra of the more stable structures are computed by the GIAO method using the B3LYP/6-311++G(d,p) in the gas phase, chloroform, and DMSO. Chemical shifts are reported in ppm relative to TMS for 1H and 13C NMR. For the chemical shift of the carbon atoms in the aromatic ring of s-cis cinnamic acid and s-trans-cinnamaldehyde in both chloroform and DMSO, the 13C NMR values are greater than 100 ppm, as would be anticipated [20]. The carbonyl oxygen atom in cinnamic acid and cinnamaldehyde makes the chemical environment of C14 very special and has shown the highest chemical shift values. The chemical shift values of carbonyl carbon atom C14 for cis cinnamic acid are estimated to be around 204.3, 205.0, and 202.4 ppm in chloroform, DMSO, and gas phase, respectively. For s-trans cinnamaldehyde, the chemical shift values of the carbonyl carbon C14 are 226.9, 228.6 and 207.1 ppm in chloroform, DMSO and gas phase respectively. The 13C chemical shifts of carbonyl carbon in s-cis cinnamic acid are in agreement with the range of 150 to 220 ppm reported by Kalsi [40], whereas those of s-trans cinnamaldehyde are higher due to the decrease in the electron-donating and shielding ability of the -H atom of the aldehyde functional group [40]. For both s-cis cinnamic acid and s-trans cinnamaldehyde, the 1H NMR chemical shifts calculated in DMSO and chloroform are almost equal and slightly higher than the calculated values in the gas phase. Furthermore, the H19 in s-cis cinnamic acid has the lowest chemical shift value of 5.7, 5.8 and 5.2 ppm in chloroform, DMSO, and gas phase, respectively, due to its direct attachment to the oxygen of the carboxylic functional group. The chemical shift values of H16 in cinnamaldehyde are calculated to be 10.2, 10.2, and 9.8 ppm in chloroform, DMSO, and gas phase, respectively, due to its direct attachment to the carbonyl group. The 1H chemical shift values of s-cis cinnamic acid are in good correlation with the previous results [20]. The calculated 13C NMR and 1H NMR chemical shifts for s-cis cinnamic acid and s-trans cinnamaldehyde are summarized in Table 3.
Table 3 Calculated 13C and 1H NMR chemical shifts (ppm) for s-cis cinnamic acid and s-trans cinnamaldehyde.
| s-cis cinnamic acid | |||||||
|---|---|---|---|---|---|---|---|
| Atom1 | 13C Chemical shift | Atom1 | 1H Chemical shift | ||||
| Chloroform | DMSO | Gas phase | Chloroform | DMSO | Gas phase | ||
| C1 | 140.1 | 140.3 | 139.6 | H7 | 8.1 | 8.2 | 8.0 |
| C2 | 145.4 | 145.6 | 145.0 | H8 | 7.4 | 7.4 | 7.2 |
| C3 | 148.2 | 148.6 | 147.1 | H9 | 7.4 | 7.5 | 7.2 |
| C4 | 146.6 | 146.7 | 146.2 | H10 | 7.3 | 7.4 | 7.2 |
| C5 | 145.9 | 146.1 | 145.3 | H11 | 7.4 | 7.4 | 7.2 |
| C6 | 154.7 | 154.5 | 155.3 | H17 | 8.2 | 8.3 | 8.2 |
| C12 | 174.4 | 174.8 | 172.9 | H18 | 7.1 | 7.2 | 7.0 |
| C13 | 137.9 | 137.9 | 138.0 | H19 | 5.7 | 5.8 | 5.2 |
| C14 | 204.3 | 205.0 | 202.4 | ||||
| s-trsns cinnamaldehyde | |||||||
| Atom1 | 13C Chemical shift | Atom1 | 1H Chemical shift | ||||
| Chloroform | DMSO | Gas phase | Chloroform | DMSO | Gas phase | ||
| C1 | 148.2 | 148.8 | 147.4 | H7 | 7.3 | 7.4 | 7.4 |
| C2 | 146.5 | 147.0 | 144.8 | H8 | 7.3 | 7.4 | 7.3 |
| C3 | 146.1 | 146.7 | 148.8 | H9 | 7.4 | 7.4 | 7.3 |
| C4 | 155.3 | 155.5 | 151.3 | H10 | 8.0 | 8.0 | 7.9 |
| C5 | 140.1 | 140.5 | 141.5 | H11 | 7.4 | 7.4 | 7.4 |
| C6 | 145.7 | 146.0 | 144.4 | H16 | 10.2 | 10.2 | 9.8 |
| C12 | 174.4 | 176. 1 | 169.9 | H17 | 7.6 | 7.6 | 6.7 |
| C13 | 156.7 | 156.6 | 144.4 | H18 | 7.6 | 7.8 | 7.1 |
| C14 | 226.9 | 228.6 | 207.1 | ||||
1The numbering of atoms is provided in Fig. 1.
The highest occupied molecular orbital (HOMO) and the lowest unoccupied molecular orbital (LUMO) play an important role in their optical properties, electric properties, electronic properties, and quantum chemistry [30]. The TD-DFT calculations have been used to reliably calculate the electronic absorption spectra of organic compounds [47,48]. In this study, TD-DFT calculations of electronic absorption were used to calculate and simulate the UV-visible spectra of the more stable conformers of cinnamic acid and cinnamaldehyde in vacuum and solvent medium (chloroform, methanol, and water). For the s-cis cinnamic acid, the strong transition in chloroform is at 310.14 nm with an oscillator strength of 0.5891, in methanol at 309.98 nm with an oscillator strength of 0.5623, whereas in water it is at 310.22 nm with an oscillator strength of 0.5630, and in the gas phase at 302.5 nm with an oscillator strength of 0.0005. This absorption band is attributed to the HOMO-LUMO transition, with a molecular orbital contribution of 98 % in all solvents (Table 4). In comparison to the previous study, the transitions in the gas phase happen at higher wavelengths, they occur at 302.50, 296.57, and 284.36 nm, while in the former investigation the transitions occur at 284.44, 279.82, and 276.97 nm [20]. For s-trans cinnamaldehyde, the maximum absorption has been calculated to be around 353 nm in chloroform, 347 nm in methanol, and 347 nm in water. This absorption band is attributed to the HOMO-LUMO transition but will be unlikely to be observed experimentally due to its weak oscillator strength of 0.0001. The calculated absorption wavelength (λ), oscillator strength (f), and excitation energy (E) of the s-cis cinnamic acid and s-trans cinnamic acid along with the assignments of the transitions are presented in Table 4. Fig. 11 (a-c) illustrates the simulated UV-visible spectra of s-cis cinnamic acid in chloroform, methanol, and water, respectively, and Fig. 11(e-g) shows the calculated UV spectra of s-trans cinnamaldehyde in chloroform, methanol, and water, respectively.
Table 4 The calculated absorption wavelength (λ), Oscillator strength (f), excitation energy (E) for s-cis cinnamic acid and s-trans cinnamaldehyde.
| s-cis cinnamic acid | |||
|---|---|---|---|
| λ (nm) | E (ev) | f | Assignment (contribution ( 10%) |
| Chloroform | |||
| 310.14 | 3.9977 | 0.5891 | H→L (98%) |
| 292.10 | 4.2446 | 0.0399 | H→L+1(90%) |
| 291.91 | 4.2474 | 0.0009 | H→L+3(93%) |
| Methanol | |||
| 309.98 | 3.9998 | 0.5623 | H→L(98) |
| 294.11 | 4.2155 | 0.0475 | H→L+1(92%) |
| 288.59 | 4.2962 | 0.0001 | H→L+3(95%) |
| Water | |||
| 310.22 | 3.9967 | 0.5630 | H→L(98) |
| 294.36 | 4.2120 | 0.0479 | H→L+1(92%) |
| 288.24 | 4.3014 | 0.0001 | H→L+3 (95%) |
| s-trans cinnamaldehyde | |||
| λ (nm) | E (ev) | f | Assignment (contribution ( 10%) |
| Chloroform | |||
| 353.23 | 3.5100 | 0.0001 | H→L(94%) |
| 306.22 | 4.0489 | 0.6380 | H→L+2(98%) |
| 290.69 | 4.2651 | 0.0444 | H→L+3(91%) |
| Methanol | |||
| 347.38 | 3.5692 | 0.0001 | H→L(94%), |
| 305.92 | 4.0528 | 0.6094 | H→L+2(97%) |
| 292.56 | 4.2378 | 0.0518 | H→L+3(91%) |
| Water | |||
| 346.75 | 3.5756 | 0.0001 | H→L(94%) |
| 306.16 | 4.0496 | 0.6108 | H→L+2(97%) |
| 292.78 | 4.2347 | 0.0519 | H→L+3(91%) |
The HOMO and LUMO are significant parameters that are used to predict the most reactive position in π
The dipole moment, polarizability, and electronic structures are structural properties that are affected by the charge on the atoms of a molecular system. Therefore, atomic charge calculation has an important role in quantum chemical calculations of molecular systems [49-52]. The NBO charge distributions calculated at the B3LYP/6-311++G (d, p) level for the more stable structures of cinnamic acid and cinnamaldehyde are listed in Table 5. As evident in the table, the positive charges are largely localized on the hydrogen atoms of the molecules, while the carbon atoms are all negatively charged except for C14, which is the carbon atom that is bonded to the carbonyl oxygen. The oxygen atom, which is electron-withdrawing by inductive effect, is negatively charged. The charge magnitude of the carbonyl carbon atom (C14) was found to be 0.773e/0.758e for the s-cis/s-trans cinnamic acid and 0. 393e/0.387e for the s-cis/s-trans cinnamaldehyde. The high values for the s-cis/s-trans cinnamic acids are due to the electron-withdrawing effect of the two oxygen atoms attached to C14, as opposed to the C14 of cinnamaldehyde, which has only one oxygen atom.
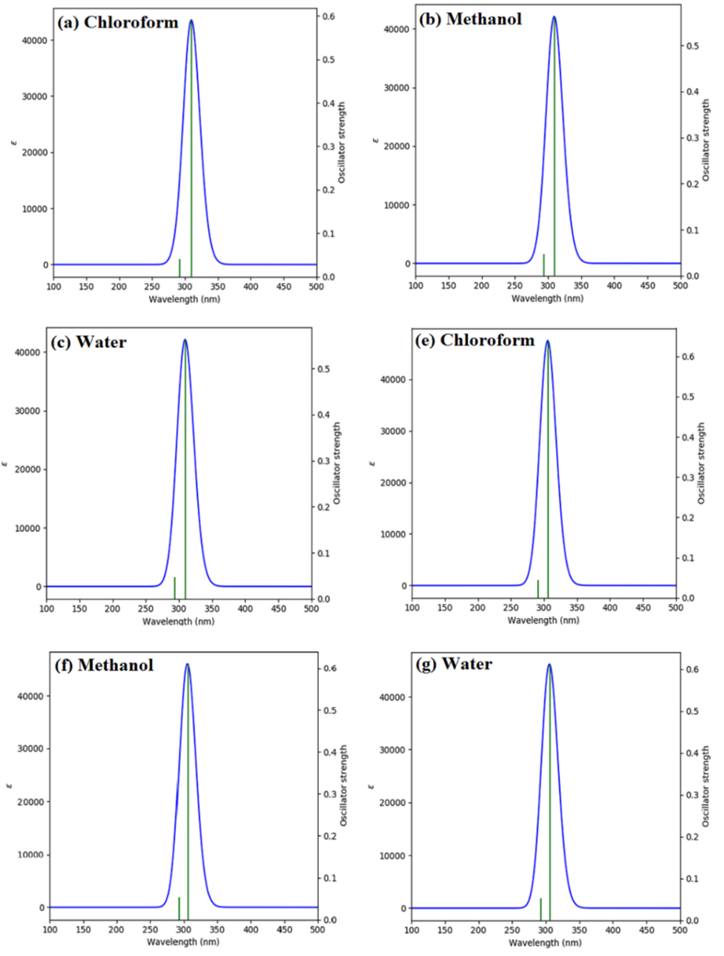
Fig. 11 Simulated UV spectra of s-cis cinnamic acid (a-c) and s-trans cinnamaldehyde (e-f) computed at B3LYP/6-311++G (d, p) level in chloroform, methanol, and water.
Table 5 Calculated gas phase NBO atomic charges of s-cis and s-trans cinnamic acid and cinnamaldehyde.
| Atoms | Cinnamic acid | Atoms | Cinnamaldehyde | ||
|---|---|---|---|---|---|
| s-cis | s-trans | s-cis | s-trans | ||
| C1 | -0.178 | -0.196 | C1 | -0.190 | -0.196 |
| C2 | -0.188 | -0.166 | C2 | -0.189 | -0.182 |
| C3 | -0.189 | -0.096 | C3 | -0.179 | -0.200 |
| C4 | -0.191 | -0.164 | C4 | -0.079 | -0.163 |
| C5 | -0.177 | -0.201 | C5 | -0.177 | -0.100 |
| C6 | -0.079 | -0.185 | C6 | -0.191 | -0.163 |
| H7 | 0.199 | 0.208 | H7 | 0.204 | 0.209 |
| H8 | 0.205 | 0.205 | H8 | 0.204 | 0.208 |
| H9 | 0.205 | 0.205 | H9 | 0.198 | 0.209 |
| H10 | 0.206 | 0.209 | H10 | 0.207 | 0.204 |
| H11 | 0.207 | 0.207 | H11 | 0.205 | 0.207 |
| C12 | -0.084 | -0.106 | C12 | -0.085 | -0.109 |
| C13 | -0.299 | -0.294 | C13 | -0.301 | -0.278 |
| C14 | 0.773 | 0.758 | C14 | 0.393 | 0.387 |
| O15 | -0.609 | -0.596 | O15 | -0.556 | -0.532 |
| O16 | -0.714 | -0.701 | H16 | 0.126 | 0.195 |
| H17 | 0.223 | 0.485 | H17 | 0.220 | 0.206 |
| H18 | 0.203 | 0.215 | H18 | 0.190 | 0.097 |
| H19 | 0.488 | 0.213 | |||
Conclusion
The structural parameter, conformational stability, NMR spectroscopic properties, and vibrational IR and Raman spectra, electronic absorption spectra, frontier molecular orbitals, and NBO atomic charges for the s-trans and s-cis conformers of cinnamic acid and cinnamaldehyde have been studied in this work using the Gaussian 09 package and with the aid of B3LYP/6-31++G (d, p). The solvent effects are investigated using nine different solvents characterized by their different values of dielectric constants. We modeled the solvent effects with the IEF-PCM model. The influence of the solvent is not effective enough to change the conformational preferences of both cinnamic acid and cinnamaldehyde. The gas phase potential energy scans are obtained for the internal rotations of the dihedral angles ((C12C13(CO2H) in cinnamic acid and ϕ (C12C13(COH) in cinnamaldehyde. From the computation results, s-cis cinnamic acid and s-trans cinnamaldehyde are found to be more stable conformers in the gas phase and solvent medium. The optimized geometrical parameters, UV-visible spectra (in chloroform, methanol, water, and in the gas phase), proton and carbon-13 NMR chemical shifts (in chloroform and DMSO solvent), HOMO and LUMO in (DMSO, methanol, water, and in the gas phase), NBO charges, and simulated vibrational wavenumbers are reported. This precise and invaluable structural, vibrational, and electronic data obtained from this study could be a good reference for any future experimental studies and in the development of new derivatives of these important molecules.

