


Serviços Personalizados
Journal
Artigo
 texto em
  Inglês (pdf)
 Artigo em XML
 Referências do artigo
 Enviar este artigo por email
Indicadores
-
 Citado por SciELO
 -
 Acessos
Links relacionados
-
 Similares em
SciELO
Similares em
SciELO
Compartilhar

 Permalink
Tecnología y ciencias del agua
versão On-line ISSN 2007-2422
Tecnol. cienc. agua vol.9 no.5 Jiutepec Set./Out. 2018 Epub 24-Nov-2020
https://doi.org/10.24850/j-tyca-2018-05-04
Articles
Hydrological modeling using observed and satellite precipitation datasets for the Ilave River basin, 2011-2015 period, Puno, Peru
1Instituto Geofísico del Perú (IGP), Subdirección de Ciencias de la Atmósfera e Hidrósfera (SCAH), Lima, Perú, rzubieta@igp.gob.pe
2Universidad Nacional Agraria La Molina (UNALM), Programa de Doctorado en Recursos Hídricos, Lima, Perú, 20140761@lamolina.edu.pe
3Autoridad Nacional del Agua (ANA), Autoridad Administrativa del Agua Titicaca, Puno, Perú, wilfer.lv@gmail.com
4Servicio Nacional de Meteorología e Hidrología, (SENAMHI), Lima, Perú, waldo.lavado@gmail.com
Precipitation datasets obtained from satellites can be useful in regions where rainfall is very heterogeneous, such as Peruvian Andes, which is usually poorly monitored. The objective of this study is to characterize the main hydrological variables and to understand the potential of precipitation estimates based on satellite datasets for hydrological modeling. This article evaluates the usefulness of estimated precipitation from observed (rain gauges) and satellites datasets (TMPA V7 and TMPA RT products of the TRMM satellite) as input in GR2M hydrological model to simulate monthly streamflows between 2011-2015 for the Ilave River basin located in the Peruvian Altiplano. The results from observational datasets indicate a deficit of streamflows due to decreased rainfall during wet season (~ 50%), whereas evapotranspiration is greater during dry season (~ 24%). Our results show that TMPA V7 has a higher similarity with respect to precipitation observed during wet season. Results also indicate that GR2M perform better with observed inputs and when TMPA-V7 precipitation datasets are used, while the opposite occurs with TMPA RT dataset. This poor performance of the hydrological model may be due to inadequate rainfall estimation in the water balance.
Keywords Precipitation datasets; Hydrological modeling; Andes; TRMM; Satellite
Los datos obtenidos mediante satélites acerca de la precipitación pueden ser útiles en regiones donde ésta es muy heterogénea, como, por ejemplo, en los Andes, pues por lo general son escasamente monitoreadas. El objetivo de este estudio es precisar las características de las principales variables hidrológicas, y comprender el potencial de datos de precipitación estimados a partir del satélite en modelación hidrológica. Este artículo evalúa datos de precipitación obtenidos a partir de pluviómetros y satélites (productos TMPA V7, TMPA RT del satélite TRMM), como entrada al modelo hidrológico agregado GR2M, para simulación de caudales mensuales, en el periodo 2011-2015, en la cuenca del río Ilave, en el Altiplano peruano. Los resultados mostraron un claro déficit hídrico de caudales debido a la disminución de las precipitaciones en el periodo de avenidas (~ 50%); además de un aumento de la evapotranspiración en el periodo de estiaje (~ 24%). Los resultados del análisis de datos de precipitación también indicaron que los TMPA V7 presentan mayor similitud que TMPA RT, con respecto a la precipitación observada en el periodo de avenidas. Del mismo modo, los resultados de modelación hidrológica con GR2M indicaron un mayor rendimiento a partir de la lluvia observada (pluviómetros) y TMPA V7, los cuales presentan una mayor similitud con caudales observados; a diferencia de los TMPA RT, es posible que los inconvenientes en el rendimiento se debieran a una inadecuada lluvia en el balance hídrico.
Palabras clave precipitación; modelación hidrológica; Andes; TRMM; satélite
Introduction
In recent decades, global and quasi-global datasets of satellite-based precipitation, terrestrial observations and general circulation models have been developed at different temporal resolutions (Huffman et al., 2007). Precipitation is an important component of the water cycle and a key input for hydrological modeling applications. The reliable quantification of the spatio-temporal distribution of rainfall is fundamental to the analysis of extreme hydrological phenomena, such as droughts and floods, in real time or almost real time. However, measurement networks (meteorological and hydrological) in Altiplano regions may be scarce or even non-existent. In addition, the presence of the Andes contributes to the high spatial variability of rainfall (Espinoza et al., 2009), where large amounts of rainfall can precipitate in a few days, increasing the risk of soil instability, landslides and floods (Coscarelli & Caloiero, 2012; Zubieta & Saavedra, 2013; Zubieta, Saavedra, Silva, & Giraldez, 2017a). Satellite-based precipitation products have increasingly facilitated rainfall estimation in much of the world and have become a complementary alternative for hydrometeorological applications and climate studies in unmonitored regions. These include data from the Tropical Rainfall Measuring Mission (TRMM) Multi-Satellite Precipitation Analysis (TMPA) data (Huffman, Adler, Bolvin, & Nelkin, 2010). TRMM was a mission initiated in 1997 by the National Space Development Agency of Japan (JAXA) and the National Aeronautics and Space Administration (NASA) of the United States. It came to an end on April 8, 2015, as part of its deactivation, having exhausted its energy reserves (https://pmm.nasa.gov/trmm/mission-end). Recently, the usefulness of these data in Andean-Amazon basins has been evaluated mainly by comparing estimated and observed data for both rainfall and streamflow, noting that precipitation data from satellites can be used as input for modeling flows in watersheds (Zulkafli et al., 2014; Zubieta, Getirana, Espinoza, & Lavado, 2015; Milewski, Elikadri, & Durham, 2015; Zubieta, Getirana, Espinoza, Lavado-Casimiro, & Aragon, 2017b). Zulkafli et al. (2014) documents that the performance of hydrological modeling tends mainly to be unsatisfactory for the Andean-Amazonian regions of northern Peru and southern Ecuador. However, better results are obtained for the Andean-Amazonian regions of southern Peru, which are mainly associated with adequate rainfall estimates from satellite (Zubieta et al., 2015).
To assess the usefulness of satellite-based precipitation data, it is necessary to investigate temporal variations in rainfall and its impacts on the hydrological cycle. The variability of the streamflows in Andean basins is consistent with the variability of rainfall on a seasonal and interannual scale. This occurs especially in the Peruvian Andes, which is characterized by different rainfall regimes, due to its latitudinal extension and the presence of the mountain range (Espinoza et al., 2009). For example, rainfall in the basin of the Ramis River in the Peruvian Altiplano shows negative trends of 0.70mm / year, while maximum temperatures show significant positive trends of 0.04ºC / year, on average. Likewise, the minimum temperatures at the basin level present an increase of 0.0004ºC / year (Belizario, 2015). On the other hand, in recent years, the Altiplano region has suffered serious extreme hydrological events, such as intense droughts in 2008 and 2010 (ANA, 2010) and floods in 2012 (RPP Noticias, 2012).
The main objective of this study is to evaluate the capacity of TRMM products TMPA V7 and TMPA RT (real time), for satellite-based precipitation, to represent useful precipitation fields for hydrological modeling of the Ilave River basin (IRB). The IRB is located in the Andes of southern Peru, in the northern region of the Altiplano (69.4W-70.38W; 17.14S 15.8S), with drainage area of 7 790 km2, altitudes ranging from 3 805 to 5 400 meters and an average altitude of 4 300 masl (Figure 1a-b). The average annual rainfall throughout the IRB is between 494 and 888 mm / year, and it has an average flow of 32 m3 / s. The amplitude of the annual precipitation cycle is relatively large, with maximum values that occur between December and February, and minimum values between June and August.

A ground-based precipitation dataset was used for comparison with the satellite estimates. Each precipitation dataset (observed and satellite) was used as input for the GR2M model (Niel, Paturel, & Servat, 2003), which is based on the GR2M model (Edijatno & Michel, 1989; Kabouya, 1990), and adapted by Makhlouf & Michel (1994). Streamflow simulations were compared to observed flows. GR2M has been used to simulate the hydrological behavior of numerous Andean-Amazon basins in Peru (Lavado, Labat, Guyot, Ronchail, & Ordoñez 2009; Lavado, Labat, Guyot, & Ardoin-Bardin, 2011; Vera & Felipe, 2011). Recently, Lujano, Felipe, Lujano and Quispe (2015) showed that TMPA data are feasible to use as input for the GR2M model for the Ramis River basin, which is located northwest of the IRB.
Data used
A daily rainfall dataset was collected from 11 rain stations belonging to the National Meteorology and Hydrology Service of PERÚ (SENAMHI). The data period selected for the hydrological analysis was between 2010 and 2015. However, to ensure the maximum availability of rainfall and hydrometric data, a common period (2011-2015) was selected (Figure 1b, Table 1). To evaluate its quality, this database was composed of a total of 10 rainfall stations on a monthly basis, the regional vector method (RVM) was applied, which uses the concept of extended precipitation averaged over the study period (Hiez, 1977; Brunet-Moret, 1979; Vauchel, 2006).
Table 1 General characteristics of weather stations: latitude (Lat), longitude (Long), altitude (Alt), annual rainfall (rain), maximum temperature (T max), minimum temperature (T min) and the percentage of data availability for the period 2011-2015.
| Sation Name | Lat | Long | Alt | Rain | T max | T min | Availability of data (%) |
|---|---|---|---|---|---|---|---|
| Capazo | -17.19 | -69.74 | 4 530 | 464 | 13.6 | -6.3 | 99.8 |
| Mazo Cruz | -16.74 | -69.72 | 4 003 | 564 | 17.5 | -5.0 | 99.9 |
| Laraqueri | -16.15 | -70.07 | 3 900 | 788 | 16.7 | -1.6 | 99.8 |
| Los Uros | -15.82 | -69.94 | 3 808 | 810 | 15.8 | 3.9 | 99.9 |
| Rincón La Cruz | -15.99 | -69.81 | 3 935 | 872 | 15.3 | 2.7 | 99.9 |
| Ilave | -16.07 | -69.66 | 3 871 | 647 | 15.3 | 1.5 | 99.9 |
| Callacame | -16.57 | -69.32 | 3 951 | 413 | 14.0 | 1.0 | 99.8 |
| Pizacoma | -16.91 | -69.37 | 3 930 | 583 | 17.0 | -0.9 | 99.9 |
| Ichuña | -16.13 | -70.55 | 3 800 | 595 | 20.1 | 2.5 | 99.9 |
| Calacoa | -16.74 | -70.68 | 3 260 | 386 | 25.0 | 4 | 99.8 |
The least squares method was applied to determine an annual regional rainfall index, Zi, and extended average precipitation. For this purpose, this calculation can be made by minimizing the sum of Equation (1), where Pij stands for the annual rainfall in the station j , P j is the average precipitation extended i is the year index, j is the index of the station, N the number of years, and M the number of stations . Finally, the Zi data series is called the annual regional vector of rainfall indices.
Thus, the climate zone was considered the same as the IRB with the same rainfall regime. It is assumed that the annual rainfall in the basin’s stations shows the proportionality between the stations. TRMM provides data derived from its products, which were evaluated in this study. One product used was the TMPA 3B42 version 7 was used, obtained both in real time and near real time from a set of data from many sensors on precipitation satellites (TMPA 3B42 data is available at https://pmm.nasa.gov/data-access/downloads/trmm).
TMPA shows the most successful experience, since its processing has been improved by using data having a better scale than other data sources, which is essential to creating spatial-temporal averages that are appropriate for the user's application (Huffman et al., 2010). The other set of data was taken from TMPA-RT precipitation estimates. Unlike TMPA V7, these data do not include calibration measurements of rain stations, which are incorporated more than one month after the satellite data.
Both TMPA V7 and TMPA RT provide precipitation data with spatial resolution a of 0.25 ° * 0.25 ° and a temporal resolution of 3 hours. Daily rainfall data was collected from 11 rain stations belonging to the National Meteorology and Hydrology Service (SENAMHI). The data period selected for the hydrological analysis was between 2010 and 2015. However, to ensure the maximum availability of rainfall and hydrometric data, we selected a common period (2011-2015) (Figure 1b, Table 1).
To evaluate its quality, this database was composed of a total of 10 rainfall stations on a monthly basis. The regional vector method (RVM) was applied, which uses the concept of average precipitation extended to the study period (Hiez, 1977; Brunet-Moret, 1979; Vauchel, 2006).
Methodology
The GR2M model (Niel et al., 2003) is a lumped hydrological model that requires monthly average information related to climatic variables for a drainage area (Figure 1a). Due to the reduced number of rainfall stations (10) and some unmonitored regions in the basin, precipitation data was interpolated, at the same resolution of the TMPA (0.25 ° * 0.25 °) by means of the kriging method, considering the relationship between the stations located inside and outside the basin. The method selected in this study is the ordinary Kriging, which consists of quantifying the assumption that nearby measurements tend to be more similar than those that are located further away. Detailed information about the Kriging interpolation method can be found in Lichtenstern (2013). Finally, the average precipitation values for each month and for the entire basin in the 2010-2015 period were determined. Due to the availability of maximum and minimum temperature data, the evapotranspiration variable (ETP) was estimated with the Hargreaves & Samani model (1985). This calculation is shown in Equation (2):
where ETP is evapotranspiration (mm / day),
The conceptual layout of the GR2M model is shown in Figure 2, where the parameters of the model are noted as X1 (maximum storage capacity of the reservoir in mm) and X2 (groundwater exchange coefficient, dimensionless). The GR2M model’s parameters are described as follows (Niel et al., 2003): X1 parameter is adjusted in order to multiply, in the same proportion, rainfall and evapotranspiration rates ranging from 0 to 1; ( is a parameter multiplied by effective rainfall, (Pe) corresponds to direct flow while (1 -( ̨), Pe flow discharges into the gravity drainage tank; finally, the discharge of the second tank is defined with parameter X2 with ranges from 0 to 1.
The model is based on the transformation of precipitation-runoff through two functions: production and transfer. The GR2M model is a model with two reservoirs, where the production function is organized around a reservoir called reservoir-soil, and the transfer function is governed by the second reservoir called gravitational water reservoir, where the contribution is instantaneous at the beginning of the time step, then the reservoir empties gradually. The level of this reservoir determines the flow rate that can be released (Figure 2).

The input (P) and output (ETP) variables of the reservoir-soil (production stored-maximum capacity X1) are calculated based on the storage of the production reservoir (S). A portion of precipitation P1 refers to the difference between P and the precipitation that enters the soil, and another portion, P2, refers to the amount of water that contributes to underground exchange. The sum of P1 and P2 corresponds to the effective precipitation, P3, that enters the gravitational water reservoir (R) (maximum capacity set at 60 mm). The underground exchange (R2) is included in the X2 model (Figure 2). Finally as a result for the output flow, the gravitational water reservoir is released according to a quadratic function. The optimization of the model responds mainly to two parameters: X1, capacity of the reservoir-soil in millimeters, and X2, coefficient of underground exchange (dimensionless). For this, a previous manual calibration was carried out, to finally use the Excel SOLVER tool.
To evaluate the performance of the model, the following objective functions were
used: Nash Sutcliffe Coefficient (NS), difference between calculated and
observed volumes by the volume error (ΔV) and coefficient of determination shown
as
Where
Results and discussion
In average terms, the visual analysis of the estimated evapotranspiration regime for the period 2011-2015 did not show significant variations during the wet season (~ 166 mm, December-February), however, there was an approximate increase from 64 mm to 80 mm during the dry season. As a result of the water balance, this increase is associated with the reduction in precipitation identified throughout the study period (~ 50%) (see Figure 3a). The average annual precipitation in the IRB indicates that TMPA V7 (836.4 mm) and TMPA RT (1022.5 mm) overestimated observed data (688.0 mm) by 21.6% and 48.6%, respectively.
The analysis of monthly precipitation in the IRB shows that the TMPA V7 data were more realistic in relation to observed data when a high coefficient of determination between them was identified (r2 = 0.86) and lower standard error (EME = 25 mm) (Figure 3b). However, TMPA V7 shows differences with respect to observed data for rainfall estimates above 50 mm / month. Likewise, TMPA RT dataset shows greater differences than TMPA V7 for estimates above 50mm / month, despite having an acceptable coefficient of determination (r2 = 0.76) and a higher error (EME = 33.1 mm) (Figure 3c) .
For a temporal analysis of rainfall, average monthly rainfall was calculated for each data set (PLU, TMPA V7, TMPA RT). The analysis corroborates that the TMPA V7 estimates best approximate data observed during the wet season (December-March) (Figure 3d). However, TMPA V7 shows a tendency to overestimate rainfall observed during the dry season by ~ 22 mm (May-September). On the other hand, TMPA RT data show a tendency to overestimate data observed predominantly throughout the year.
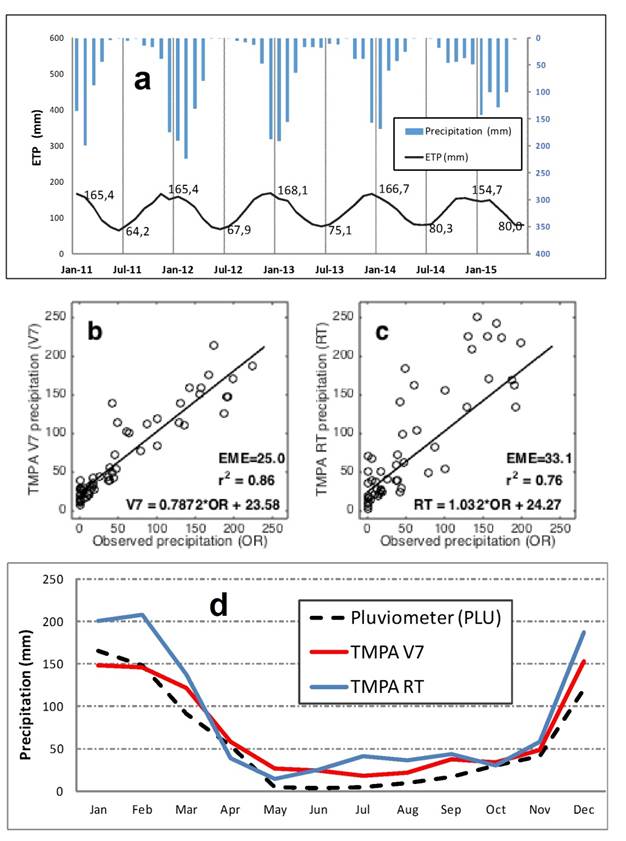
Figure 3 a) Comparison between evapotranspiration and observed rainfall; b-c) dispersion diagrams based on the rainfall products TMPA V7 and TMPA RT in relation to observed rainfall (PO); d) average monthly rainfall for each rain product.
The differences identified between the satellite estimates and observed rainfall data may be associated with observational variations and/or data from sensors providing data input to the algorithm used to estimate satellite precipitation (Huffman et al., 2007). In fact, similar results were found in the Ramis River basin in the Peruvian Altiplano (Lujano et al., 2015) and other regions in the Andes of Peru and Ecuador (Zulkafli et al., 2014; Zubieta et al., 2015).
For the calibration process of the model, the selection of the number of years of the calibration and validation periods was evaluated previously. On average conditions, for a one-year calibration period (validation period of 4 years) the model performance tended to be better than when selecting 2 or 3 years (validation period of 3 and 2 years), which were 30% and 45% lower in performance, respectively.
The calibration of both the observed rainfall and satellite model only included 2011, while the validation included the 2012-2015 period.
The model’s input variables were average monthly values for precipitation, potential evapotranspiration and streamflows. The optimization process was based mainly on obtaining suitable model parameters (X1 and X2) according to Equation 10, using observed rainfall data and satellite data (TMPA V7, TMPA RT) as input. The optimized X1 and X2 values for each set of precipitation data are shown in Table 2, where the values found for the Nash coefficient, water balance and correlation coefficients are also presented for evaluating flow data modeled with respect to observed flows.
Table 2 Calibration parameters, Nash-Sutcliffe performance coefficients, differences between volumes, and coefficient of determination between calculated and observed flows.
| Parameter | Observed Rainfall | TMPA V7 | TMPA RT |
|---|---|---|---|
| X1: Production reservoir (mm) | 5.76 | 5.57 | 6.35 |
| X2: Exchange parameter (mm) | 1.00 | 0.96 | 0.74 |
| Nash Sutcliffe (NS) coefficient | 0.95 | 0.74 | 0.52 |
| % difference between observed and calculated volume (ΔV) | 5 | 23 | 41 |
| Coefficient of determination (R2) | 0.85 | 0.64 | 0.45 |
Similar to the rainfall regime, the streamflow regime observed also showed a clear decrease from 2011 to 2015, both in the wet and dry seasons, with similar patterns in each series of streamflows estimated from satellite data (TMPA V7 and TMPA RT). Given the water balance and the high performance of the GR2M model in the estimation of streamflows using observed data, this deficit is due to the predominant decrease in rainfall, which was also identified in the streamflows series obtained from satellite. It is also affected by the increase in evapotranspiration estimated during the dry period between 2011-2015 (Figures 4a and 3a).
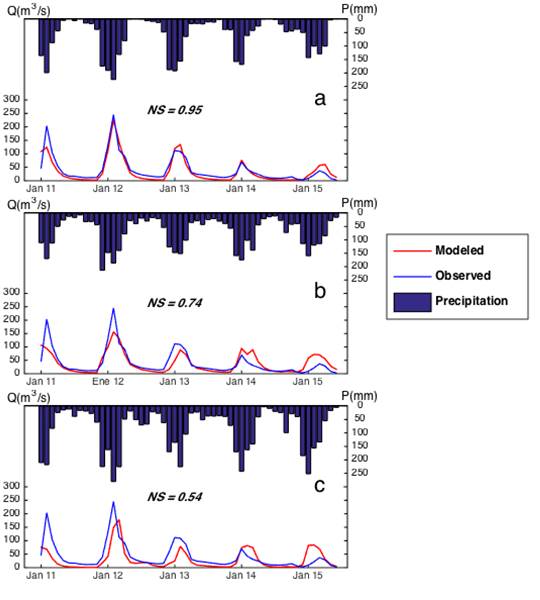
Figure 4 Observed and modeled streamflows at the Puente Carretera Ilave station from January 2011 to June 2015. Modeled streamflows were calculated using precipitation data obtained from (a) rain gauges, (b) TMPA V7 and c) TMPA RT at the Ilave River basin (IRB).
The decrease in rainfall may be associated with the substantial increase in the occurrence of warm fronts in the Altiplano, which may increase atmospheric evaporation, in addition to reducing vegetation (Thibeault, Seth, & Garcia, 2010). The visual analysis of the hydrographs shows that the streamflows obtained from observed rainfall (rain gauges) are more similar to observed streamflows in the Puente Carretera Ilave gauging station (NS = 0.95 and ΔV = -5%), which are shown in Figure 4a. The rainfall regime is consistent in relation to the streamflows obtained in the water balance (see Figure 4a). Seasonal fluctuations in the flow regime are very well represented by the GR2M model when using observed data, mainly during the validation period, such as those recorded in the 2012, 2014 and 2015 flows.
However, the performance of the GR2M model when using TMPA V7 data in the IRB is minimally acceptable (NS = 0.74, ΔV = -23%) despite presenting a relatively high NS (Figure 4b). It was not possible to adequately represent all the peak flows, which could be due to the overestimation of the rain during wet season (December-January).
However, it can better reproduce seasonal streamflows, mainly during dry periods. Lower performance was found with TMPA RT (NS = 0.52, ΔV = -41%) (Figure 4c). Results from TMPA RT data were due to an inadequate rainfall estimate by the TRMM satellite, This is characterized in average values by a very marked overestimation with respect to the observed dataset (rain gauge) (31%) and the TMPA V7 dataset (35%) during the wet period (Figure 3d). This overestimation was also observed during dry season, which resulted in 81% more than observed rain (rain gauges) and 16% more than rainfall based on TMPA V7.
Monthly streamflows between 2011 and 2015 obtained from satellite were also compared to observed streamflows (Puente Carretera ILave station) using dispersion diagrams (Figure 5a-c). Flows show that the series generated by the model using observed data (rain gauges) and TMPA V7 better represent the observed streamflow, presenting acceptable coefficients of determination (0.85 and 0.64, respectively). However, the streamflows (Q> 75 m3 / s) present predominantly during the wet period (January-March) presented a greater dispersion of the data, unlike other periods (dry season during Junio-Julio or precipitation start period between September and December). In general, this suggests a better approximation by the TMPA V7 dataset, whose data was most similar to observed streamflows. However, the streamflows simulated using TMPA RT presented greater differences with respect to the observed streamflows (low coefficient of determination (r2 = 0.45)).

The greater similarity between TMPA V7 and observed rainfall dataset, as well as overestimation of TMPA RT with respect to observed data (Figure 4b-c), are congruent with the observed affect on the maximum storage capacity parameter of the reservoir, X1, since these parameters obtained in the optimization process (X1) are more similar when they are obtained from TMPA V7 and observed data (PLU). In addition to X1 tends to be higher when it is provided by TMPA RT (see Table 2).
On the other hand, the streamflows modeled with GR2M using satellite rain (TMPA V7, TMPA RT) tend to underestimate observed flows. This is mainly associated with the optimization process of the model. Therefore, a lower underground exchange (X2) is effective when using TMPA V7 (X2 = 0.96) and TMPA RT (X2 = 0.74) (see Table 2). This suggests a negative impact on the final production of streamflows (X2 is low), which implies that although satellite precipitation tends to overestimate rainfall observed in the wet season, the results of the model of this rainfall tend to underestimate observed flows.
Conclusions
A clear deficit was identified in the streamflow regime of the Ilave River in the Peruvian Altiplano for the period 2011-2015. According to the hydrologic balance, the water deficit was due to the decrease in precipitation in the rainy period (~ 50%) and increased evapotranspiration in the dry period (~ 24%).
Two monthly rainfall datasets from the TRMM satellite (TMPA V7, TMPA RT) were compared with a ground-based precipitation dataset (PLU) on the Ilave River basin.
With average conditions and based on statistical analyses, TMPAV7 was highly associated with observed precipitation, especially during the wet season (January-March). However, TMPA V7 tended to overestimate observed rainfall during the dry period (May-September). On the other hand, data based on TMPA RT predominantly showed overestimations throughout the year.
To investigate the advantage of satellite data in hydrology, an observed rainfall dataset (PLU) and a satellite-based rainfall dataset (TMPA V7, TMPA RT) were used as input variables to the GR2M hydrological model.
The analysis of the hydrographs showed that the flow rates obtained from observed rain (rain gauges) were more similar to flow rates observed in the Puente Carretera Ilave gauging station (NS = 0.95). It should be noted that when using TMPA V7, the performance of the GR2M model data can adequately represent the seasonal flow cycle (NS = 0.74). However, it does not have the ability to adequately represent peak flows. This mainly suggests an inadequate estimate of rainfall during the month of February, characterized by an underestimation of rainfall.
It was found that TMPA RT (NS = 0.54) performed poorer than TMPA V7. This poorer performance with the TMPA RT dataset was due to inadequate satellite estimates, characterized by a marked overestimation of observed rainfall data. Indeed, the streamflows showed that the series generated by the model using observed data (rain gauges) and TMPA V7 better represented observed flows during the wet period.
Errors in the streamflow simulations by the GR2M model may be associated mainly with rainfall or evapotranspiration input data, in addition to the model’s limited representation of physical processes. However, the results show that it is possible to use data from satellites for hydrological modeling of small basins in the Altiplano of the Peruvian, in order to adequately simulate flow rates.
It is of great interest in hydrology to evaluate the data from the new generation of rainfall estimates provided by the GPM (Global Precipitation Measurement) satellite (Schwaller & Morris, 2011). This type of data provides the possibility of taking advantage of sub-daily data or precipitation sub-schedules to estimate flows of the same temporal resolution using hydrological models.
Acknowledgments
The authors thank the National Service of Meteorology and Hydrology (SENAMHI) for providing the hydrometeorological information for this research. Also, the GSFC / DAAC, NASA for providing TMPA V7 and TMPA RT datasets (https://pmm.nasa.gov/data-access/downloads/trmm). The first author also thanks Juan Sulca, Msc., for his contributions to the revision of the article.
REFERENCES
ANA, Autoridad Nacional del Agua. (2010). Las condiciones de sequía y estrategias de gestión en el Perú. Informe Nacional del Perú. Lima, Perú: Autoridad Nacional del Agua. [ Links ]
Belizario, G. (2015). Efectos del cambio climático en la agricultura de la cuenca Ramis, Puno-Perú. Revista de Investigaciones Altoandinas, 17(1), 47-52. http://dx.doi.org/10.18271/ria.2015.77 [ Links ]
Brunet-Moret, Y. (1979). Homogénéisation des précipitations. Cahiers ORSTOM, Série Hydrologie, 16(3), 3-4. [ Links ]
Coscarelli, R., & Caloiero, T. (2012). Analysis of daily and monthly rainfall concentration in Southern Italy (Calabria region). Journal of Hydrology, 416, 145-156. DOI: 10.1016/j.jhydrol.2011.11.047 [ Links ]
Edijatno, E., & Michel, C. (1989). Un modèle pluie-débit journalier à trois paramètres. La Houille Blanche, 2, 113-121. [ Links ]
Espinoza, J. C., Ronchail, J., Guyot, J. L., Cocheneau, G., Filizola, N., Lavado, W., De Oliveira, E., Pombosa, R., & Vauchel, P. (2009). Spatio-temporal rainfall variability in the Amazon Basin Countries (Brazil, Peru, Bolivia, Colombia and Ecuador). International Journal of Climatology, 29(11), 1574-1594. Recuperado de https:// doi.org/10.1002/joc.1791 [ Links ]
García, M., Raes, D., & Jacobsen, S. E. (2003). Evapotranspiration analysis and irrigation requirements of quinoa (Chenopodium quinoa) in the Bolivian highlands. Agricultural Water Management, 60(2), 119-134. Recuperado de https://doi.org/10.1016/S0378-3774(02)00162-2 [ Links ]
García, M., Raes, D., Allen, R. G., & Herbas, C. (2004). Dynamics of reference evapotranspiration in the Bolivian highlands (Altiplano). Agricultural and Forest Meteorology, 125(1-2), 67-82. Recuperado de https://doi.org/10.1016/j.agrformet.2004.03.005 [ Links ]
Hargreaves, G. H., & Samani, Z. A. (1985). Reference crop evapotranspiration from temperature. Transactions of the ASAE, 2, 96-99. [ Links ]
Hiez, G. (1977). L’homogénéité des données pluviométriques. Cahier ORSTOM, Série Hydrologie, 14(2), 129-172. [ Links ]
Huffman, G., Adler, R., Bolvin, D., Gu, G., Nelkin, E., Bowman, K., Hong, Y., Stocker, E., & Wolff, D. (2007). The TRMM multisatellite precipitation analysis (TCMA): Quasiglobal, multiyear, combined-sensor precipitation estimates at fine scales. Journal of Hydrometeorology, 8, 38-55. Recuperado de https://doi.org/10.1175/JHM560.1 [ Links ]
Huffman, G. J., Adler, R. F., Bolvin, D. T., & Nelkin, E. J. (2010). The TRMM multi-satellite precipitation analysis (TMPA). Satellite Rainfall. Applications for Surface Hydrology. DOI: 10.100/978-90-481-2915-7_1 [ Links ]
Kabouya, M. (1990). Modélisation pluie-débit au pas de temps mensuel et annuel en Algérie septentrionale (tesis de doctorado). Université Toulouse, Paris, France. [ Links ]
Lavado, W., Labat, D., Guyot, J., Ronchail, J., & Ordoñez, J. L. (2009). TRMM rainfall data estimation over the Peruvian Amazon-Andes basin and its assimilation into a monthly water balance model. International Association of Hydrological Sciences Publication, 333, 245-252. [ Links ]
Lavado, W., Labat, D., Guyot, J., & Ardoin-Bardin, S. (2011). Assessment of climate change impacts on the hydrology of the Peruvian Amazon-Andes basin. Hydrological Processes, 25(24), 3721-34. Recuperado de https://doi.org/10.1002/hyp.8097 [ Links ]
Lichtenstern, A. (2013). Kriging methods in spatial statistics (tesis de licenciatura). Tecnische Universität München, München, Germany. [ Links ]
Lujano, E., Felipe, O., Lujano, A., & Quispe, J. (2015). Validación de la precipitación estimada por satélite TRMM y su aplicación en la modelación hidrológica del río Ramis, Puno, Perú. Revista de investigaciones Altoandinas, 17(2), 221-228. Recuperado de http://dx.doi.org/10.18271/ria.2015.116 [ Links ]
Makhlouf, Z., & Michel, C. (1994). A two-parameter monthly water balance model for French watersheds. Journal of Hydrology, 162(3-4), 299-318. Recuperado de https://doi.org/10.1016/0022-1694(94)90233-X [ Links ]
Milewski, A., Elikadri, R., & Durham, M. (2015). Assessment and Comparison of TMPA Satellite Precipitation Products in Variying Climate and Topographic Regimes in Morocco. Remote Sensing, 7(5), 5697-5717. DOI: 10.3390/rs70505697 [ Links ]
Niel, H., Paturel, J. E., & Servat, E. (2003). Study of parameter stability of a lumped hydrologic model in a context of climatic variability. Journal of Hydrology, 278(1-4), 213-230. Recuperado de https://doi.org/10.1016/S0022-1694(03)00158-6 [ Links ]
RPP Noticias. (2012). Puno: inundaciones afectaron más de 37 mil hectáreas de cultivos. Radio Programas del Perú. Recuperado de http://rpp.pe/peru/actualidad/puno-inundaciones-afectaron-mas-de-37-mil-hectareas-de-cultivos-noticia-454127 [ Links ]
Schwaller, M. R., & Morris, K. R. (2011). A ground validation network for the global precipitation measurement mission. Journal of Atmospheric and Oceanic Technology, 28, 301-319. Recuperado de https://doi.org/10.1175/2010JTECHA1403.1 [ Links ]
Thibeault, J. M., Seth, A., & Garcia, M. (2010). Changing climate in the Bolivian Altiplano: CMIP3 projections for temperature and precipitation extremes. Journal of Geophysical Research, 115, D08103. DOI: 10.1029/2009JD012718 [ Links ]
Vacher, J., Imana, E., & Canqui, E. (1994). Las características radiativas y la evapotranspiración potencial en el Altiplano boliviano. Convenio sistemas de cultivo en la región de Cochabamba. Revista de Agricultura, 50(24), 4-11. [ Links ]
Vauchel, P. (2006). Hydraccess, software hidrológico. Recuperado de http://www.so-hybam.org/index.php/esl/Software/Hydraccess [ Links ]
Vera, H., & Felipe, O. (2011). Modelización de los caudales medios mensuales en la cuenca del río Ramis. Revista Peruana Geo-Atmosférica RPGA, (3), 116-124. [ Links ]
Zubieta, R., & Saavedra, M. (2013). Distribución espacial del índice de concentración de precipitación diaria en los Andes centrales peruanos: valle del río Mantaro. Revista del Encuentro Científico Internacional ECIPeru, 9(2), 61-70. [ Links ]
Zubieta, R., Getirana, A., Espinoza, J. C., & Lavado, W. (2015). Impacts of satellite-based precipitation datasets on rainfall-runoff modeling of the western Amazon basin of Peru and Ecuador. Journal of Hydrology. DOI:10.1016/j.jhydrol.2015.06.064 [ Links ]
Zubieta, R., Saavedra, M., Silva, Y., & Giraldez, L. (2017a). Spatial analysis and temporal trends of daily precipitation concentration in the Mantaro River basin. Central Andes of Peru. Stochastic Environmental Research and Risk Assessment. DOI: 10.1007/s00477-016-1235-5 [ Links ]
Zubieta, R., Getirana, A., Espinoza, J. C., Lavado-Casimiro, W., & Aragon, L. (2017b). Hydrological modeling of the Peruvian-Ecuadorian Amazon basin using GPM-IMERG satellite-based precipitation dataset. Hydrology and Earth System Sciences, 21(7), 3543-3555. Recuperado de https://doi.org/10.5194/hess-21-3543-2017 [ Links ]
Zulkafli, Z., Buytaert, W., Onof, C., Manf, B., Tarnavsky, E., Lavado, W., & Guyot, J. L. (2014). A comparative performance analysis of TRMM 3B42 (TMPA) versions 6 and 7 for hydrological applications over Andean-Amazon River Basins. Journal of Hydrometeorology, 15, 581-592. DOI: 10.1175/JHM-D-13-094 [ Links ]
Received: May 23, 2017; Accepted: April 11, 2018
 Este es un artículo publicado en acceso abierto bajo una licencia
Creative Commons
Este es un artículo publicado en acceso abierto bajo una licencia
Creative Commons
