


Serviços Personalizados
Journal
Artigo
 texto em
  Inglês (pdf)
 Artigo em XML
 Referências do artigo
 Enviar este artigo por email
Indicadores
-
 Citado por SciELO
 -
 Acessos
Links relacionados
-
 Similares em
SciELO
Similares em
SciELO
Compartilhar

 Permalink
Tecnología y ciencias del agua
versão On-line ISSN 2007-2422
Tecnol. cienc. agua vol.11 no.2 Jiutepec Mar./Abr. 2020 Epub 27-Maio-2020
https://doi.org/10.24850/j-tyca-2020-02-05
Articles
Eco-efficiency assessment of domestic wastewater treatment technologies used in Chile

1Escuela de Ciencias Ambientales y Sustentabilidad, Facultad de Ciencias de la Vida, Universidad Andres Bello, Santiago, Chile, v.abellopassteni@gmail.com
2Centro de Investigación para la Sustentabilidad, Facultad de Ciencias de la Vida, Universidad Andres Bello, Santiago, Chile, edmundo.munoz@unab.cl
3 Centro de Investigación para la Sustentabilidad, Facultad de Ciencias de la Vida, Universidad Andres Bello, Santiago, Chile, sebastian.lira@unab.cl
4Centro de Investigación para la Sustentabilidad, Facultad de Ciencias de la Vida, Universidad Andres Bello, Santiago, Chile, elizabeth.garrido@unab.cl
Wastewater treatment plants have been the widest technologies used to mitigate the environmental impacts of domestic wastewater. Currently, Chile has the largest coverage of wastewater sanitation (99.85%) of Latin American, through the use of conventional technologies, mainly active sludge and aerated lagoons and also unconventional technologies such as biofilter, vermi-biofilter, among others. Although all technologies allow fulfilling with discharge standards, there are differences in the flows of matter and energy associated with the kind of technology used, which implies the generation of different environmental impacts. The objective of this research was to evaluate the eco-efficiency of different domestic wastewater treatment technologies used in Chile, based on the requirements of ISO 14045 (2012). For this purpose, 1 kg of removed BOD5 was used as a functional unit and a value function associated with the volume of treated water (m3). Fifteen plants of wastewater treatment in Chile were analyzed, using the life cycle assessment methodology to quantify environmental impacts. The main environmental aspect of domestic wastewater treatment for most of the impact categories studied was electricity consumption. The vermi-biofilter was the most eco-efficient technology for climate change and freshwater eutrophication categories. This result reflecting that unconventional emerging technologies are more eco-efficient than conventional ones.
Keywords: Eco-efficiency; plant of treatment; wastewater domestic; life cycle assessment
Las plantas de tratamiento de aguas residuales han sido el medio más utilizado para mitigar los impactos ambientales de las aguas residuales domésticas. En la actualidad, Chile cuenta con la mayor cobertura de saneamiento de aguas residuales (99.85%) en Latinoamérica, mediante la utilización de tecnologías convencionales, sobre todo lodos activos y lagunas aireadas, y no convencionales como biofiltro, vermi-biofiltro, entre otros. Si bien todas las tecnologías permiten cumplir con las normas de descarga, existen diferencias en los flujos de materia y energía asociados con el tipo de tecnología utilizada, lo que implica la generación de distintos impactos ambientales. El objetivo de esta investigación fue evaluar la eco-eficiencia de diferentes tecnologías de tratamiento de aguas residuales domésticas utilizadas en Chile, con base en los requisitos de la norma ISO 14045 (2012). Para ello se utilizó como unidad funcional 1 kg de DBO5 removida y una función de valor asociada con el volumen de agua tratada (m3). Se analizaron 15 plantas de tratamiento de aguas residuales en Chile, utilizando la metodología de análisis de ciclo de vida para cuantificar los impactos ambientales. Se determinó que el consumo eléctrico es el principal aspecto ambiental del tratamiento de aguas residuales domésticas para la mayoría de las categorías de impacto estudiadas. En términos de cambio climático y eutrofización de agua dulce, la tecnología más eco-eficiente fue el vermi-biofiltro, lo cual refleja que las tecnologías emergentes no convencionales son más eco-eficientes que las convencionales.
Palabras clave: eco-eficiencia; planta de tratamiento; aguas residuales domésticas; análisis de ciclo de vida
Introduction
The water resource is not only an essential asset for the development of life and the conservation of the environment but also is a unique and strategic natural means for the growth of different productive sectors. For this reason, countries have included within their policies, strategies that ensure access to this vital element in a pollution-free environment, promoting economic development and the sustainability of the activities that demand this resource.
In Chile, between the different productive sectors, sanitation companies occupy fourth place (6%) of the country’s consumptive water rights. The water is used for the production of drinking water, which after it has been used, is collected and treated (Ministerio de Obras Públicas, 2013), about 80% of drinking water produced is converted into domestic wastewater (DS N° 90/00). The treatment of this kind of water is of vital importance to comply with the regulations imposed by governments, to prevents contamination of water bodies.
The coverage of domestic wastewater treatment in Chile is 99.97% in urban areas (zone with sewerage). As a consequence, Chile is the country with the highest sanitation coverage in Latin America, being the active sludge systems the most used wastewater treatment technology (60%). Followed by aerated lagoons and unconventional technologies, such as, biofilters and vermi-biofilters with 19% and 4.3%, respectively (SISS, 2017). Although active sludge technology has been the most widely adopted in the world for the treatment of domestic wastewater (Marti & Batista, 2014), it has a high-energy demand. It is estimated that between 45-75% of the total operating costs are due both of them to the aeration stage for the degradation of organic matter and the consumption of electric energy, varying between 0.3-0.6 kWh per m3 (1 000 l) of treated water (Roohian & Mehranbod, 2017). Therefore, energy costs can be a limitation for the implementation of active sludge systems especially in developing countries (Muga & Mihelcic, 2008) or small communities (equivalent population < 2 000 people) (Corominas et al., 2013).
Therefore, unconventional technologies have been proposed for the treatment of wastewater, with lower energy requirements and supplies, such as wetlands, biological filters and vermi-biofiltration, among others (Corominas et al., 2013; Li, Xing, & Lu, 2013; Tomar & Suthar, 2011; Jiang et al., 2016; Lourenço & Nunes, 2017; Samal, Dash, & Bhunia, 2017).
Efficiency in the removal of contaminants present in wastewater varies according to the type of treatment used (Jiang et al., 2016), both conventional and unconventional technologies are designed to comply with emission regulations for dumping in receiving bodies of water. The supplies and electrical energy of the wastewater treatment plants can vary significantly depending on the type of treatment used, as well as, varies the environmental aspects associated with their operation (Lorenzo-Toja et al., 2016a) giving different kinds of environmental impacts (Corominas et al., 2013).
The life cycle assessment (LCA) methodology, internationally standardized by ISO 14040 (2006) and ISO 14044 (2006) has been widely used to quantify the environmental impacts of different domestic wastewater treatment systems ((Emmerson, Morse, Lester, & Edge, 1995; Hospido, Moreira, Fernández-Couto, & Feijoo, 2004; Pasqualino, Meneses, Abella, & Castells, 2009; Rodriguez-Garcia et al., 2011). An example of this is evidenced by Kalbar, Karmakar y Asolekar (2012), where a life cycle assessment of different wastewater treatment technologies was performed, obtaining carbon footprint indicators of 31.97 kg CO2 eq hab-1 year-1 and 18.20 kg CO2 eq hab-1 year-1 for the use of sequential batch reactors (SBR) and active sludge, respectively. Negative indicators were reported in the case of treatment of domestic sewage using wetlands, estimating a carbon footprint of 3.86 kg of CO2 eq hab-1 year-1 and variations between 1.38-5.85 kg PO4 -3 eq hab-1 year-1 for the category of freshwater eutrophication. In Chile, the LCA has had a growing development in the evaluation of impacts on waste (Muñoz, Vargas, & Navia, 2015), agriculture (Herrera, Muñoz, & Montalba, 2012) and construction (Cárdenas, Muñoz, Riquelme, & Hidalgo, 2015). However, LCA works in the sanitation sector have been not reported yet.
At the date, the selection of wastewater treatment technologies has considered only aspect related to investment and operating costs (such as, wastewater properties, flow), not taking into account the environmental impacts derived from its operations. Currently, eco-efficiency is recognized as an instrument that seeks to promote fundamental changes in the way in which resources are produced and consumed, is a tool that allows measured progress towards sustainability (ESCAP, 2010).
The eco-efficiency concept was defined for the first time by the World Business Council for Sustainable Development with the aims of producing goods and services using less natural resources and generating lower levels of pollution (Schmidheiny & Businness Council for Sustainable Development, 1992), offering environmental competitiveness from an economic perspective. The eco-efficiency concept was standardized by ISO 14045 (2012) which defined it as a quantitative management tool allowing for the study of the environmental impacts of a product or service throughout its life cycle, giving a value in parallel. Therefore, eco-efficiency has three goals: a) increase the value of the service or goods; b) optimize the use of resources, and c) reduce the environmental impact (Robaina-Alves, Moutinho, & Macedo, 2015).
ISO 14045 (2012) leaves a wide range of methodological assumptions for the selection of the value (Lorenzo-Toja, Vázquez-Rowe & José, 2016b). The value can vary according to the interested parties and can be expressed for example, as functional value, in terms of quality, monetary, or others less tangible (Ribarova & Stanchev, 2016), where the different criteria adopted can lead to different results according to the unit of value chose. Within the framework of this concept, Lorenzo-Toja et al. (2014), carried out an eco-efficiency assessment of 133 domestic wastewater treatment plants in Spain, with different sizes concerning the amount of water being treated, showing that larger plants tend to be more eco-efficient. Also, Lorenzo-Toja et al. (2016b) compared the eco-efficiency of 22 treatment plants by ISO 14045 (2012), using a monetary cost value function to treat 1 m3 through life cycle cost analysis (LCCA) of the stage operation in the wastewater treatment plant. The aim of this work was creating a classification scheme as an eco-efficiency eco-label proposal for each plant depending on its performance, which depended on various factors, such as, plant configuration, size or even government regulations.
From a value point of view, the functionality of a product or process commonly tends to be measured in terms of its monetary value, which automatically induces professionals to combine LCA with LCCA. However, some services are regulated by tariffs, as is the case of sanitation companies in Chile, generating a disincentive to be more eco-efficient in monetary terms and having to resort to another type of value, such as treated a volume of wastewater. In this context, the present work seeks to show that non-conventional domestic wastewater treatment technologies are more eco-efficient compared to conventional technologies used in Chile. To promote domestic wastewater treatments with less intensity in the use of natural resources, which in addition to complying with the treatment of domestic wastewater must be within current regulations, resulting in a decrease in environmental impacts for these systems.
Materials and methods
Definition of goal and scope of the study
The aim of this study was to evaluate the eco-efficiency of different domestic wastewater treatment technologies used in Chile based on the international standard ISO 14045 (2012). For that purpose, four wastewater technologies grouped in conventional treatments (active sludge systems and aerated lagoons) and unconventional treatments (biofilters and vermi-biofilters) were studied.
The quantification of environmental impacts for different wastewater treatment technologies was carried out using the life cycle assessment methodology, established in ISO 14040 (2006) and ISO 14044 (2006). The main function of domestic wastewater treatment plants was considered to be the decrease in organic matter expressed as biological oxygen demand (BOD5) where a functional unit of 1 kg of BOD5 removed was selected.
The total number of domestic wastewater treatment plants (DWWTPs) studied was 15 (Table 1), with different sizes of the installation concerning the treated flow or population served and technologies used in sludge stabilization. Of the total of plants, 8 correspond to active sludge with prolonged aeration, of which, 4 perform sludge stabilization by anaerobic digestion with biogas generation (used to heat the sludge), 2 DWWTPs by lime and 2 DWWPTs only with landfill sanitary disposal.
Table 1 Domestic wastewater treatment plants in study.
| Region | Technology | N° | Treated flow (m3/month) | Estimated population (hab)* |
|---|---|---|---|---|
| Araucanía Region | Aerated lagoons | DWWTP1 | 37337.0 | 10989 |
| Bio Bio Region | DWWTP 2 | 21453.1 | 6314 | |
| Coquimbo Region | DWWTP 3 | 383197.6 | 112784 | |
| Valparaíso Region | DWWTP 4 | 9214.4 | 2712 | |
| Araucanía Region | DWWTP 5 | 256029.8 | 75356 | |
| Coquimbo Region | Active sludge | DWWTP 6 | 3696.8 | 1088 |
| Aysén Region | DWWTP 7 | 2116.1 | 622 | |
| Metropolitana Region | DWWTP 8 | 7467.8 | 2198 | |
| Los Ríos Region | DWWTP 9 | 10682.3 | 3144 | |
| Valparaíso Region | DWWTP 10 | 331208.8 | 97483 | |
| Los Lagos Region | DWWTP 11 | 861714.5 | 253624 | |
| Metropolitana Region | DWWTP 12 | 23745708.8 | 6988965 | |
| Metropolitana Region | DWWTP 13 | 16462744.0 | 4845403 | |
| Metropolitana Region | Biofilter | DWWTP 14 | 1113972.2 | 327870 |
| Coquimbo Region | Vermi-biofilter | DWWTP 15 | 2251.9 | 662 |
*Estimated population based on a water endowment of 137 L/hab/d with 80% recovery (SISS, 2017).
In the case of aerated lagoon technology, 5 DWWTPs were studied. Of these, only one performs stabilization of its sludge, through the anaerobic digestion process with biogas collection.
For the treatment of domestic wastewater through unconventional systems, a biofilter plant and a vermi-biofilter plant were evaluated. The biofilter technology consisted mainly of a fixed bed with polyvinylchloride material, on which the microorganisms adhere forming a film. In this case, sludge stabilization is performed by anaerobic digestion with biogas generation and heat production in the boiler. Finally, the vermi-biofilter plant performs the degradation of organic matter through the use of Californian red worms (Eisenia Foetida), generating humus, which is arranged in green areas of the sanitary installation.
The system boundaries of each technology studied are presented in Figure 1, where the scope considered was from the reception of the wastewater in a DWWTPs, to the discharge into a receiving water body.

Life cycle inventory
For the construction of the life cycle inventory, Superintendency of Sanitary Services (SISS), a public service institution in charge of the control and fiscalization of the DWWTPs, provided the data. The data provided by the SISS were the operation parameters (flows, chemicals, electrical energy, and sludge production) and self-control parameters (BOD5, phosphorus, Kjeldahl total nitrogen, total suspended solids, and residual chlorine). The data used corresponds to the year 2015.
For electricity energy, 14 plants were modeled considering the energy matrix of the Central Interconnected System (CIS) of 2016, which was constituted by 32% coal, 20.6% hydroelectric bypass, 14.9% by reservoir, 19.4% natural gas, 5% biomass, 3.6% wind, 1.5% oil and 3% solar. In the case of the Aysén treatment plant (DWWTP 7), the electrical energy from the Aysén matrix was considered, consisting of 37.9% of hydroelectric power, 57.6% diesel, and 4.5% wind for the same year. The construction of the electricity matrices was modeled in the SimaPro software using international databases (Ecoinvent).
Ecoinvent database was modified for the landfill to bring this type of solid waste disposal closer to the reality of Chile. It was considered that the effluents and sludges generated from the leachate treatment plant belonging to the sanitary landfill are recycled in their totality in the same landfill. For the biogas generation of the landfill, it was calculated using the values used in the study by Suh and Rousseaux (2002), with a gas collection efficiency of 30%. Finally, the methane generated from torch burning was quantified using the IPCC model (2006)
Impact assessment
The SimaPro Software version 8.0.4.30 was used to quantify the environmental impacts. The evaluation method used was ReCiPe MidPoint (H), and the impact categories selected were: climate change (kg CO2 eq), human toxicity (kg 1.4-DB eq), freshwater ecotoxicity (kg 1.4- DB eq) and eutrophication of freshwater (kg P eq).
Definition of eco-efficiency
The value function selected was the volume of wastewater treated (m3) by each treatment technology, thus representing another important function of a wastewater plant. As previously mentioned, it was not considered a monetary value as a unit of value because in Chile the tariff regulation for concessionaires in charge of wastewater treatment (according to D.F.L. No. 70/88 which regulates the calculation rates) establish a marginal income plus a royalty of 3-3.5% per risk, evidencing a disincentive for the investments to the Sanitary sector to obtain lower environmental impacts.
The eco-efficiency indicator was obtained by the relationship established in ISO 14045 (2012) as observed in Eq. 1. For the eco-efficiency indicator, the categories corresponding to climate change (kg CO2eq) and freshwater eutrophication (kg P eq) were selected. These indicators were mainly selected due to the great interest of the scientific environment to study LCA and eco-efficiency works (Lorenzo-Toja et al., 2016b; Lorenzo-Toja et al., 2014; Lundin & Morrison, 2002):
Sensitivity analysis
A sensitivity analysis was performed in a DWWTP with vermi-biofilter technology used as an example of a wastewater plant. To study the effect of the composition of the energetic matrix in the variation of environmental impacts and their eco-efficiency because electric energy is considered as an environmental hotspot associated with climate change. The projection consisted of a 60% increase in non-conventional renewable energy (NCRE) by 2035, and 70% by 2050, based on the international commitment to reduce greenhouse gas emissions, to reduce the percentage of coal-based power generation sources that are the main contributor to climate change.
The sources of electrical energy that projected the increase in NCRE were wind and solar energy (mainly due to the increase in projects of this nature in Chile, inequitable percentage, while the source of energy generation from coal has diminished) (Ministerio de Obras Públicas, 2013).
Results and discussions
Life cycle inventory
The results of the life cycle inventory for the removal of 1 kg of BOD5 by the different technologies are shown in Table 2, evidence that the treatment plants that used aerated lagoons have the highest electrical energy consumption with a range 1.1-5 kWh/kg BOD5, followed by active sludge. These results agree with the study by Muga and Mihelcic (2008), which indicates that aeration in the stabilization ponds can exceed the electrical consumption of the active sludge for certain sizes. The aerated lagoon technology also presented the highest consumption of sodium hypochlorite for the disinfection stage, beside ferric chloride and petroleum inputs.
Table 2 Life cycle inventory to remove 1 kg de BOD5.
| Tecnology | N° | Electric power (kWh) | Fuels (kg) | Sodium hypochlorite (kg) | chlorine (kg) | Ferric Chloride (kg) | Polymer (kg) |
|---|---|---|---|---|---|---|---|
| DWWTP 1 | 2.3 | 0.01 | 0.3 | 0.1 | - | - | |
| DWWTP 2 | 2.7 | 0.004 | - | 0.04 | 1.1 | 0.01 | |
| Aerated lagoons | DWWTP 3 | 2.1 | 0.003 | - | 0.1 | - | - |
| DWWTP 4 | 5 | 0.002 | 0.9 | - | - | - | |
| DWWTP 5 | 1.1 | 0.0001 | 0.8 | - | - | - | |
| 𝜇 | 2.6 | 0.004 | 0.7 | 0.08 | 1.1 | 0.01 | |
| DWWTP 6 | 2.1 | 0.02 | 0.01 | - | - | - | |
| DWWTP 7 | 1.3 | - | 0.08 | - | - | - | |
| DWWTP 8 | 5.5 | 0.01 | 0.7 | - | - | 0.02 | |
| DWWTP 9 | 3.5 | 0.03 | 0.05 | - | - | 0.002 | |
| active sludges | DWWTP 10 | 3 | 0.04 | - | 0.04 | 0.04 | 0.01 |
| DWWTP 11 | 1.4 | 0.004 | - | - | - | 0.01 | |
| DWWTP 12 | 1.1 | 0.0001 | - | 0.02 | 0.1 | 0.01 | |
| DWWTP 13 | 1.5 | 0.001 | - | 0.03 | 0.1 | 0.01 | |
| 𝜇 | 2.3 | 0.02 | 0.2 | 0.03 | 0.1 | 0.01 | |
| Biofilter | DWWTP 14 | 1.2 | 0 | 0.001 | 0.03 | 0.03 | - |
| Vermi-biofilter | DWWTP 15 | 1.7 | - | 0.1 | - | - | - |
For the disinfection stage, sodium hypochlorite was the most widely used chemical in terms of mass for treatment in the different technologies studied, while polymer consumption was similar for aerated lagoons and active sludge.
Life cycle assessment
The results of the life cycle assessment revealed that the aerated lagoons have the greatest environmental impacts for all impact categories studied on the removal of 1 kg BOD5, as shown in Figure 2, in agreement with the largest energy consumption (2.6 kWh/kg BOD5 on average) and chemical supplies for the disinfection stage and the use of ferric chloride (Table 2). Also, the same Figure 2 shows that biofilter technology has lower environmental impacts in all impact categories evaluated.
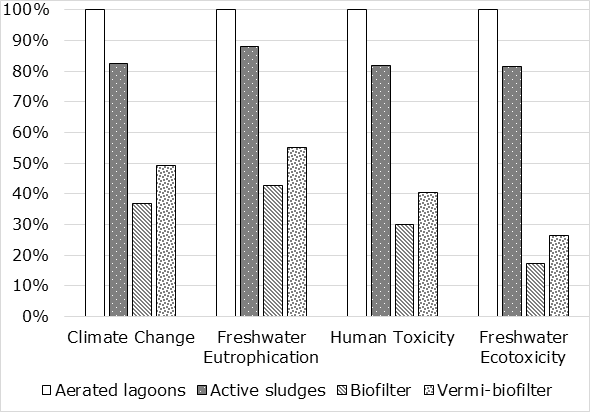
Figure 2 Comparison of average environmental impacts by the kind of technology used for the removal of 1 kg BOD5.
Climate change
The climate change category is one of the best known and commonly used as an environmental impact indicator, although the discharge of effluent into the environment does not have an important effect on this category. The energy intensity in the treatment process makes it important to include it for evaluation (Lorenzo-Toja et al., 2016b). In this context, electric power proved to be the main contributor in all technologies evaluated as shown in Figure 3.
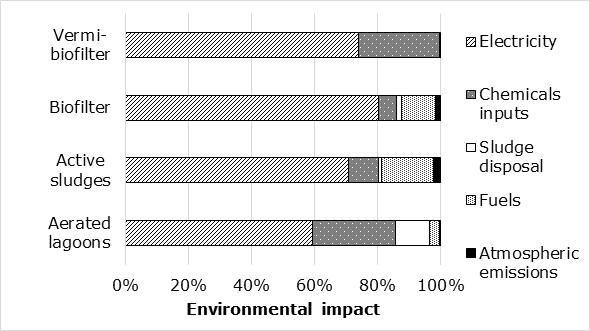
Figure 3 Contribution of the kind of technology for the removal of 1 kg BOD5 for the climate change category
Ranges between 1.24-3.49 kg CO2eq /kg BOD5 were obtained for aerated lagoon plants, with an average of 2.38 kg CO2eq /kg BOD5, where the consumption of electric energy contributed 59% of the impacts. A 27% of the contribution to the environments impacts were due to the use of chemicals inputs, where the disinfection stage had the higher contribution (15.4%) due to the use of sodium hypochlorite (15%) and chlorine gas (0.4%), followed by inputs chemicals such as ferric chloride (9.8%), sodium metabisulfite (1.1%) and polymer (0.7%). Finally, the disposal of sludge contributed 11% of the impacts, mainly due to methane emissions in the landfill and monorefilled landfill disposal.
It was found that DWWTP 2 and 4 obtained the worst performances in energy terms (2.7 and 5 kWh / kg of BOD5 respectively), with both having in common the lack of use of supplies and electrical energy for sludge stabilization, so the energy demand is attributed exclusively to the treatment of the waterline showing energy inefficiencies in its process, compared to the other aerated lagoon plants, such as DWWTP 5, which has a consumption of 1.1 kWh/kg of BOD5 without sludge purge.
Ranges of 0.67-3.98 kg CO2eq / kg BOD5 with an average of 1.96 kg CO2 eq/kg BOD5 were found by active sludge technology. Being the electricity the main contributor with consumptions that vary from 0.8 - 5.5 kWh / kg BOD5 and thus causing 71% of the impacts. Followed by diesel fuel used in the generation of electrical energy, and the use of chemical inputs, with a contribution of 16% and 10%, respectively. In the case of the use of inputs products, the disinfection stage contributed 6%, where the sodium hypochlorite was responsible for 99% of these impacts, having an average consumption of 0.2 kg/kg BOD5. The atmospheric emissions related to the burning of diesel fuel and biogas generated in anaerobic digestion plants contributed only 2.3%, proving to be negligible compared to the other contributions.
The plants with the most impact on removing 1 kg BOD5 in the climate change category were DWWTPs 8, 9 and 10, in agreement with the higher energy and fuel consumption required for their process. These DWWTPs having in common that they do not use anaerobic digestion with biogas recovery and requiring other power supply for their energetic demands.
In the case of the biofilter and vermi-biofilter DWWTPs electrical power also proved to be primarily responsible for impacts with 80% and 74% respectively, followed by biofilter fuel (11%), and the use of chemicals for vermi-biofilter (25%). In the last one, the use of sodium hypochlorite contributed about 20% of these impacts.
Freshwater eutrophication
The greatest impacts for the freshwater eutrophication category were obtained in aerated lagoons, varying from 8.14x 10⁻⁴ to 2.15x10⁻³ kg P eq/kg BOD5, with an average of 1.30x10⁻³ kg P eq/kg BOD5. For active sludge wastewater treatment plants, a range between 8.20x10⁻⁵ and 2.36x10⁻³ kg P eq/kg BOD5 was obtained, with an average of 1.15x10⁻³ kg P eq/kg BOD5. Impacts of 5.56x10⁻⁴ kg P eq/kg BOD5 and 7.18x10⁻⁴ kg P eq/kg BOD5 were obtained in the biofilter and vermi-biofilter technologies, respectively, suggesting that biofilter technology has the best environmental performance. Electrical consumption turned out to be the process with the greatest contribution to this category, this being between 70-80% (Figure 4); except for DWWTP 7, mainly due to the change in the energy matrix used in the plant (Aysén matrix). In the case of DWWTP 7, sodium hypochlorite was the main contributor to the freshwater eutrophication category.
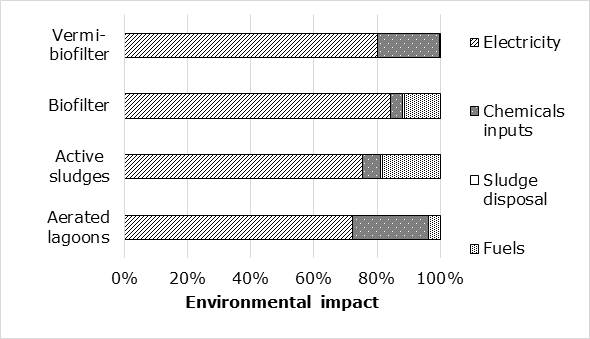
Figure 4 Contribution by kind of technology for the removal of 1 kg BOD5 for the category of freshwater eutrophication.
The second contributor to the freshwater eutrophication category was the use of chemicals inputs, with a contribution of 24% and 20% for aerated lagoons and vermi-biofilter technologies, respectively. Sodium hypochlorite was one that contributed the most to these impacts with 13% for aerated lagoons and 16% for vermi-biofilter, followed by ferric chloride (10%) and sodium metabisulfite (4%). On the other hand, for active sludge and biofilter, the second contributor was diesel fuel.
Freshwater Ecotoxicity
In the freshwater ecotoxicity category the impacts varied from 0.03 to 0.12 kg 1.4-DCB eq/kg BOD5, with an average of 0.07 kg 1.4-DCB eq/kg BOD5 for aerated lagoons, having this technology the greatest impacts. For active sludge values between 0.01 - 0.12 kg 1.4-DCB eq / kg BOD5 were obtained, with an average of 0.06 kg 1.4-DB eq / kg BOD5. Impact of 0.01 kg 1.4-DCB eq/kg BOD5 and 0.02 kg 11.4-DCB eq/kg BOD5 were obtained by biofilter and vermi-biofilter technologies, respectively, suggesting that biofilter technology had the best environmental performance. The electricity was the main contributor to the freshwater ecotoxicology category for the case of vermi-biofilter and biofilter technologies, with 62.4% and 77.6% of the contribution, respectively (Figure 5), being the emission of copper the main aspect within this category (30 - 36%). On the other side, water emissions (discharge) from the dumping of treated waters contributing 48.8% and 59.2% for the technologies of aerated lagoons and active sludge, respectively, thus being the residual chlorine the main contributed (between 48 - 55%).
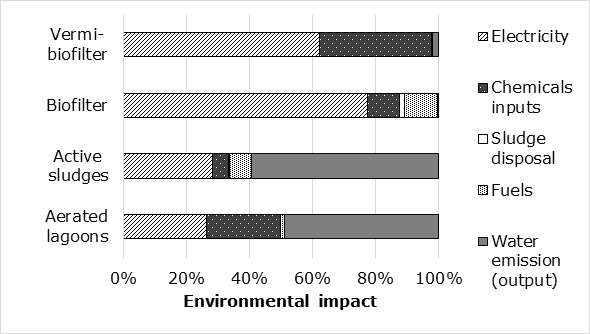
Figure 5 Contribution of kind of technology for the removal of 1 kg BOD5 in the freshwater ecotoxicity category.
For vermi-biofilter technology the second contributor to the freshwater ecotoxicity category corresponds to the use of chemicals inputs represent a 32%, while for aerated lagoons the contribution of chemical products was a 30%. For biofilter technology, chemists accounted for 10.2%, mainly due to the use of ferric chloride (8.2%), and fuel use (10.6%). On the other hand, the use of electrical energy contributed 26.4% and 28.1% for the technologies of aerated lagoons and active sludge respectively.
DWWTP 11 shows the lowest values for this category with 0.01 kg 1.4-DCB eq/kg BOD5, attributed to the use of ozone for the disinfection stage, where, residual chlorine emissions were not generated. Finally, the technologies that presented the highest consumption of electrical energy (lagoons and sludge with 2.6 and 2.3 kWh / kg of BOD5 respectively), did not show a significant impact in this category, mainly due to the greater contribution of emissions to water, specifically for residual chlorine, since this substance has a high characterization factor equivalent to 19 kg 1.4-DCB eq/kg Cl.
Human toxicity
For aerated lagoons, the impacts averaged 1.40 kg 1.4-DCB eq/kg BOD5, while for active sludge, 1.15 kg 1.4-DCB eq/kg BOD5 was obtained. In the case of biofilter and vermi-biofilter, these technologies show the best environmental performance impact results with 0.42 kg 11.4-DCB eq/kg BOD5 and 0.57 kg 1.4-DCB eq/kg BOD5 respectively. In the same way, electrical energy was the process with the greatest contribution for the human toxicity category (Figure 6), with a contribution of 44% and 74% for aerated lagoons and biofilter, respectively. This result is mainly due to the use of manganese, which comes from electrical power generation by the use of coal within the composition of the energy matrix. Followed then by use of chemicals inputs (about 30%), mainly for sodium hypochlorite, providing 15.5% for air lagoons and 27% for biofilter in the disinfection stage, followed by ferric chloride with 13% in aerated lagoons and biofilter fuel (10 %). For active sludge, water emissions (discharge) had a contribution of 29%, mainly due to the chlorine emitted by the effluent, where the latter has a characterization factor equivalent to 170 kg 1.4-DCB eq/kg Cl for this category.

Eco-efficiency assessment
Vermi-biofilter proved to be the most eco-efficient technology with a higher indicator corresponding to 6.7 m3 / kg CO2 eq, followed by biofilter with 5.1 m3 / kg CO2 eq. On the other hand, the vermi-biofilter technology was the most eco-efficient treatment technology with indicators of 10 984.1 m3/kg P eq, followed by active sludge with 10 518.5 m3/kg P eq, in the freshwater eutrophication category, as shown in Table 3.
Table 3 Eco-efficiency indicators and X factor averages by kind of technology.
| Eco-efficiency indicator 1 | Factor X | Eco-efficiency indicator 2 | Factor X | |
| m3/ kg CO2 eq | m3/kg P eq | |||
| Aerated lagoons | 3.4 | 2.0 | 5876.0 | 1.9 |
| Active sludge | 3.8 | 1.7 | 10518.5 | 1.0 |
| Biofilter | 5.1 | 1.3 | 8076.6 | 1.4 |
| Vermi-biofilter | 6.7 | - | 10984.1 | - |
When the eco-efficiency of the plants is analyzed in the climate change category, the DWWTP 3, 5, 7, 11, 12 and 13 have the best indicators for lagoons and active sludge technologies, in agreement with the size of the plants, as was pointed by (Lorenzo-Toja et al., 2014), with exception of the DWWTP 7 which corresponds to a small plant (662.8 inhabitants). The change in the electrical matrix is an important point for the determination of its impacts, and therefore its eco-efficiency. In the same way in the category of freshwater eutrophication, the DWWTP 7 obtains the best eco-efficiency indicator attributable to the energy matrix type mentioned above.
According to factor X (Table 3) in the climate change category, the vermi-biofilter is almost twice the time eco-efficient than aerated lagoons and active sludge plants. Finally, for the freshwater eutrophication category, vermi-biofilter plants turned out to be twice eco-efficient than for aerated lagoons, followed by biofilter, and to a lesser measure with active sludge.
Sensitivity analysis
The results of the environmental impact for the sensitivity analysis (Figure 7), show a decrease in environmental impacts by increasing the unconventional renewable electrical energy in the energy matrix. In the climate change and human toxicity categories a decrease close to 20% and 35% were obtained for vermi-biofilter with 60%-NCRE and vermi-biofilter with 70%-NCRE, respectively. On the other hand, the opposite is true for the category of freshwater ecotoxicity, however, the differences in environmental impact did not exceed 9%, mainly attributed to the 11% increase in photovoltaic and wind energy generation, which 43.2% of the impact contributed to 60%-NCRE, and 60.5% to 70 -NCRE.

Finally, for the eco-efficiency indicator, the vermi-biofilter plant with the highest percentage of NCRE (70%-NCRE) for both categories studied was more eco-efficient. In the category of climate change, the conventional matrix plant decreased its eco-efficiency by 35% and 19% for the matrix with 60%-NCRE, for the freshwater eutrophication category, the decrease in eco-efficiency for the plant with Conventional energy matrix was 54% and for the plant with 60%-NCRE it was 34% with respect to the plant with the highest NCRE (Figure 8).

Finally, with this assessment, it can be demonstrated that eco-efficiency can vary without modifying the flows (required inputs), in terms of efficiency, if not, that the indicator can be altered by simply changing the composition of the electrical matrix, that is, without a change in its design, because the electricity corresponds to an environmental hotspot for the treatment systems.
Conclusions
It was determined that for indicators climate change and freshwater eutrophication the most eco-efficient treatment technology corresponds to vermi-biofilter compared to technologies such as aerated lagoons and active sludge, suggesting that in Chile emerging technologies are more eco-efficient than conventional.
Electric power is an environmental hotspot within the treatment plants, with the composition of the country's energy matrix being decisive, concerning the environmental impact and its eco-efficiency.
Acknowledgment
This work was funded by CONICYT FONDECYT 11170992.
REFERENCES
Cárdenas, J. P., Muñoz, E., Riquelme, C., & Hidalgo, F. (2015). Simplified life cycle assessment applied to structural insulated panels homes. Análisis de ciclo de vida simplificado aplicado a viviendas de paneles SIP (structural insulated panels). Revista Ingeniería de Construcción, 30(1), 33-38. Recuperado de https://www.ricuc.cl/index.php/ric/article/view/555/html [ Links ]
Corominas, L., Foley, J., Guest, J. S., Hospido, A., Larsen, H. F., Morera, S., & Shaw, A. (2013). Life cycle assessment applied to wastewater treatment: State of the art. Water Research, 47(15), 5480-5492, DOI: 10.1016/j.watres.2013.06.049 [ Links ]
Emmerson, R. H. C., Morse, G. K., Lester, J. N., & Edge, D. R. (1995). The life-cycle analysis of small-scale sewage-treatment processes. Water and Environment, 9, 317-325. Recuperado de http://doi.org/10.1111/j.1747-6593.1995.tb00945.x [ Links ]
ESCAP, United Nations Economic and Social Commission for Asia and the Pacific. (2010). Economic and social survey of Asia and the Pacific: Sustaining recovery and dynamism for inclusive development. United Nations Publication. Recuperado de https://www.unescap.org/sites/default/files/survey2010.pdf [ Links ]
Herrera, J. H., Muñoz, E., & Montalba, R. (2012). Evaluation of two production methods of Chilean wheat by life cycle assessment (LCA) - Evaluación de dos estilos productivos de trigo chileno mediante metodología de análisis de ciclo de vida (ACV). IDESIA, 30(2), 101-110. Recuperado de http://dx.doi.org/10.4067/S0718-34292012000200013 [ Links ]
Hospido, A., Moreira, M. T., Fernández-Couto, M., & Feijoo, G. (2004). Environmental performance of a municipal wastewater treatment plant. Journal of Lice Cycle Assessment, 9(4), 261-271. Recuperado de http://doi.org/10.1007/BF02978602 [ Links ]
IPCC, Panel Intergubernamental del Cambio Climático. (2006). Chapter 3: Solid waste disposal, Volume 5: Waste. In: Eggleston, H. S., Buendia, L., Miwa, K., Ngara, T., & Tanabe, K. (eds.). 2006 IPCC Guidelines for National Greenhouse Gas Inventories, Prepared by the National Greenhouse Gas Inventories Programme (pp. 3.6-3.40). Recuperado de https://www.ipcc-nggip.iges.or.jp/public/2006gl/pdf/0_Overview/V0_0_Cover.pdf [ Links ]
ISO 14040. (2006). ISO 14040:2006 Environmental management - life cycle assessment- principles and framework. International organization for standarization. Recuperado de https://www.iso.org/standard/37456.html [ Links ]
ISO 14044. (2006). ISO 14044:2006 Environmental management. Life cycle assessment. Requirements and guidelines. International organization for standarization. Recuperado de https://www.iso.org/standard/38498.html [ Links ]
ISO 14045. (2012). ISO 14045:2012 Environmental management. Eco-efficiency assessment of product systems. Principles, requirements and guidelines. International organization for standarization. Recuperado de https://www.iso.org/standard/43262.html [ Links ]
Jiang, L., Liu, Y., Hu, X., Zeng, G., Wang, H., Zhou, L., Tan, X., Huang, B., Liu, S., & Liu, S. (2016). The use of microbial-earthworm ecofilters for wastewater treatment with special attention to influencing factors in performance: A review. Bioresource Technology, 200, 999-1007. Recuperado de http://doi.org/10.1016/j.biortech.2015.11.011 [ Links ]
Kalbar, P. P., Karmakar, S., & Asolekar, S. R. (2012). Assessment of wastewater treatment technologies: Life cycle approach. Water Environment, 27, 1-8. Recuperado de https://doi.org/10.1111/wej.12006 [ Links ]
Li, X., Xing, M., & Lu, J. (2013). Properties of biofilm in a vermifiltration system for domestic wastewater sludge stabilization. Chemical Engineering Journal, 223, 932-943. Recuperado de http://doi.org/10.1016/j.cej.2013.01.092 [ Links ]
Lorenzo-Toja, Y., Alfonsín, C., José, M., Aldea, X., Marin, D., Teresa, M., & Feijoo, G. (2016a). Beyond the conventional life cycle inventory in wastewater treatment plants. Science of the Total Environment, 553, 71-82. Recuperado de http://doi.org/10.1016/j.scitotenv.2016.02.073 [ Links ]
Lorenzo-Toja, Y., Vázquez-Rowe, I., & José, M. (2016b). Benchmarking wastewater treatment plants under an eco-efficiency perspective. Science of the Total Environment, 566-567, 468-479. Recuperado de http://doi.org/10.1016/j.scitotenv.2016.05.110 [ Links ]
Lorenzo-Toja, Y., Vázquez-Rowea, I., Chenel, S., Marín-Navarro, D., Moreira, M. T., & Feijoo, G. (2014). Eco-efficiency analysis of Spanish WWTPs using the LCA + DEA method. Water Research, 68, 651-666. Recuperado de http://doi.org/10.1016/j.watres.2014.10.040 [ Links ]
Lourenço, N., & Nunes, L. M. (2017). Optimization of a vermifiltration process for treating urban wastewater. Ecological Engineering, 100, 138-146. Recuperado de http://doi.org/10.1016/j.ecoleng.2016.11.074 [ Links ]
Lundin, M., & Morrison, G. (2002). A life cycle assessment based procedure for development of environmental sustainability indicators for urban Waters systems. Urban Water, 4(2), 145-152. Recuperado de https://doi.org/10.1016/S1462-0758(02)00015-8. [ Links ]
Marti, E. J., & Batista, J. R. (2014). Impact of secondary treatment types and sludge handling processes on estrogen concentration in wastewater sludge. Science of the Total Environment, 470-471, 1056-1067. Recuperado de http://doi.org/10.1016/j.scitotenv.2013.10.070 [ Links ]
Ministerio de Obras Públicas. (2013). Estrategia nacional de recursos hídricos 2012-2025. Recuperado de http://www.mop.cl/documents/enrh_2013_ok.pdf [ Links ]
Muga, H. E., & Mihelcic, J. R. (2008). Sustainability of wastewater treatment technologies. Environmental Management, 88(3), 437-447. Recuperado de http://doi.org/10.1016/j.jenvman.2007.03.008 [ Links ]
Muñoz, E., Vargas, S., & Navia, R. (2015). Environmental and economic analysis of residual woody biomass transport for energetic use in Chile. International. Journal of Life Cycle Assessment, 20(7), 1033-1043. Recuperado de https://doi.org/10.1007/s11367-015-0891-x [ Links ]
Pasqualino, J. C., Meneses, M., Abella, M., & Castells, F. (2009). LCA as a decision support tool for the environmental improvement of the operation of a municipal wastewater treatment plant. Environmental Science & Technology, 43(9), 3300-3307. Recuperado de https://doi.org/10.1021/es802056r [ Links ]
Ribarova, P., & Stanchev, I. (2016). Complexity, assumptions and solutions for eco-efficiency assessment of urban water systems. Journal of Cleaner Production, 138, 229-236. Recuperado de http://doi.org/10.1016/j.jclepro.2016.03.113 [ Links ]
Robaina-Alves, M., Moutinho, V., & Macedo, P. (2015). A new frontier approach to model the eco-efficiency in European countries. Journal of Cleaner Production, 103, 562-573. Recuperado de http://doi.org/10.1016/j.jclepro.2015.01.038 [ Links ]
Rodriguez-Garcia, G., Molinos-Senante, M., Hospido, A., Hernández-Sancho, F., Moreira, M. T., & Feijoo, G. (2011). Environmental and economic profile of six typologies of wastewater treatment plants. Water Research, 45, 5997-6010. Recuperado de http://dx.doi.org/10.1016/j.watres.2011.08.053 [ Links ]
Roohian, H., & Mehranbod, N. (2017). Investigation of bio-augmentation of overloaded activated sludge plant operation by computer simulation. Computers and Chemical Engineering, 104, 11-24. Recuperado de https://www.semanticscholar.org/paper/Investigation-of-bio-augmentation-of-overloaded-by-Roohian-Mehranbod/9f32b7511cc609d2983d58f313b29b6900a4d070 [ Links ]
Samal, K., Dash, R., & Bhunia, P. (2017). Treatment of wastewater by vermifiltration integrated with macrophyte filter: A review. Journal of Environmental Chemical Engineering, 5(3), 2274-2289. Recuperado de http://doi.org/10.1016/j.jece.2017.04.026 [ Links ]
Schmidheiny, S. & Businness Council for Sustainable Development. 1992. The business of sustainable development. In: Schmidheiny, S., & Businness Council for Sustainable Development). Changing Course, A global business perspective in development and the environment (pp. 1-12). Cambridge, USA: Massachusetts Institute of Technology. [ Links ]
SISS, Superintendencia de Servicios Sanitarios. (2017). Informe de gestión del sector sanitario, SISS. Recuperado de https://www.siss.gob.cl/586/articles-17283_recurso_1.pdf [ Links ]
Suh, Y., & Rousseaux, P. (2002). An LCA of alternative wastewater sludge treatment scenarios. Resources, Conservation and Recycling, 35, 191-200. Recuperado de https://doi.org/10.1016/S0921-3449(01)00120-3 [ Links ]
Tomar, P., & Suthar, S. (2011). Urban wastewater treatment using vermi-biofiltration system. Desalination, 282, 95-103. Recuperado de http://doi.org/10.1016/j.desal.2011.09.007 [ Links ]
Received: September 14, 2017; Accepted: August 06, 2019
 Este es un artículo publicado en acceso abierto bajo una licencia
Creative Commons
Este es un artículo publicado en acceso abierto bajo una licencia
Creative Commons
