


 nova página do texto(beta)
 Artigo em XML
 Referências do artigo
 Enviar este artigo por email
 Citado por SciELO
  Similares em
SciELO
Similares em
SciELO 
 Permalink
Urban areas are considered novel anthroposystems with distinctive species composition (Hobbs et al. 2006, Kowarik 2011) mainly due to the arrival of alien species (Mack & Lonsdale 2001), native species loss (Hahs et al. 2009) and stressful abiotic conditions (Bolund & Hunhammar 1999). Flora in urban areas has been widely characterized worldwide showing a high proportion of alien species, as described in cities of Europe (between 19 - 40 %, Ricotta et al. 2012a, Lososová et al. 2016, 2018), North America (19 - 58 %, Clemants & Moore 2003, Knapp et al. 2012), Asia (43 - 77 %, Zhao et al. 2010, Nagendra & Gopal 2011, Wang et al. 2011) and South America (83 - 96 %, Gartner et al. 2015, Figueroa et al. 2016, Fischer et al. 2016). Historical records of urban species allow us to trace their native origin and arrival time in the new ranges (Ricotta et al. 2012a, Lososová et al. 2016, 2018), which raise urban floras as suitable models for the understanding of community assembly mechanisms and vegetation succession dynamics (Corlett et al. 2002, Termote et al. 2012).
Wild edible plants are an important component of urban floras (Díaz-Betancourt et al. 1999). Wild edible plants are defined as species that grow spontaneously in self-sufficient populations in natural or disturbed ecosystems and can exist independently of direct human action (Heywood 1999, Cordero et al. 2020). These species have been considered as a potential contributor to human diets (Guil-Guerrero et al. 1998, Guil-Guerrero 2001, Penafiel et al. 2011, Romojaro et al. 2013, Turan et al. 2003). Will edible plants consider native and naturalized species (including weeds and ruderal plants), as well as domesticated species that scape cultivation and can grow without human interaction (Cordero et al. 2020). Generally wild edible plants in urban areas are alien species (Díaz-Betancourt et al. 1999, Ladio & Rapoport 2002, Tardío 2010, Turner et al. 2011) that show tolerance to the stressful conditions imposed by urban environments. Indeed, wild edible plants shows short life cycles, wind-pollinated flowers, genetic self-compatibility, and higher specific leaf area, which allow them to occur in urban areas (e.g., Lososová et al. 2006, Knapp et al. 2008, 2012). The study of urban flora differentiating wild edible plants from non-edibles may provide information on assembly rules (the mechanisms that explain species co-occurrence) especially when we consider that wild edible plants were dispersed by humans and they were closely linked to human use (Corlett et al. 2002, Termote et al. 2012, Rangel-Landa et al. 2017).
The positive relationship between plant biodiversity and biomass production has been widely recognized in several communities (Cadotte 2013, Sandau et al. 2017). However, whether some clades contribute meaningfully to community biodiversity in urban flora is an unexplored topic that could be filled by identifying the phylogenetic properties of plant assemblages. In this sense, it is expected that phylogenetic diverse assemblages, such as non-edible plants, host a greater plant biomass than edible plants, since in the last group the environmental filters have operated by selecting a group of traits that give adaptive value, reducing phylogenetic diversity of edible plants (Knapp et al. 2012, Cadotte 2013). This hypothesis has been scarcely tested especially in Latin American cities which have a younger history than European ones and could impact plant diversity patterns (Ricotta et al. 2012a, 2012b).
A key factor determining plant distribution and their diversity are climatic conditions, operating both from local (MacKey et al. 2012) to global levels (Seddon et al. 2016). For example, temperature might act as a filter for plant species in cities (which are considered as heat islands) modifying flora composition (Kendal et al. 2018). In this sense, a conclusive characterization of plant biodiversity requires to assess the effects of climatic variables among localities. In addition, whether climatic conditions drive biodiversity (e.g., low precipitation reduces plant diversity), these variables indirectly may drive plant biomass of edible plants. In this study we characterized the taxonomic and phylogenetic diversity of urban flora differentiating wild edible plants from non-edibles in urban areas of central Chile, a biodiversity hotspot characterized by Mediterranean-type climate (Myers et al. 2000). We consider as non-edible those plant species that have not being reported as edible, regardless of whether they are used for other purposes such as fodder, medicine, or fuel. Second, we assessed whether α-diversity (both taxonomic and phylogenetic) is related with productivity (plant biomass). We hypothesize that wild edible plants may exhibit the highest taxonomic and phylogenetic diversity within urban floras, since they have a longer history of use associated with humans than non-edible plants. Furthermore, because biodiversity is strongly associated with biomass, edible plants plant might show higher productivity (biomass per site) than non-edible plants. The positive biodiversity-biomass relationship has been widely described (Cadotte 2013) and it is feasible for urban flora. Overall, our study aims to characterize the taxonomic and phylogenetic α-diversity of urban flora differencing wild edible plants from non-edibles.
Materials and methods
Study area and sampling. The study was conducted in the northern portion of the Chilean Winter Rainfall-Valdivian Forest hotspot (Myers et al. 2000), which is characterized by a Mediterranean-type climate. We studied urban areas within and around the Valparaíso metropolitan area (Figure 1), which has a population of 1,539,852 inhabitants. This is the third most populated city in Chile, with a density of 93.9 inhabitants·km2 (INE 2007). In this region, rains show marked seasonality, with a peak between May and September (373 mm·year-1) and a dry period from October to April (Di Castri & Hajek 1976, Luebert & Pliscoff 2006). Annual mean temperature is around 13.5 °C (Valparaíso), with the lowest in July (11.4 °C) and the highest in January-February (18.5 °C) (Luebert & Pliscoff 2006). This region has been historically disturbed by different anthropogenic impacts such as land cover change and fires (Armesto et al. 2010). These factors have favored a greater proportion of alien plants compared with native plants in this ecoregion (Fuentes et al. 2013).
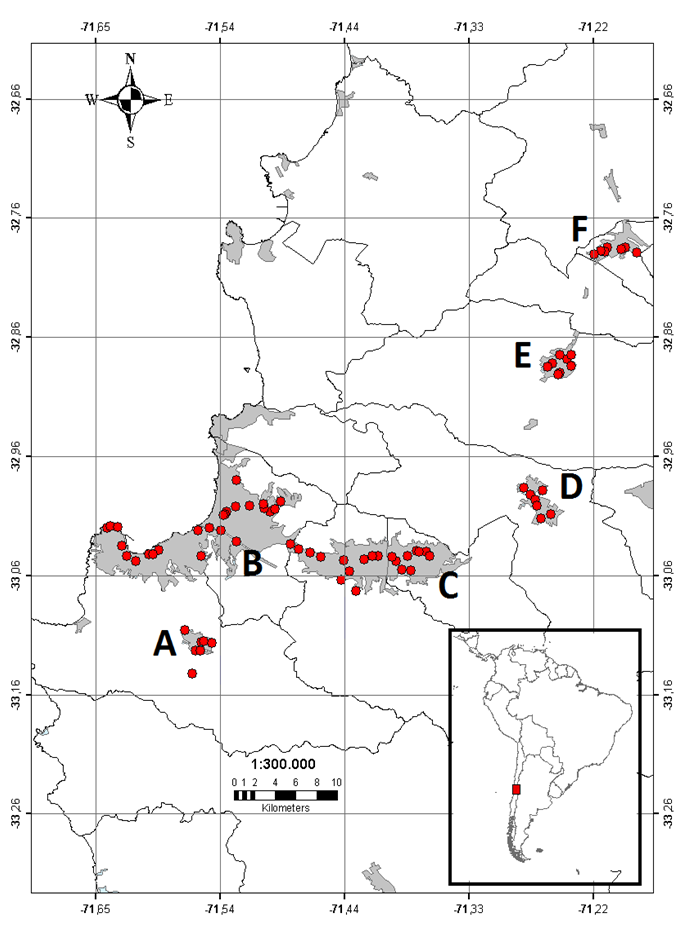
Figure 1 Locations of sampled plots (red dots) in the Valparaíso region. Urban areas are represented by grey polygons and the name of cities by letters. (A) Placilla, (B) Valparaíso-Viña del Mar conurbation, (C) Quilpué-Villa Alemana conurbation, (D) Limache, (E) Quillota and, (F) La Calera.
During the austral spring of 2015 and summer of 2016 (from September 2015 to January 2016) we performed a stratified sampling in urban areas within 500 × 500 m plots (n = 74). Within each plot, we randomly settled 1 × 1 m quadrats distributed where plants occurred, mainly covering parks, vacant lots, and sidewalks. We used 500 × 500 m plots to sample the same number of quadrats per site making our results comparable. This sampling approach allow us data gathering where sampling was feasible because the main surface of cities are pavement areas and private properties that limited a fully random sampling scheme. In total, 277 quadrats were distributed in 74 plots. Our approach might bias results, e.g., overestimating indices of taxonomic diversity such as Shannon-Wiener, when the number of samples is small (Peet 1974), although rarefaction methods were used to avoid this situation (see below). Within each quadrat, we counted the number of plant individuals for each species. All recorded specimens were taxonomically identified and subsequently categorized according to their edibility following the databases PFAF Plants for a Future (2015), SEPASAL (2016) and GRIN (2015). These databases contain around 7,000, 2,745 and 1,603 records of edible plants, respectively. Because these databases are geographically biased, being the flora of South America underrepresented, we also reviewed bibliography allusive to the edible uses of the Chilean flora to complement the available records (Supplementary Material 1).
We settled plots, from north to south, in the following urban areas: La Calera (n = 6/33, numbers are the 500 × 500 m plots and 1 × 1 m quadrats surveyed), Quillota (n = 9/37), Limache (n = 7/32), Valparaíso-Viña del Mar conurbation (n = 25/70, hereafter called Valparaíso), Quilpué-Villa Alemana conurbation (n = 20/70, hereafter called Quilpué) and Placilla-Curauma conurbation (n = 7/35, hereafter called Placilla) (Figure 1; Table S1).
Taxonomic diversity. We estimated the taxonomic ∝-diversity for each using plant species richness and Shannon-Wiener index. These estimators were calculated from rarefaction curves using 999 randomizations and sampling without replacement using the R package iNEXT (Hsieh et al. 2016). To obtain comparable observations among sites, we extrapolated curves up to 60 samples and sites were considered statistically different when 95% confidence intervals of curves did not overlap for 40 samples (RAR40) (Gotelli & Colwell 2001). These analyses were performed independently for wild edible plants and non-edibles.
Phylogenetic diversity. We estimated the phylo-α-diversity of edible and non-edible plants independently, which describe the shared phylogenetic history of species within urban areas. Among the myriad of indexes used to estimate the phylo-α-diversity, we choose Faith’s index (Faith 1992), the mean phylogenetic distance (MPD) and the mean nearest taxon distance (MNTD) (Webb 2000). These indexes are by far, the most common metrics used in the phylogenetic diversity studies (Swenson 2009, Miller et al. 2017) and represent two of three dimensions of evolutionary history: the phylogenetic richness and the species divergence (Tucker et al. 2016). Specifically, Faith’s index (Faith 1992) measures the cumulative phylogenetic distance from the tips to the roots of a phylogenetic tree containing all species within a local assemblage (here, a 500 × 500 m plot). Faith’s index has shown low type I error rates and high power to detect phylogenetic clustering (Miller et al. 2017). The mean phylogenetic distance (MPD) is the average phylogenetic distance among all species pairs within a local assemblage and it is used to characterize phylogenetic relatedness among taxa and to detect phylogenetic overdispersion (unevenness). Finally, the mean nearest taxon distance (MNTD) is the mean distance of each taxon to the nearest terminal node and is a measure of “terminal” (e.g., species, genera) phylogenetic diversity (Webb 2000).
Previous to the estimation of phylogenetic diversity indexes, we built a cladogram that included all recorded species using PHYLOMATIC v.3 (Webb & Donoghue 2005; http://www.phylodiversity.net/phylomatic/). PHYLOMATIC generates a tree that usually contains polytomies at the family and genus level. We obtained a tree with 92 % of the internal nodes resolved and the remaining nodes showed polytomies (nodes with more than two daughter branches). Although the use of incomplete phylogenetic trees could impact estimation of phylogenetic diversity indexes (Swenson 2009), the level of polytomies in our phylogenetic tree allowed us a robust estimation of metrics, since it is far from a maximum of 60 % of polytomies recommended (Davies et al. 2012). The obtained phylogeny was based on the tree version proposed by Zanne et al. (2014), which is the largest time-calibrated phylogeny of plants available to the date. This tree was used to estimate all phylogenetic diversity indexes described in this study. Phylogenetic diversity indexes were estimated using the R package picante (Kembel et al. 2014).
Plant biomass and relationship to diversity. A representative individual was collected per 1 × 1 m quadrat for each species, which was taken to the laboratory, dehydrated for 48 h at 60 °C and weighed. These individuals were considered as representatives of each species since they belonged to the same cohort and did not exhibit considerable variation in their sizes. Weights of representative individuals were used as estimators of the productivity of each species multiplying the weight of the representative individual by the number of individuals of each species within each 1 × 1 m quadrat. Based on this dataset we compared biomass (i) between edible and non-edible plant species, and (ii) among sites. Statistical differences between status (edible vs non-edibles) x sites were assessed using a generalized linear model (glm, Zuur et al. 2009) with gamma distribution, which is used for continuous and positive data, such as biomass (Zuur et al. 2009).
We also assessed the relation between α-diversity (both taxonomic and phylogenetic) and climatic variables on the biomass of edible plants using generalized linear models (glm). We excluded non-edible plants, since the absence of this kind of plants in several samples made it unfeasible to obtain reliable estimators. As α-diversity descriptors (independent variables) we used species richness, Faith’s index, MPD and MNTD. In addition, since climatic variables are a key factor determining diversity, we included the annual mean temperature and annual precipitation in the analyses. These were obtained from WorldClim (Hijmans et al. 2005) and extracted for each plot using DivaGis 7.5 (www.diva-gis.org). To determine the variables that were included in our models, we performed an exhaustive search using the regression subset selection (Lumley & Scott 2017), then, we built three glm models using the suggested variables. Models were ranked according to the Akaike information criterion obtained.
Results
Taxonomic diversity. A total of 77 angiosperm species (57 wild edible plants and 20 non-edibles) were recorded at the studied urban sites. Most of the species were alien: 98 % of wild edible plants and 100 % non-edibles. Solanum maglia (Solanaceae) was the only native edible plant recorded. The edible species were distributed in 20 families and 43 genera; non-edible plants species comprised 11 families and 17 genera (Table S2). The families that contained the greatest richness of wild edible plants were Asteraceae (17 species; 30 % of the species), Brassicaceae (5 species; 9 %), Fabaceae (5 species; 9 %), Malvaceae (4 species; 7 %) and Polygonaceae (4 species; 7 %). The families with the greatest richness of non-edible plants were Poaceae (8 species; 40 % of non-edibles) and Fabaceae (3 species; 15 %).
All the studied sites showed a similar proportion of edible plants (0.74 ± 0.02, mean ± SE, range: 0.63 - 0.79) and non-edibles (0.26 ± 0.02, range: 0.21 - 0.36). The rarefaction curves showed that both richness (S) and Shannon’s index (H’), were greater for wild edible plants (SRAR40 = 48 species ± 2; H’RAR40 = 3.4 ± 0.1; mean ± SE) than non-edible plants (SRAR40 = 16 species ± 1; H’RAR40 = 1.1 ± 0.1) (Table 1; Figure S1). We evidenced a greatest diversity for the edibles using the criterion that 95% confidence intervals did not overlap between studied groups (Table 1; Figure S1). Amon sites, La Calera showed the greatest taxonomic diversity of edible plants, while Quillota showed the greatest biodiversity of non-edible plants (Table 1; Figure S1).
Table 1 Taxonomic richness (S) and diversity (Shannon’s index, H) of wild edible and non-edible plants in urban areas from central Chile (mean ± SE).
| Observed richness (relative proportion in parenthesis) | Estimated richness (SRAR40) | Estimated diversity (HRAR40) | |||||
|---|---|---|---|---|---|---|---|
| Urban areas | Number of plots | Edibles | Non-edibles | Edibles | Non-edibles | Edibles | Non-edibles |
| La Calera | 6 | 26 (0.79) | 7 (0.21) | 49 ± 13 | 19 ± 7 | 3.7 ± 0.7 | 1.4 ± 0.4 |
| Quillota | 9 | 21 (0.63) | 12 (0.36) | 28 ± 8 | 21 ± 7 | 2.2 ± 0.3 | 1.9 ± 0.4 |
| Limache | 7 | 24 (0.77) | 7 (0.23) | 33 ± 7 | 8 ± 3 | 2.9 ± 0.4 | 0.9 ± 0.3 |
| Quilpué | 20 | 31 (0.74) | 11 (0.26) | 38 ± 4 | 12 ± 2 | 2.6 ± 0.2 | 0.9 ± 0.1 |
| Valparaíso | 25 | 29 (0.74) | 10 (0.26) | 32 ± 2 | 11 ± 4 | 2.4 ± 0.2 | 0.9 ± 0.1 |
| Placilla | 7 | 33 (0.77) | 10 (0.23) | 36 ± 12 | 14 ± 5 | 3.6 ± 0.4 | 1.2 ± 0.3 |
| Total | 74 | 57 | 20 | 48 ± 2 | 16 ± 1 | 3.4 ± 0.1 | 1.1 ± 0.1 |
Estimated values were obtained from rarefaction curves for 40 samples per locality (RAR40); number of plots refers to the number of 500 × 500 m in each site
Phylogenetic diversity. Wild edible plants showed a higher phylogenetic diversity (Faith’s index, MPD, and MNTD) than non-edibles in all the studied sites (Table 2). Among sites, we did not detect statistical differences in phylo-α-diversity, except for MNTD for wild edible plants: Quilpué showed the lowest value of MNTD and Valparaíso the highest (Table 2).
Table 2 Phylo-α-diversity estimators of the edible and non-edible plants using three different indexes: Faith’s index, the mean phylogenetic distance (MPD), and the mean nearest taxon distance (MNTD).
| Faith’s index | MPD | MNTD | ||||
|---|---|---|---|---|---|---|
| Urban areas | Edibles | Non-edibles | Edibles | Non-edibles | Edibles | Non-edibles |
| La Calera | 333 ± 64 | 80 ± 2 | 56 ± 12 | 4 ± 2 | 70 ± 14ab | 16 ± 3 |
| Limache | 357 ± 99 | 176 ± 19 | 60 ± 11 | 37 ± 18 | 75 ± 12ab | 45 ± 20 |
| Quillota | 291 ± 49 | 202 ± 69 | 53 ± 12 | 43 ± 20 | 79 ± 13ab | 63 ± 24 |
| Quilpué | 292 ± 41 | 123 ± 14 | 41 ± 7 | 28 ± 8 | 65 ± 8a | 39 ± 12 |
| Placilla | 457 ± 90 | 187 ± 35 | 52 ± 11 | 37 ± 10 | 65 ± 13ab | 66 ± 26 |
| Valparaíso | 257 ± 25 | 123 ± 9 | 51 ± 7 | 23 ± 7 | 101 ± 6b | 100 ± 18 |
| Total | 309 ± 21 | 145 ± 13 | 50 ± 4 | 30 ± 5 | 79 ± 4 | 62 ± 9 |
| Kruskal-Wallis χ2 | 4.256 ns | 8.811ns | 2.408ns | 4.378ns | 12.525* | 7.225ns |
All values are expressed in millions of years (Myr). Different letters indicate significant differences among the sites for each index. * P < 0.05; ns: non-statistical effects
Plant biomass. Biomass was greater for edible (147.5 g ± 31.6, mean ± SE; N = 57 species) than non-edible plants (62.7 g ± 29.5, N = 20 species; Figure 2), with statistical differences between contrasted groups (glm: d.f. = 1, deviance =1175, P < 0.001) but neither among sites (d.f. = 5, deviance = 1028, P = 0.227) nor interaction between factors (d.f. = 5, deviance = 995, P = 0.458; Figure 3). The edible species with the greatest biomass (criteria: > 400 g per 1 × 1 m quadrat) were Chenopodium album L. (Amaranthaceae, 1,013 g ± 137, mean ± se, N = 52 quadrats where the plant occurred), Cichorium intybus L. (Asteraceae, 851 g ± 185, N = 38), Cynodon dactylon (L.) Pers. (Poaceae, 839 g, N = 1), Chrysanthemum coronarium L. (Asteraceae, 655 g ± 205, N = 10), Galinsoga parviflora Cav. (Asteraceae, 550 g, N = 1), and Solanum maglia Schltdl. (Solanaceae, 532 g, N = 1). The only non-edible plant with production greater than 500 g was Conium maculatum L. (Apiaceae, 537 g ± 44, N = 37).
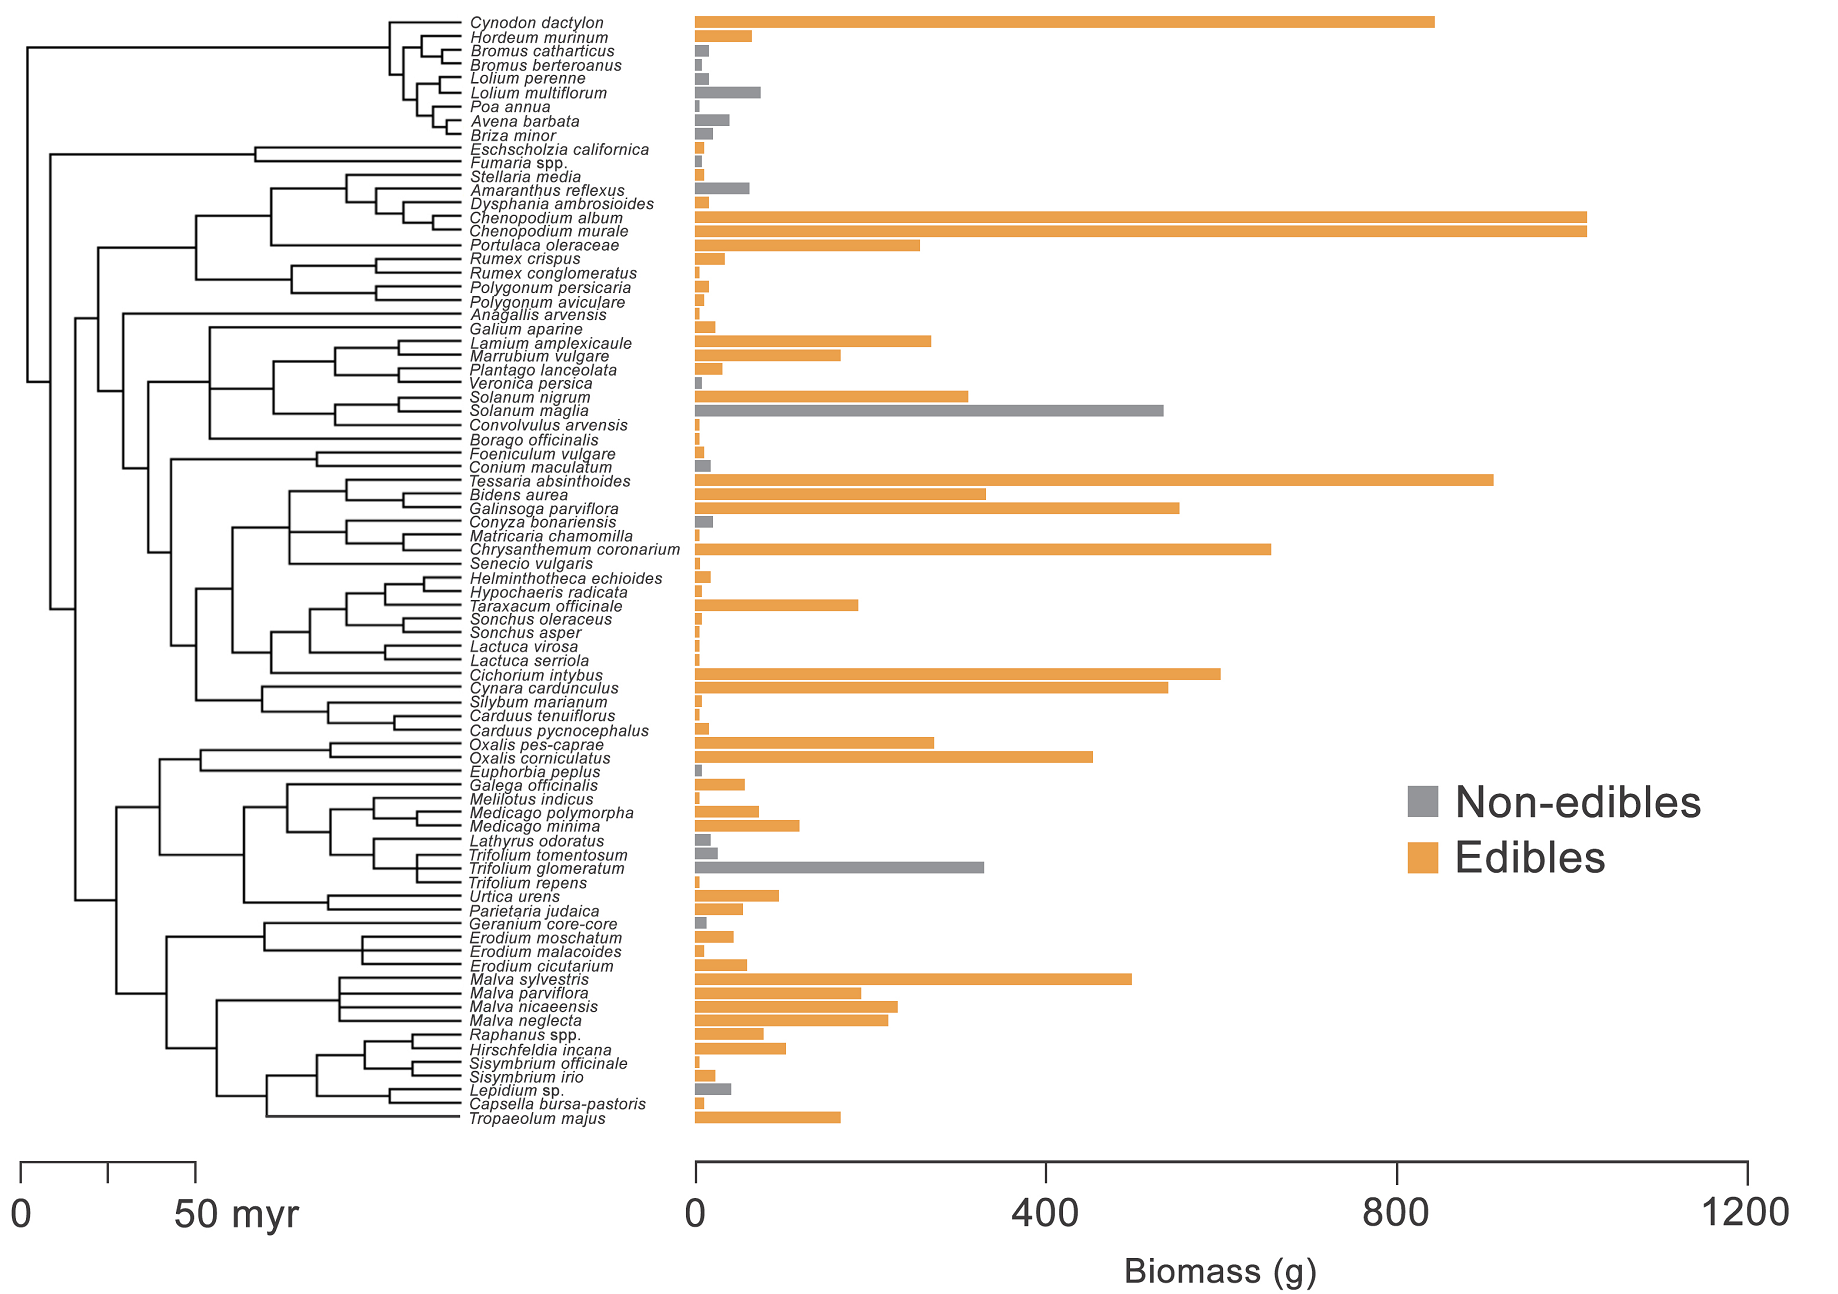
Figure 2 Phylogenetic relationships and biomass of edible and non-edible plants studied in the urban flora of the coastal Mediterranean-type ecosystem, central Chile.
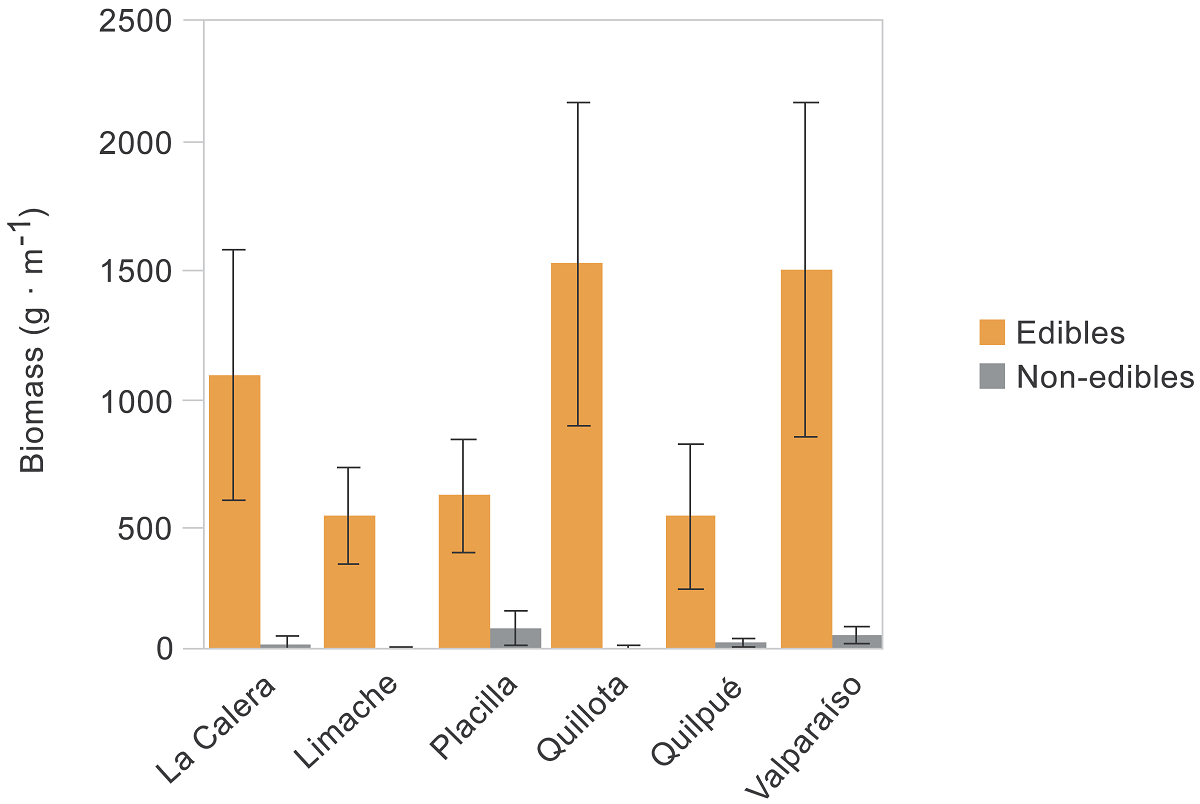
Figure 3 Plant biomass by urban site differentiating wild edible plants and non-edibles. Bars and errors are the mean and SE.
The best model that explained biomass variability of edible plants was related to the taxonomic diversity and climatic variables, but not phylogenetic diversity (Table 3). Indeed, variable selection ruled out PD and MNTD as potential descriptors of edible plant biomass. We detected a positive and significant effect of the plant richness on edible plants biomass (Table 4; Figure 4). In addition, a negative and significant relationship between the mean phylogenetic distance and edible plants biomass was observed (Table 4; Figure 4). In spite of the fact that climatic factors (temperature and annual rain) were included in the models (Table 3), they did not influence edible plant biomass (Table 4).
Table 3 Summarized results of selection of models explained the variation of edible plants biomass in relation to α-diversity descriptors and climatic variables. Models were ordered according to Akaike information criterion (AIC). k is the number of parameters.
| Model | k | AIC | Residual deviance |
|---|---|---|---|
| S + PP + TEM | 4 | 1218.7 | 51.9 |
| PP + TEM | 3 | 1224.8 | 57.4 |
| MPD | 2 | 1232.0 | 55.9 |
| S + MPD | 3 | 1233.3 | 55.5 |
| S | 2 | 1235.4 | 58.4 |
S: species richness; PP: mean annual precipitation; TEM: mean annual temperature; MPD: mean phylogenetic distance.
Table 4 Fixed effects estimates (± standard error) for generalized linear models of edible plant biomass response to plant richness, climatic variables, and phylogenetic diversity. Boldfaced estimates are statistically significant in each model.
| Models | |||
|---|---|---|---|
| Explanatory variables | S + PP + TEM | PP + TEM | MPD |
| Intercept | -3.9·10-3 ± 3.4·10-3 | -5.5·10-3 ± 3.5·10-3 | -7.4·10-4 ± 1.1·10-4*** |
| S | 2.6·10-3 ± 8.9·10-3*** | - | - |
| TEM | -2.4·10-4 ± 1.9·10-4 | -3.3·10-4 ± 2.0·10-4 | - |
| PP | -2.3·10-4 ± 1.3·10-6 | -2.7·10-6 ± 1.4·10-6 | - |
| MPD | - | - | -4.7·10-6 ± 1.6·10-6*** |
S: species richness; PP: mean annual precipitation; TEM: mean annual temperature; MPD: mean phylogenetic distance. *P < 0.05; **P < 0.01; ***P < 0.001

Discussion
Our results show a higher proportion (~ 75 %) of edible plant species in urban areas, demonstrating that this group is an important component of urban floras in central Chile. This pattern may reflect the results of the human-mediated dispersal history on plants: people tend to select plants with food, medicinal or ornamental uses and disperse them within urban areas (Díaz-Betancourt et al. 1999, Rapoport et al. 2009). In general, a high proportion of medicinal and ornamental plants also can be categorized as edibles (Cordero et al. 2017). Thus, the selection and use of these plants may indirectly increase the frequency of wild edible plants in urban areas. In Chile, many plant species introduced in the past for food, medicinal, and ornamental purposes escaped from croplands, gardens, or parks, colonizing urban areas (Matthei 1995). Some of these plants were introduced in Chile during the 19th century in botanical gardens due to their different uses, from where they dispersed and became naturalized in the following decades (Gay 1845-1854). This situation could explain, least partially, the high proportion of wild edible plants in urban areas (Gartner et al. 2015).
Other potential explanation to the great proportion of edible plants in urban areas is the ability of alien weeds to adapt to harsh conditions (McKinney 2006). Almost all the recorded plants in urban areas were alien species (98.7 %). In addition, we observed that taxonomic-productivity relationship, a pattern widely described in several plant systems (Cadotte 2013), also occurs among edible plants of studied cities, but not in not edibles. Contrary to our expectations, we detected a negative relationship between phylogenetic diversity (specifically MPD) and biomass. The mean phylogenetic distance (MPD) is a measure of the basal evolutionary diversity, thus, depicts diversity of plant orders and families. The observed result suggests that less phylogenetic diverse assemblages, which contain species with similar ecological attributes (Cadotte et al. 2008), might host plants that are adapted to harsh conditions of cities (e.g., extreme temperatures) that acted as environmental filters selecting specific plant clades (Knapp et al. 2012, Cadotte 2013). Under this scenario, more similar assemblages show strategies that maximize the use of resources in harsh environments, hampering other potential negative effects of the ecological similarity (e.g., competition, Grime et al. 1973). Conversely, assemblages with a high phylogenetic diversity reduce plant productivity because only diverse singletons (specimens registered once) might occur in these sites, which marginally contribute to productivity.
Worldwide, the plant families that contain the greatest richness of wild edible plants are a subgroup of the richest families (e.g., Apiaceae, Asteraceae, Brassicaceae, Fabaceae, Poaceae, and Rosaceae; Kunkel 1984). We observed an overrepresentation of Asteraceae, Brassicaceae and Fabaceae families among the edible flora studied, which are also the richest families of the alien flora of Chile (Fuentes et al. 2013, Rodríguez et al. 2018). Conversely, Rosaceae was poorly represented in our dataset, as well as among alien plants in Chile where only nine species have been reported (Fuentes et al. 2013). This low number of Rosaceae species in Chile explain, at least partially, their underrepresentation in the edible flora, despite that some edible species are widely distributed out of urban areas, such as Rosa rubiginosa L. and Rubus ulmifolius Schott. In addition, although some Poaceae species were recorded (Hordeum sp. and Lolium sp., both genus with edible species), these specimens were not considered as edibles because individuals only in vegetative stage were observed making their identification unfeasible. Only 4 % and less than 1 % from a total of 30,176 individuals registered in our study belong to Hordeum and Lolium, respectively. Thus, it is likely that their exclusion as edibles did not affect our results.
To the best of our knowledge, this is a pioneer study in the ecology of urban flora since it is the first to characterize different biodiversity components of wild edible plants. However, this must not be considered as an ethnobotanical study. It is necessary design specific studies to elucidate whether wild edible plants that inhabit cities are recognized and potentially used by local people, considering that these areas are subject to greater threats to their biological and cultural diversity (Joos-Vandewalle 2015). The knowledge and use of edible plants in cities may be lost over time. In this sense, counting with an ecological approach to known urban flora will help people to promote the safe use of these wild resources, improving food security in urban contexts (Cordero et al. 2017) and, renewing the interest in the use of plants.
Most people are still unaware of the diversity of useful flora in cities, as well as their beneficial properties, which restricts the use of wild plants for food (Ladio 2005).
Supplementary material
Supplemental data for this article can be accessed here: https://doi.org/10.17129/botsci.2892

