


 nova página do texto(beta)
 Inglês (pdf)
 Artigo em XML
 Referências do artigo
 Enviar este artigo por email
 Citado por SciELO
  Similares em
SciELO
Similares em
SciELO 
 Permalink
Introduction
The COVID-19 pandemic has represented a significant challenge in several social aspects, such as health, economy, and demography, both, at global and national levels (Meyerowitz-Katz et al. 2021; McKibbin and Fernando 2020 and 2021; Papanikos 2020). Likewise, a notable unbalance in published papers on the COVID-19 pandemic related to demographic variables at different geographical levels can be appreciated. In fact, according to Google Scholar on March 14th, 2023, across the world, they are 51.91% for COVID-19 and mortality, 4.73% for COVID-19 and fertility, and 43.36% for COVID-19 and migration, respectively.
All the Mexican demographic variables have been impacted directly or indirectly by the COVID-19 pandemic. For instance, according to official figures of the Mexican Office of Statistics, so-called National Institute of Statistics and Geography - Instituto Nacional de Estadística y Geografía (INEGI 2022), nuptiality declined significatively, because marriages passed from 504,923 to 335,563, that is a fall of 33.5% between 2019 and 2020. Divorces also dropped from 160,107 to 92,739, equivalent to a 42.1% reduction during the same period.
Mortality may be the most immediately impacted variable by the pandemic. That is why it has been widely studied. For instance, Aburto et al. (2022) show that the COVID-19 pandemic effects on loss of life expectancy are equivalent to those observed at the end the World War II; Woolf et al. (2021) argue that the US has experienced a much more significant loss in life expectancy than other high-income countries. Some papers present excess mortality estimates. For instance, for Brazil, Castro et al. (2021); for India, Vasishtha et al. (2021); for the US, Andrasfay and Goldman (2021); for Italy, Ghislandi et al. (2020) and so on.
As for Mexico, García and Beltran (2021) and Silva et al. (2022), using different approaches, have shown high levels of excess mortality. Both papers point out that the most affected geographic unit was Mexico City. Likewise, the male population has suffered the most significant impact in loss of life expectancy, amounting to at least six years. Silva et al. (2022) analyze excess mortality considering official life expectancies for 2019; the results are even more worrisome. Recently, Novak and Vázquez (2022) obtained consistent results quantifying mortality due to COVID-19 through the so-called “years of life” lost in the middle of the pandemic; in turn, Silva et al. (2022) estimate temporary life expectancies in 2020 to identify the main age groups affected by state level in Mexico.
The subject of assessing impact of the COVID-19 pandemic on fertility, in the short-term as well as the mid-term, has received less attention in the literature, particularly for developing countries such as the Mexican case. We decided to work with the absolute number of births instead of fertility rates or another index to figure out an approximation. Indeed, the results of the Population Census 2020 were available in early 2021. However, until now, the yearly figures from 2016 to 2019 about population considering previous population data from Census and National Accounts are unavailable. That is, the so-called demographic conciliation coordinated by CONAPO. We have decided not to estimate birth rates because there is no access to the corresponding and official denominators of the populations in those years.
Likewise, considering the death dynamics in 2020, it is clear that the pandemic altered figures from the 2020 Population Census. Given that the birth trend before the pandemic was decreasing in Mexico, we have formulated the following questions: Is there any crossover between births, falls, and death spikes during the COVID-19 pandemic? Is there any acceleration in the negative trend of the births series? Or Does the birth trend remain unchanged for all mother's ages?
This, paper intends to answer these questions by exploring behavior among births and deaths in Mexico during 2020. A multivariate time series model based on mothers' age groups is estimated to compare the observed births against the expected ones in 2020. We accept there are some limitations though. Due to restrained availability of the Register office during the pandemic, there may be under-recording of births and deaths in INEGI's data. It is also possible that, in some cases, births or deaths may not be registered due to physical difficulties accessing the Register office.
The authors consider that the paper has several justifications, some of them being the COVID-19 impact on the anticipated occurrence of crossovers and fertility trends in a Latin-American country. It is worth saying that this kind of research is limited in this world region. It is also a scenario where significant excess mortality has been evidenced and whose features have been heterogeneity and inequality by sex and state. On the other hand, Mexico is a big developing country, where some behaviors are unexpected regarding previous forecasts made both at international and national population offices. Finally, it is a chaotic context where its population was affected not only by the COVID-19 pandemic but also by a high prevalence of comorbidities like diabetes and obesity (Levaillant et al. 2019) and high homicide rates as well (Gamlin and Hawkes 2018).
Likewise, in terms of demographic dynamics, the presence of crossovers is a strange phenomenon. When the number of deaths is greater than the number of births in a specific moment, a crossover is expected. It happens on catastrophic events such as wars or pandemics. In terms of mortality, it represents the vulnerability of the Mexican health system. This phenomenon is the result of the COVID-19 pandemic and, in general, due to inappropriate handling of the medical care. It also affected by the pre-existent comorbidities that exacerbates infections on the population. On the other hand, in terms of fertility, births have been delayed for several reasons, or there is no access to the Register offices, which explains why there can be underreported events.
Crossovers crop up when deaths are more significant than births at any moment; their analysis is relevant because they may trigger population changes. We name just some of the demographic consequences of the Mexican case. First, an acceleration of aging without the certainty that migration can alleviate it because Mexico is not a typical destination to migrate to. Second, it also could imply a crucial change in the demographic structure. Subsequently, population size could decrease and tend toward a stationary frame. It could also jeopardize the economic feasibility of both the health and pension systems in the future for the high cost to care aging population. That is why, for all these reasons, among others, it could be necessary to formulate societal and public reforms with little time to handle these aftermaths.
It should be remembered that the demographic balancing equation is given by
where the Pt+1 represents the population at time t+1 and is the sum of the population Pt at time t, plus the natural growth (the differences between births, Bt, and deaths, Dt, at time t), plus the social growth (differences between immigration, It, and emigration, Et in that given year). We exclude the social growth, because we are assuming a close population and a lockdown. It is expected that Bt > Dt, wherewith Pt+1 > Pt; instead, if Dt ≥ Bt, that is for instance when a crossover occurs, then Pt+1 ˂ Pt. When this is a systemic pattern, it could tend to a stable age structure. A population is stationary if the growth rate is zero, between times t and t + 1, and the age structure remains constant.
It is worth mentioning that there are other effects on fertility after events of this dimension: delay and catching up. The delay effect is the temporary reduction in fertility due to catastrophic events. Meanwhile, the catching-up effect describes the posterior fertility increase where the population is looking for the pre-event fertility rate. The crossovers we are talking about refer to the behavior in which the deaths and births series jointly present a crossing that, for nonstationary populations, is not expected.
Literature review
As far as we found, papers addressing demographic crossovers are scarce. Some of them are focused on either specific mortality causes (Corti et al., 1999), mortality by race (Johnson, 2000; Eberstein et al., 2008), or mortality under catastrophic events (Song, 2010), or crossovers driven by smoking (Vogt et al., 2017). However, none advocates studying the occurrence of crossovers between births and deaths (or their respective trends) amid a worldwide pandemic event like COVID-19. That is why the rest of this section focuses only on mortality and fertility data in catastrophic events without the crossover occurrences.
Aassve et al. (2020) establish that changes have followed mortality peaks resulting from wars, famines, and pandemics. In the short term, a reduction in the number of births can occur, followed by recovery some years later. Economic and social crises also affect fertility. The authors argue that the ongoing effect of the pandemic will depend on how societies have developed and at what stage they are in the demographic transition. They propose post-pandemic fertility trajectories by regional income levels.
Wilde et al. (2020), US data sets of births are taken from Google trends to measure the impact of the COVID-19 pandemic. They show how to improve forecasting accuracy with statistical learning techniques and using this information. They found that between November 2020 and February 2021, monthly US births dropped approximately 15% (50% higher than the decline in the 2008-2009 Recession, and like the declines following the Spanish Flu pandemic of 1918-1919 and the Great Depression). They also maintain that different effects occur by education level or racial group.
Aparicio (2021) analyzes the impact of COVID-19 on Spain's birth and fertility rates. Based on econometric models, he exposes that the negative fertility trends will continue. However, he says that no prediction intervals let us appreciate if these trends will accelerate. Luppi et al. (2020) present empirical evidence about how couples in several European countries have changed their fertility plans during the COVID-19 pandemic. In conclusion, the authors establish that the plans have been revised. Likewise, there are some differences in some demographic characteristics.
Carballo and Corina (2020) provide future scenarios for fertility trends in some countries using a VAR(p) model. They affirm that the COVID-19 pandemic will accelerate the negative fertility trends in several high and middle-income countries and less in low-income countries. Likewise, they point out that the possible patterns of fertility convergence could also change. They mention that with official fertility statistics, their forecasts using this kind of model are estimated with oficial fertility statistics, and prediction intervals are also provided.
Many research papers focus on the potential impact of COVID-19 on male reproductive organs and fertility. For instance, Khalili et al. (2020) confirm evidence of altered seminal parameters in infected males; Seymen (2020) studies how COVID‐19 damages the testicles and other components of the male genital tract; Illiano et al. (2020) establish hypotheses about damages to the functionality of the testicles and linked inflammatory processes. Unfortunately, for the Mexican case, it is impossible to have similar statistics to describe some possible patterns.
González and Montoya (2021) provide some demographic perspectives on fertility amid the COVID-19 pandemic in Latin-American. They cite that some authors indicate that limited access to contraceptives and lockdown measures could generate both a reduction in population growth and an increase in unwanted pregnancies. Likewise, they also explain other arguments coming from opposite positions. On one hand, due to long-lasting periods of confinement an increase in births is predicted. On the other hand, a downward trend accentuation is likely due to the economic crisis during the pandemic. They agree with CEPAL's projections (2020) that negative fertility trends would not be affected. According to them, it has been observed that the number of births decreases sometime after the outbreak starts. Then it returns to the expected level during epidemics or economic crises. As for Mexico, the Consejo Nacional de Población (CONAPO) estimates 21,575 additional teen pregnancies during the COVID-19 pandemic.
González et al. (2021) claim that the COVID-19 pandemic is affecting fertility levels in Latin-American for different reasons, mainly the availability of sexual and reproductive health services, resources, and equipment and also affected demand and access to such services. It implied a reduction in coverage, an increase in maternal deaths, and unwanted pregnancies. Additionally, maternal mortality and excess maternal deaths associated with COVID-19 are already worrisome (CEPAL 2020).
The effects on teenage pregnancy could be equivalent to a five-year setback in reducing age-specific fertility rates of adolescents in Latin-American and the Caribbean (UNFPA, 2020). According to UNFPA estimates, it would result in 2.2 million unwanted pregnancies, more than 1 million abortions, 3,900 maternal deaths, and 51,400 infant deaths at the end of the year (CEPAL 2020).
Silverio et al. (2023) more recently studied possible changes in fertility and health of newborns in Mexico during the COVID-19 pandemic. The authors show that at the beginning, there was a decrease in the fertility level; but it recovered until close to its original ranks. They also suggest a significant increase in newborns' deterioration, particularly in low birth weight and prematurity.
Data and Methods
Data
Employing observed data, we consider both a descriptive approach and an inferential approach using forecasts. In descriptive statistics, we present the yearly births and deaths for selected years from 1950 to 2020 based on INEGI (2022). In general, we assume that quality has improved over time (although it is recognized that it may be worsened because of the pandemic in specific characteristics such as date of birth and death cause, respectively) (see Table 1). In addition, to be more precise, monthly-observed time series are plotted to compare their collective dynamic behavior. Given the high mortality attributable to COVID-19 and the a priori negative trend before it, some crossovers at the national level are identified. We admit that the patterns could differ in some Mexican states, such as Mexico City.
Table 1 Comparison of births and deaths in Mexico for selected years.
| Year | Births (a) | Δ1 | Deaths (b) | Δ | (a) - (b) |
| 1950 | 1,174,947 | - | 418,430 | - | 756,517 |
| 1960 | 1,608,174 | 433,227 | 402,545 | -15,885 | 1,205,629 |
| 1970 | 2,132,630 | 524,456 | 485,686 | 83,141 | 1,646,944 |
| 1980 | 2,419,467 | 286,837 | 434,465 | -51,221 | 1,985,002 |
| 1990 | 2,735,312 | 315,845 | 422,803 | -11,662 | 2,312,509 |
| 2000 | 2,798,339 | 63,027 | 437,667 | 14,864 | 2,360,672 |
| 2010 | 2,643,908 | -154,431 | 592,018 | 154,351 | 2,051,890 |
| 2019 | 2,092 214 | -551,694 | 747,784 | 155,766 | 1,344,430 |
| 2020 | 1,629,211 | -463,003 | 1,086,743 | 338,959 | 542,468 |
1Difference between decades.
NA: Not Available.
Source: Secretaría de Salud (1995, 2001), INEGI (2022, 2022a)
Initially, analyzing the crossovers through the date of birth was tried, but there were several inconsistencies. Then, it was most appropriate to employ the date of registration that seems most endorsed. Thereby, to be clear, the impact of the COVID-19 pandemic in this paper is on access to civil registration offices instead of fertility trends.
From the inferential point of view, we took INEGI's monthly registered and live births from 2015 to 2020. They were divided into ten 5-year age groups, according to mother's ages, as follows: less than 15 years old (lt15t), between 15 and 19 (f15to19t), between 20 and 24 (f20to24t), …, greater than 50 (gt50t) and those with non-recoded ages (f99to99t). This way, through a statistical model, it is desired to analyze every time series during 2020 separately. The estimated model takes monthly information from 2015 to 2019 and then forecasts 2020 to compare them with the 2020 observed data.
Methods
The selected statistical model corresponds to a multivariate time series model, VAR(p), where p represents the autoregressive order (see Lütkepohl 2005). We choose this model instead of other demographics/statistics options for two reasons: a) we want forecasts that follow the dynamic of the observed data without making any additional assumptions, and b) we desire to estimate simultaneous forecasts of several series. This kind of model in demographic applications has been employed before. See, for instance, Silva et al. (2011) or Silva and Ordorica (2013), and more recently Carballo and Corina (2020). We used R version 4.1.2 (R Core Team 2022) to estimate it, considering the above variables, constants, and trends with the package vars (Pfaff and Stigler 2021). The model essence is to model a set of observed time series jointly; in other words, it is equivalent to an autoregressive equation system. So, the temporal relationships and the dynamic of every time series are considered. The VAR model also provides prediction intervals (PI), whose levels are argued below. Likewise, a 60-month forecast horizon is also estimated.
Granger (1996) states, "A problem with 95% PI is that it will often be embarrassingly wide". He adds, "Intervals of 50% are less likely to be unbelievable, and figures well outside them can be interpreted as possible evidence of a structural break starting an outlier, or some exceptional event" He points out, "It might be worth considering using 50% and 80% intervals, say, to provide 'warning' and 'action' signals that the model is breaking down …" However, in our analysis, PI's are built at 95% because this level seems enough to evidence the significant falls in Mexican birth trends during 2020.
In accordance with González-Rivera (2013), without loss of generality for the case of two-time series, given by {Yt} and {Xt}, they can be simultaneously modeled through a vector. It is of particular interest, given that their interdependence is also implicit in addition to the modeled individual time series. In this way, the VAR (p) model is defined by a system of two regression equations where the regressors are the lagged values of {Yt} and {Xt}
where
Results
There are significant decreases in the Mexican birth trend over time. As a matter of fact, given the different fertility behaviors among the states before the pandemic, it is possible to find different patterns at the state levels, such as in Mexico City, Jalisco, and Nuevo León, where the lowest levels have been registered. In Table 1, at the national level, births present a negative trend at the end of 2000, where the peak was located. In absolute terms, notable and dramatic drops can be appreciated between 2010 and 2020 and 2019 and 2020. As for the death series, the maximum is observed for 2020, almost twice the 2010 number. It is evident how the direct or indirect impact of COVID-19 produced a significant change in 2020. It is worth saying that the difference in births and deaths for 2020 is the smallest in the last 70 years of Mexican demographic history. However, we cannot identify a crossover among the series with an annual periodicity.
From another perspective, see Figure 1, monthly death seasonality is systematic from 2000 to 2019. In contrast, it does not remain for fertility across time. There is a remarkable loss in its seasonality structure of the mortality series in 2020. In turn, the births series had a negative trend around 2013; even more, it went from almost neutral to a negative trend, which seems more profound than ever. Likewise, an abnormal joint behavior among the demographic series in 2020 implies three crossovers in April, May, and June, where their differences are 26,874, 38,786, and 9,530, respectively.
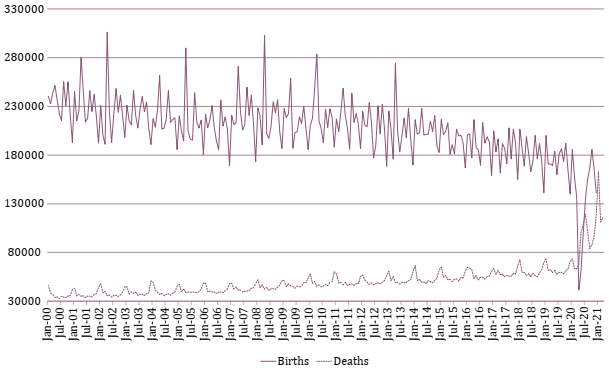
Source: elaboration by the authors with data base don INEGI 2022.
Figure 1 Comparison of monthly observed births and deaths in Mexico, 2000-2020.
It is also important to mention that we found cases with missing data in some variables. Some of them were the mother's age and date of birth. Their percentages were less than 5% respectively, so it was decided to remove them. On the other hand, before 2020, we appreciate, as expected, a positive trend of deaths that goes hand y hand with the population size. In turn, a negative birth trend implies a reduction in the natality rate, which suggests a possible crossover beyond 2020.
It is essential to say that since the Mexican Revolution war, together with the effects of the Spanish flu pandemic, there has not been a situation in which the number of deaths exceeded the number of births. Indeed, the 1910 population Census reported 15,160,369 inhabitants; by 1921, the population had reduced to 14,334,780. Simplistic interpretations attribute the difference to "the million deaths" produced during the war. Several factors explain the reduction of the population. In first place the number of deaths, but also there was a reduction of births due to different reasons: separation of couples, postponement of marriages, and unions that never materialized for the end of deceased would-be husbands (see details in Solis 2013). Finally, migration may have had the slightest effect.
From the 1920s onwards, there was a recovery in the rhythm of the natural population growth- the initial stages of the demographic transition. Over the following decades, mortality declined, and fertility remained high; there was even a slight increment in this variable. Thus, there was a period of considerable expansion of the population in which the number of births exceeded the deaths (see Table 1). Between 1960 and 1970, the growth rate peaked at around 3.5% per year, meaning just 20 years to double the population. In this scenario, the government considered this population growth rhythm excessive in the early seventies. The population policy changed in 1974, abandoning the traditional pro-natality position and establishing goals for the population's natural growth rate (see Table 2).
Table 2 Targets for the narutal growth rate of the Mexican population.
| Year | Rate (%) |
| 1976 | 3.2 |
| 1982 | 2.5 |
| 1988 | 1.8 |
| 1994 | 1.3 |
| 2000 | 1.0 |
When Mexico’s Consaje Nacional de Población (CONAPO) set the targets for the population growth rate, it did not consider the population momentum. Namely, despite the initial reduction in fertility rates, the cohorts that in the following decades would reach childbearing ages had already been born. These cohorts were numerous, and even with lower fertility, they would procreate much more children than those compatible with attaining the targets. These goals were achieved only in 1976 and 1982. For the following years, the momentum impeded the accomplishment of the others.
With hypothetical population projections Aguirre (1986) demonstrated that for the evolution of the population to fit the 1% target in the year 2000, it was necessary to reduce the fertility to levels of 1.45 for the total fertility rate, or 0.667 for the net reproduction rate. Such fertility levels were impossible for the Mexican population during the last years of the previous century. According to CONAPO, in 2000, the actual growth rate was about 1.27%. By 2019 the goal of reduction to 1% for the natural population growth rate had not been attained. Only with an extraordinary event, the COVID-19 pandemic was the target accomplished in 2020.
Additionally, that year, after more than a century, there was a crossover between the number of births and deaths. It remains to be seen if, with the control of the pandemic and the associated reduction of excess mortality, there will be a reverse crossover and an increase in population growth in the years to come. Given the proximity among the Mexican series, we cannot discard that another crossover occurs in the short or medium term.
Estimated VAR model and forecasts
According to Table 3, estimating a valid VAR(p) model was possible. Model fitting was done in the statistical software R version 4.1.2 (R Core Team, 2022). The endogenous variables were: lt15t, f15to19t, f20to24t, …, gt50t, and f99to99t. The sample size was 59, and statistically speaking, we obtained a Log Likelihood= -3606.935. The selected VAR order suggested by the two information criteria was 1 (Hannan-Quinn (HQ) and Schwarz (SC)). It can be said that, although the Akaike (AIC) and Final prediction error (FPE) criteria indicated p = 2, p = 1 was enough to get a valid model. Likewise, the inverse roots of the characteristic polynomial were 0.8088, 0.4882 (twice), 0.4145 (twice), 0.3888, 0.3793, 0.3079 (twice), and 0.1635; some coefficients through t-test were significant at the α = 5%, as well as all the F-tests, were at the α = 10%. The adjusted R2 was 0.7074, 0.7991, 0.8392, 0.7547, 0.7627, 0.7128, 0.5857, 0.2036, 0.4416, and 0.8096, respectively, with a mean of 0.6616. The residuals assumptions were valid: white-noise (Portmanteau test = 1544.1, df = 1500, p-value = 0.2091) and normality (Multivariate Jarque Bera test = 19.102, df = 20, p-value = 0.5152).
Table 3.VAR estimates.
| Variables | lt15t | Sig. | f15to19t-1 | Sig. | f20to24t | Sig. | f25to29t | Sig. | f30to34t | Sig. | f35to39t | Sig. | f40to44t | Sig. | f45to49t | Sig. | gt50t | Sig. | f99to49t | Sig. |
|---|---|---|---|---|---|---|---|---|---|---|---|---|---|---|---|---|---|---|---|---|
| lt15t-1 | -1.083 | -4.571 | -5.718 | -5.486 | -1.992 | -1.615 | -0.085 | -0.042 | 0.024 | 0.640 | ||||||||||
| f15to19t-1 | 0.028 | 1.117 | * | 0.935 | 0.840 | 0.396 | 0.213 | 0.048 | 0.005 | 0.001 | 0.022 | |||||||||
| f20to24t-1 | -0.151 | 0.127 | 0.721 | 0.651 | 0.659 | 0.275 | 0.004 | 0.007 | -0.006 | . | -0.075 | |||||||||
| f25to29t-1 | -0.025 | -1.065 | -1.843 | -1.384 | -1.204 | . | -0.565 | -0.102 | -0.015 | -0.001 | -0.155 | |||||||||
| f30to34t-1 | 0.064 | . | -0.178 | -0.291 | -0.397 | -0.232 | -0.215 | . | 0.008 | -0.001 | 0.006 | 0.208 | ||||||||
| f35to39t-1 | -0.123 | . | 0.148 | 0.509 | 0.015 | 0.337 | 0.390 | . | 0.073 | -0.007 | -0.000 | -0.219 | ||||||||
| f40to44t-1 | 0.063 | -4.111 | -6.164 | -5.217 | -3.591 | -1.729 | -0.286 | 0.032 | 0.038 | * | 0.338 | |||||||||
| f45to49t-1 | 0.482 | 8.302 | 20.350 | 20.061 | 12.404 | 5.681 | 1.453 | 0.259 | -0.128 | * | 0.894 | |||||||||
| gt50t-1 | 1.157 | 19.361 | 42.315 | 52.450 | 36.104 | 18.374 | 5.725 | 0.318 | 0.352 | * | 7.372 | |||||||||
| f99to99t-1 | 0.036 | 1.430 | * | 1.588 | 1.345 | 0.865 | 0.529 | . | 0.127 | 0.006 | 0.003 | 0.678 | *** | |||||||
| constant | 1237.87 | *** | 50546.183 | *** | 84510.78 | *** | 66102.32 | *** | 43410.89 | *** | 21782.60 | *** | 5283.00 | *** | 369.63 | ** | 61.20 | * | 6986.97 | *** |
| trend | -1.156 | 10.553 | -21.396 | 114.993 | 93.071 | 50.391 | 4.029 | 1.347 | -0.673 | . | -19.365 | |||||||||
| sd1 | 99.72 | 6251.20 | ** | 12046.43 | *** | 10148.56 | *** | 5922.06 | *** | 2611.93 | ** | 440.00 | . | 31.94 | -9.64 | -253.84 | ||||
| sd2 | 301.37 | *** | 10084.85 | *** | 14026.63 | *** | 10888.95 | *** | 5901.29 | *** | 2951.43 | *** | 774.00 | *** | 48.40 | . | 23.86 | *** | 1568.07 | *** |
| sd3 | 191.04 | *** | 4841.40 | ** | 7373.54 | ** | 5031.27 | ** | 2516.61 | * | 1323.61 | * | 411.90 | * | 37.97 | 9.08 | 1084.16 | ** | ||
| sd4 | 210.89 | *** | 5224.47 | *** | 8469.74 | *** | 6074.96 | ** | 3212.80 | ** | 1601.03 | ** | 551.60 | ** | 55.50 | * | 8.07 | 510.27 | ||
| sd5 | 205.09 | *** | 5758.05 | *** | 9375.23 | *** | 6973.12 | *** | 3566.70 | ** | 1545.37 | * | 315.50 | . | 9.47 | 4.34 | 607.22 | |||
| sd6 | 221.30 | *** | 3868.28 | ** | 6697.79 | *** | 4595.26 | ** | 2003.41 | * | 807.38 | 199.40 | 17.03 | 7.37 | 959.46 | ** | ||||
| sd7 | 160.12 | ** | 2233.15 | . | 4436.48 | * | 3136.38 | . | 1203.82 | 484.99 | 137.10 | 16.92 | 9.68 | . | 310.25 | |||||
| sd8 | 307.81 | *** | 7739.91 | *** | 12542.29 | *** | 10337.86 | *** | 5961.36 | *** | 2779.26 | *** | 736.30 | *** | 57.77 | * | 9.25 | . | 2304.61 | *** |
| sd9 | 159.24 | ** | 5554.97 | *** | 10288.03 | *** | 8421.85 | *** | 4653.67 | *** | 2094.74 | *** | 343.80 | * | 27.47 | -4.11 | 144.16 | |||
| sd10 | 217.97 | *** | 7773.88 | *** | 12958.22 | *** | 11223.69 | *** | 7089.55 | *** | 3261.89 | *** | 661.11 | *** | 50.59 | * | 2.90 | 660.03 | * | |
| sd11 | 233.01 | *** | 7749.16 | *** | 13268.56 | *** | 10759.24 | *** | 6591.63 | *** | 3043.93 | *** | 608.50 | *** | 36.76 | 1.75 | 1287.31 | *** | ||
| RSE36 | 59.31 | 1573 | 2343 | 1975 | 1237 | 653.2 | 198.5 | 30.4 | 7.17 | 409.0 | ||||||||||
| R2 | 0.818 | 0.875 | 0.900 | 0.848 | 0.853 | 0.822 | 0.743 | 0.506 | 0.653 | 0.882 | ||||||||||
| Adjusted R2 | 0.707 | 0.799 | 0.839 | 0.755 | 0.763 | 0.713 | 0.587 | 0.204 | 0.442 | 0.809 | ||||||||||
| F22,36 | 7.37 | 11.49 | 14.75 | 9.11 | 9.47 | 7.54 | 4.74 | 1.67 | 3.09 | 12.19 | ||||||||||
| p-value | 0.000 | 0.000 | 0.000 | 0.000 | 0.000 | 0.000 | 0.000 | 0.083 | 0.001 | 0.0000 |
Source: N/A. Sig. codes: 0 ‘***’ 0.001 ‘**’ 0.01 ‘*’ 0.05 ‘.’ 0.1 ‘ ’ 1.
Regarding the forecasts, we obtained results pointing to heterogeneity based on the mother's ages (see Figure 2). First, for women under 15, just three observed data are within the prediction intervals: February, September, and December. Additionally, from 15 to 19, three observations corresponding to the same months are within the intervals. The essential birth increases for these groups, expected by UNFPA (2020) and CEPAL (2020), were not registered. Although there may have been under-recoding of births in INEGI's data, it seems too unlikely that the observed data could have been within the prediction intervals considering this information.
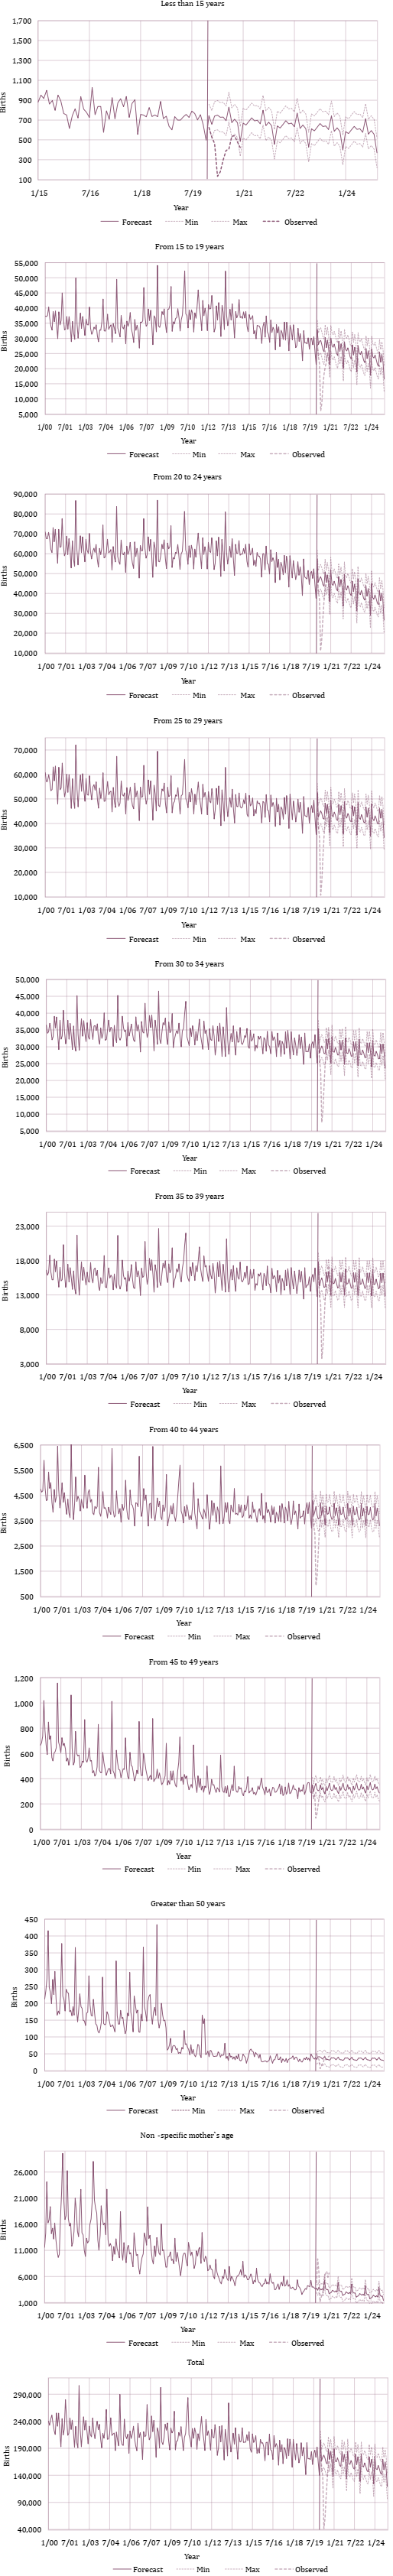
Source: elaboration by the authors based on INEGI 2022.
Figure 2 Monthly forecasts based on mother’s ages from 2020 to 2024.
Secondly, for women from 20 to 24, 25 to 29, and 35 to 39, only five observations (February and September to December) are within the prediction intervals in each case. Meanwhile, for 30 to 34 and 40 to 44, half of the data fall out of their prediction intervals. Both cases occurred in February, September through December, July, and January. In turn, 9 of 12 observed data for women from 45 to 49 and 50 and over are within the prediction interval. They were the cases where accuracy was the highest. All observed data are contained, except from April to June in the first group and January, April, and May in the second group. Finally, for women whose ages were not specified, the observed data were far away from the upper band of the prediction interval. The structure of these observed data was too different from the rest of the forecasts, and only three observations, the correspondence from June to August, were within the forecasting intervals.
It is hard to predict the future behavior of the birth trends in Mexico. Nevertheless, we consider three possibilities if the recovery conditions prevail. One alternative could be that all of them follow their expected negative trend without change, which implies a rate of demographic aging such as has been forecasted for 2050. Alternatively, it could be an accelerated downward trend for all or some mother's groups ages. In function of its magnitude, it could also trigger accelerated aging and suggest new demographic policies. And finally, a kind of "Baby boom" where women exercise their reproductive capacity given that the conditions have improved. Whatever it may be, it is considered that the Mexican government would have to make the best decisions and measure the principal impacts.
Conclusions
The anticipated occurrence of crossovers appears to have been shown during the COVID-19 pandemic in Mexico. Given the dynamics of both series, the possibility of more than one of them, at least in the short term, is evident. In general, the presence of crossovers suggests the reality of an unstable situation regarding social, economic, health, or political issues. In Mexico, there was a conjuncture: excess mortality produced a crossover, given the descending trend that the births ratio.
Overall, a strong impact produces a profound fall on the birth trend, mainly affecting the first half of 2020 for all mother's ages whose ages were specified. This effect also is appreciated when all ages are jointly considered. If this situation spreads to other periods, it could trigger some demographic or economic consequences in Mexico, such as changes in the regular rhythm of aging and more financial pressure in the medium term for the domestic pensions and health systems. That is why one of the major concerns for the decision-makers should be to analyze the official figures from INEGI or other sources for 2021 to evaluate the new circumstances that, to some extent, threaten Mexican society's social and economic stability.
In a nutshell, the occurrence of the kind of crossovers studied here makes the natural growth turn out negative in one or several moments, which could generate the need to implement new societal or public policies for mitigating their consequences in a short or medium term. That is why it is crucial to analyze and predict the crossovers' occurrence to consider their impacts on the potential and new demographic dynamics.

