


Serviços Personalizados
Journal
Artigo
 texto em
  Inglês (pdf)
 Artigo em XML
 Referências do artigo
 Enviar este artigo por email
Indicadores
-
 Citado por SciELO
 -
 Acessos
Links relacionados
-
 Similares em
SciELO
Similares em
SciELO
Compartilhar

 Permalink
Revista mexicana de ciencias forestales
versão impressa ISSN 2007-1132
Rev. mex. de cienc. forestales vol.8 no.41 México Mai./Jun. 2017
Article
Comparison of stand techniques in forest masses of the Sierra Madre Occidental in Durango State
1Doctorado Institucional en Ciencias Agropecuarias y Forestales. Universidad Juárez del Estado de Durango. México.
2Instituto de Silvicultura e Industria de la Madera. Universidad Juárez del Estado de Durango. México. Email: jcorral@ujed.mx
3Facultad de Ciencias Forestales, Universidad Juárez del Estado de Durango. México.
The management units established in the management plans, according to the guidelines established in Mexican Official Standard NOM-152-SEMARNAT-2006, are the stands and the subcompartments. Currently, the method most commonly used to stratify the forest is based on photointerpretation, which involves a high degree of discretion that affects the estimates of parameters that depend mostly on the stand area, such as growing stock, basal area, among others. In order to contribute to sustainable forest management, it is necessary to maintain the same delimitation of the management units, in particular of the stands, unifying the technical criteria to guarantee its adequate monitoring. This work had the goal of comparing two stand delimitation techniques: i) the traditional method, based on photointerpretation, and ii) a new method developed in this study, derived by means of a semi-automated technique based on a geomorphometric analysis of watersheds generated from three Digital Elevation Models (Inegi, ASTER y SRTM), using procedures of Geographic Information Systems (SIG), mostly the ArcGIS 10.0 software. Data of 51 forest properties located in the Sierra Madre Occidental of the state of Durango were used. The results of the statistical comparison among the mean values of the elevation, slope and exposure variables obtained by the photointerpretation method and those generated by the semi-automated technique did not show significant differences in the exposure variable (p> 0.05), while for the elevation and slope variables the differences were statistically significant (p <0.01). Study findings concluded that the stands generated by means of the semi-automated technique allows the generation of homogenous stands in terms of the characteristics of elevation, slope and aspect.
Key words: Morphometric analysis; zonal statistics; photointerpretation; mass trees; Digital Elevation Model (DEM); stand
Las divisiones dasocráticas definidas en los Programas de Manejo, de acuerdo a los lineamientos que establece la Norma Oficial Mexicana NOM-152-SEMARNAT-2006, son el rodal y el subrodal. Actualmente, el método más usado para estratificar las masas forestales se basa en la fotointerpretación, lo cual implica un alto grado de discrecionalidad que afecta a los parámetros que dependen principalmente de la rodalización para calcular las existencias volumétricas, el área basal, etcétera. Para contribuir al manejo forestal sustentable es necesario conservar la misma delimitación de las unidades básicas de manejo, en particular los rodales, mediante la unificación de criterios técnicos que permitan lograr un buen seguimiento. El objetivo de este trabajo fue comparar dos técnicas de rodalización: una de fotointerpretación y otra semiautomatizada, desarrollada en el presente estudio, basada en el análisis geomorfométrico de generación de cuencas hidrológicas, a partir de tres Modelos Digitales de Elevación (Inegi, ASTER y SRTM) y el uso de técnicas de Sistemas de Información Geográfica, con el software ArcGIS 10.0. Se utilizaron datos de 51 polígonos de predios bajo aprovechamiento forestal de la Sierra Madre Occidental. La comparación estadística entre los valores medios de los estadísticos de zona generados a través de fotointerpretación, y de aquellos obtenidos de forma semiautomática, no mostraron diferencias significativas en la exposición (p>0.05), mientras que la elevación y la pendiente registraron estimaciones estadísticamente distintas (p<0.01). Se concluye, que la rodalización generada a partir del método semiautomatizado permite obtener delimitaciones homogéneas de rodales en cuanto a la altitud, pendiente y exposición, independientemente del MDE utilizado.
Palabras Clave: Análisis geomorfométrico; estadística zonal; fotointerpretación; masas forestales; Modelo Digital de Elevación (MDE); rodal
Introduction
The forests of the state of Durango constitute the first forest reserve in the country. They cover a surface area of 5.5 million hectares and they contribute over one fourth of the production of timber in Mexico (Corral-Rivas et al., 2015). The surface area under exploitation in Durango is estimated in 2 million hectares (Luján et al., 2016); for this reason, forest planning becomes an important task for forest managers, who require an adequate delimitation and classification of the land surfaces at stand level, as well as a minimum management unit (NOM-152-SEMARNAT-2006) (DOF, 2008).
The delimitation of a forest stand allows planning the management and conservation activities, and monitoring the applied silvicultural treatments (Nájera-Frías et al., 2013). However, as Hernández-Díaz et al. (2008) point out, the criteria used for each technical manager to define the basic management units are usually modified through time, bringing about changes in the stand delimitation units; this dramatically reduces the possibilities of carrying out the temporary monitoring (traceability) required for the sustainability of the forest management practices, regardless of the silvicultural system that is being utilized.
According to the Mexican Official Norm 152-SEMARNAT-2006, a stand is the basic forest management unit. Its delimitation is defined by such permanent characteristics as the soil type, the slope, the watersheds and the streams; this allows monitoring the dasometric variables in the various felling cycles through time, along with the likelihood of changes in the soil use, in the applied silvicultural system, or in other variables. González et al. (2004) point out that there is no precise definition of the factors to be considered in order to delimit the stands; however, there are various geospatial processes for defining homogenous areas (Velasco et al., 2013). Hernández-Díaz et al. (2008) indicates that there are variations as to the way of characterizing and delimiting the stands, and recommends taking into account only those distinctive features that are stable in time, like the physical properties of the terrain (altitude, exposure and slopes).
Forest stand delimitation is essentially based on photointerpretation techniques, and therefore the results depend largely on the computer expertise for interpreting the in-field reality and on the scale used for digitalization (González et al., 2004). On the other hand, in most cases there is no digital input corresponding to the same dates at a cartographic level, or the mapping is based on aerial photographs or orthophotographs with a low spatial resolution or with the presence of clouds (Ancira-Sánchez y Treviño, 2015).
Based on the above, a homogenous forest cartography must be generated through the definition of process flows to facilitate a correct stand delimitation and, at the same time, to allow the preservation (through time) of the same surface area delimitation for a more accurate assessment of the silvicultural activities planned within the management programs.
An option for the generation of a quality standardized stand delimitation is the use of the Digital Elevation Model (DEM), defined as a regular matrix representation of the continuous variation of the relief in space, whose structure in a cell format favors the implementation of mathematical algorithms in a simple, effective way (Burrough, 1986). Within this context, the purpose of the present research was to compare two stand delimitation techniques -the first, uses the traditional methodology, based on photointerpretation, while the second utilizes a semi-automated method and is based on the geomorphometric analysis of the generation of watersheds according to the DEM and the use of free GIS software packages (Pike, 2000; Rasemann et al., 2004).
Materials and Methods
Study area
It is located on the Western Sierra Madre (WSM), in the southwest of the state of Durango, Mexico. It includes parts of the municipalities of Pueblo Nuevo, Durango and San Dimas within UMAFOR 1008, between the extreme coordinates 106°00'0.668" W, 23°03'2.2" N and 105°11'12.2" W, 24°11' 57.8" N (Figure 1).

The study area measures 853 255.98 ha and is located in the great province known as the Western Sierra Madre. Its topoform systems are Great Plateau with Ravines, High Mountain Range with Ravines and Typical Cannyon. The mean altitude is 1 784 masl; the maximum altitude is 3 321 masl, and the minimum, 242 masl. The slopes range between 0 % and 100 %, with an average of 19.2 %. The climates registered in the region are subhumid temperate, with a warm summer (C(w2)a,) (97 %) and semiwarm subhumid, within the group of temperate climates ((A)C(w2)(w) (3 %), according to Köppen’s climate classification modified by García (1988). Figure 2 shows the nine sub-watersheds that make up the study area.

The vegetal cover of the area consists of pine, pine-oak and oak forests (85 %), low deciduous and sub-deciduous forests (6 %), induced grasslands (6 %) and rainfed agriculture, medium deciduous and sub-deciduous forests, human settlements and chaparral (the remaining 3 %). The prevailing soil types are Regosol (38 %), Lithosol (34 %) and Cambisol (17 %), and, in a lesser proportion: Acrisol (5 %), Ranker (4 %) and Vertisol (2 %).
The present research used data from 51 polygons of forest plots managed by staff of Forest Services Provision Unit (UPSE) No. 6. The first database consisted of the stands generated using photogrammetric techniques with digital orthophotograps (Inegi, 2013). The stands were digitalized by members of the technical staff of UPSE No. 6, based on the photointerpretation criteria using the ArcGis 10.0 software (ESRI, 2011), and corresponds with their most recent delimitation (2017-2027 felling cycle). For comparative purposes, the polygons of the plots were united, and a single identifier was assigned to each stand.
The second database consisted in the generation of stand with semi-automated procedures, based on geospatial processes using GIS software with the digital input of three Digital Elevation Models (DEMs). The following DEMs were considered: (i) Inegi, Continuum of Mexican Elevations (CEM 3.0) of the National Institute of Statistics and Geography (Instituto Nacional de Estadística y Geografía) (Ávalos, 2004; Inegi, 2015); (ii) ASTER (Advanced Spaceborne Thermal Emission and Reflection Radiometer), from the Terra satellite (Abrams, 2000; NASA 2015); and (iii) SRTM, of the Shuttle Radar Topography Mission (Rabus et al., 2003; USGS, 2015). The DEMs have a 30 m x 30 m pixel size and are georeferenced to projected UTM coordinates, Zone 13, using WGS84 datum.
The delimitation of the stands or micro watersheds was based on the SIATL (2015) Information GeoPortal of INEGI, consisting of vector information from the hydrographic Network at a 1:50 000 scale, which models the superficial drainage of a watershed.
Stand delimitation using the DEM’s geomorphometric land surface analysis
Debugging of DEMs. The DEMs utilized for stand delimitation exhibit various sources of error: (i) positional, deficient geographical location of the marked points or of the contour line trajectory; (ii) altitude values; or (iii) related to the interpolation process. The most common refer to the existence of depressions, areas surrounded by cells with a higher altitude, and peaks surrounded by areas or cells with lower altitudes (Pérez and Mas, 2009).
In order to avoid the effect of depressions on DEMs, direction flow geoprocessing was applied (Neteler, 2005), using the GRASS GISTM software (GRASS, 2012). Subsequently, a mean (student t) test was carried out to verify the existence of significant differences in the altitude variable between the various analyzed DEMs.
Stand delimitation
The stands were semi-automatically delimited based on the DEMs in the GRASS GISTM software (Jasiewicz and Metz, 2011; GRASS, 2012). The minimum desired size was specified, according to the mean surface area of the stand estimated using the photogrammetric database, with 115 has and a minimum size of 10 ha. The pixel size of the models --30 m x 30 m (900 m2 per cell)-- was considered for one hectare (10 000 m2), and a size of 11.11 cells per hectare was determined; thus, a value of 111.11 cells was used to delimit watersheds with a minimum size of 10 ha.
Once the dasocratic division was created, the stands were converted to a vector format in order to soften the border line, eliminating those polygons that were under 10 ha using routines developed in the open-source PYTHON programming language code (van Rossum and Drake, 2011) in order to estimate the micro watersheds or stands.
Figure 3 shows the first modeling of the terrain for semi-automatic stand delimitation based on a DEM in a process flow in which the polygons were defined according to the micro watersheds and to the drainage network, using the Strahler method of classification, in which the first-order drainage sections receive the water directly from the mountain sides (Zambrano et al., 2011).

The second process block (Figure 4) shows a cycle with each of the polygons generated in the previous block; these intersect with the drainage network within them in order to carry out a subdivision of the same and to form the study area stands.

The slope intervals (in percentages) were derived using spatial analysis geoprocessing, and reclassified and coded as shown in Table 1.

Subsequently, the exposure data were classified according to Table 2.

Zonal statistics
The values of the altitude, slope variables and mean exposure derived from the various DEMs were calculated using zonal statistics geoprocessing (QGIS, 2014). This procedure allows estimating the statistics by defining the raster layer pixels (DEM) through the superimposition of a vector layer of polygons that correspond to the generated stands.
Statistical analysis
The statistical comparison between the mean values of the altitude, slope and exposure variables of the stands generated in the process by using photointerpretation of the images viewed in the computer and those generated semi-automatically for this study using the Kruskal-Wallis non-parametric method (Kruskal and Wallis, 1952), which does not assume the normality of the data or homogeneity of variance as a hypotheses. The significance of the differences was determined considering a confidence interval of 95 % ( = 0.05). The analysis was carried out using the NPAR1WAY of the SAS/STATTM statistical system (SAS, 2008). In addition, kite and box plot diagrams were developed for each variable in order to facilitate the interpretation of the results.
Results and Discussion
Debugging of the DEMs
Table 3 shows the results of the statistical comparison of the mean altitude of the stands between the original and the corrected DEMs. No statistical differences were observed between any of the mean altitude values (p>0.05). There were no differences in the DEM developed by INEGI, while those of NASA (ASTER and SRTM) exhibited minimal differences.

Comparison between stand delimitation techniques
Table 4 shows the statistics describing the altitude, slope and exposure variables for the stands or micro watersheds generated with each of the assessed stand delimitation techniques. The photogrammetric technique produces a higher number of stands than the semi-automated method.
Table 4 Statistics describing the stands obtained with the semi-automated method and the photointerpretation technique, based on the 51 polygons of the plots used in this research.
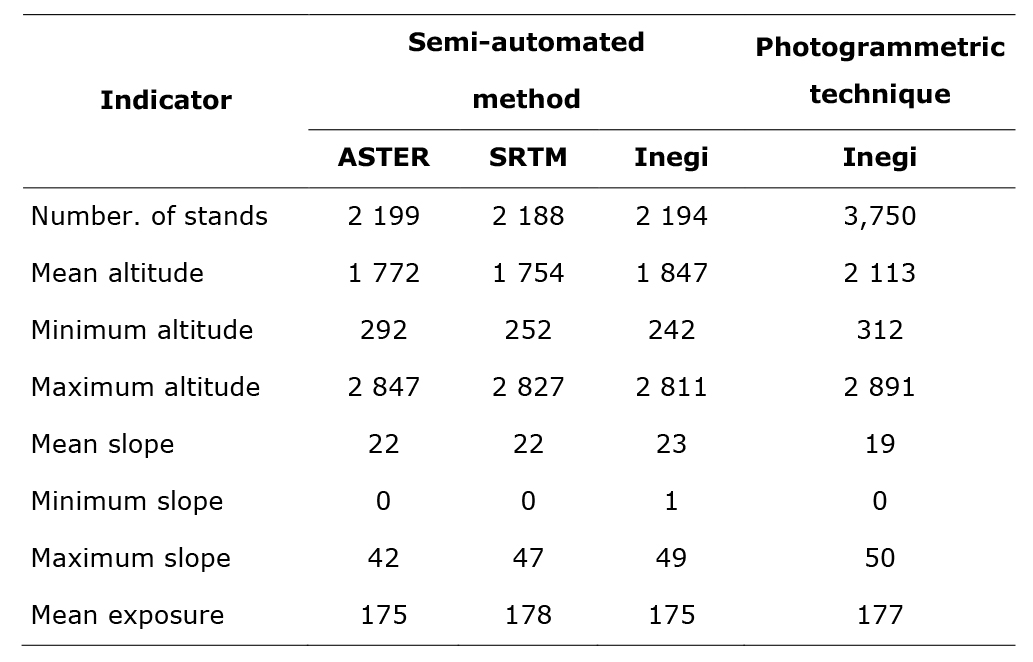
The analysis of the mean altitude of the stands using the semi-automated method registers a variation of 18 to 93 masl between the ASTER and SRTM models, with respect to that of Inegi. The slope intervals of the stands varied in the first model, describing a steep terrain. No significant variations were found for the exposure variable; the result was a prevalent southward exposure.
Figure 5 shows continuity and homogeneity in the outline of the stands corresponding to the three DEMs generated with the semi-automated method based on the geomorphometric land surface analysis of the various DEMs analyzed.

The results of the Kruskal-Wallis non-parametric test carried out in order to assess significant differences in the generation of stands using the photogrammetric technique and the semi-automated method, in the geomorphometric analysis of the various DEMs are shown on Table 5. Highly significant differences (p<0.01) were determined between the DEMs for the altitude and slope variables, while there were no significant differences (p>0.05) for the exposure.
Table 5 Results of the Kruskal-Wallis test for the assessment of differences in the considered variables between the stands generated through photogrammetric techniques and through the semi-automated method for the geomorphometric land surface analysis, by DEM.
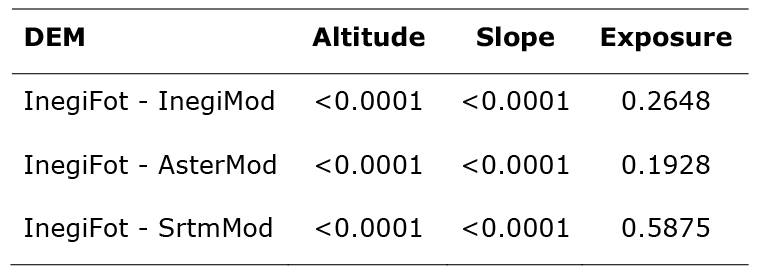
Fot = DEM of the stands generated using photogrammetric techniques; Mod = DEM of the stands generated with the semi-automated method for the geomorphometric land surface analysis.
Figure 6 shows the mean values for each variable and DEM using kite and box plot charts.
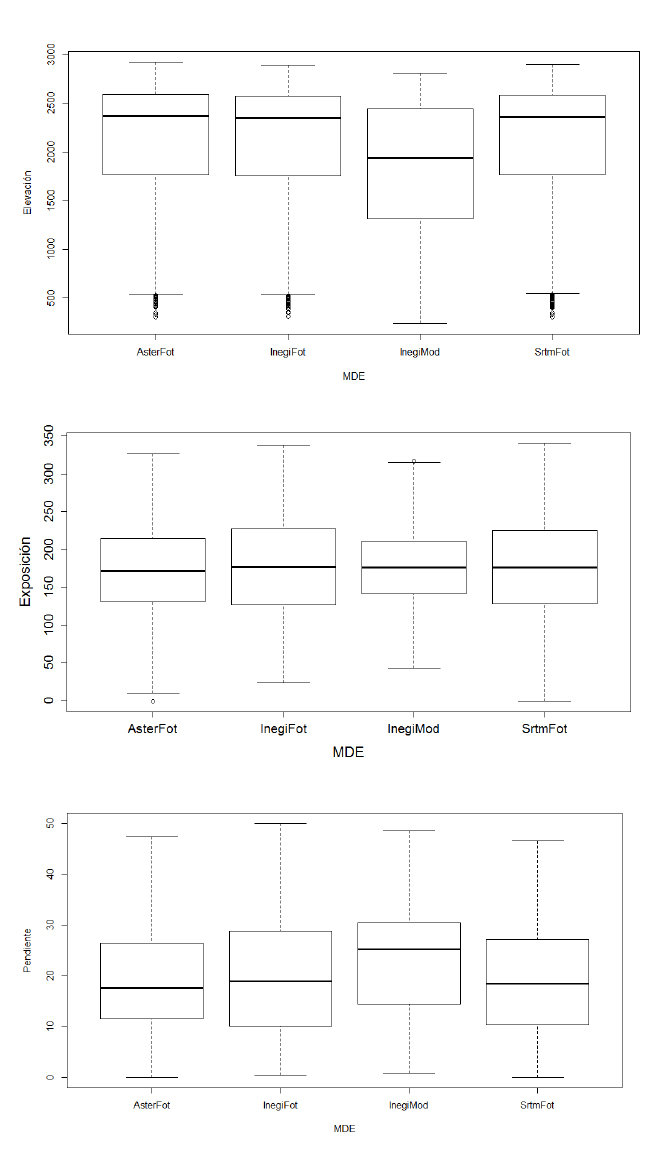
Figure 6 Kite and box plot chart for the variables estimated for the photogrammetric stands (InegiFot) and for the stands generated with the semi-automated method for the geomorphometric land surface analysis of the three DEMs.
Notably, there are no significant differences in the exposure variable between the stands generated using the photointerpretation technique and those obtained with the proposed semi-automated method, since in every case the hydrological network is considered as the main feature for stand delimitation. However, González et al. (2004) report a strong influence of exposure, which is relatively easy to photointerpret directly on the computer, and therefore becomes the main trait of the terrain for supporting the stand delimitation.
The semi-automated method yields a precise definition of the set of exposure values and a zone delimitation that are similar to those obtained using traditional methods. Figure 7 illustrates a visual comparison between the stand delimitations resulting from photointerpretation and from the semi-automated method for the geomorphometric land surface analysis based on INEGI’s DEM, considering exposure as the main input variable of the models. Figure 7 shows no significant differences in the exposure-based stand delimitation between the two assessed stand delimitation techniques.
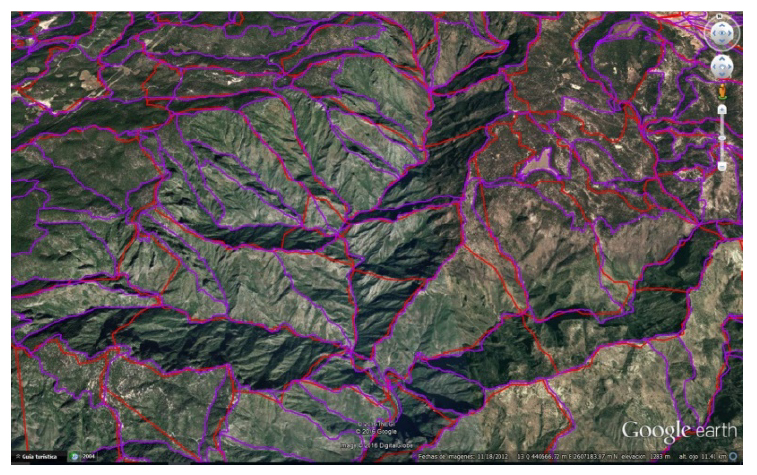
Figure 7 Superimposition of stand layers generated in relation to the exposure variable upon a Google Earth image using photogrammetric techniques (fuchsia) and the semi-automated method for the geomorphometric land surface analysis based on INEGI’s DEM (red).
The zonal statistics for the slope and altitude variables estimated using the semi-automated method differed significantly from the values calculated with the photointerpretation technique. Under the assumption that the layer of stands generated through the latter represents the desired situation, we might say that the proposed semi-automated method generates statistically different zonal statistics from those produced in stand delimitations using the traditional method.
These differences may be accounted for by the fact that the use of photointerpretation does not allow the forest technician to capture the whole range of slopes and altitudes in the study area (Ancira-Sánchez and Treviño, 2015). However, we must consider other important aspects that take place during the stand delimitation process and are the cause of differences --including the subjectivity of the photointerpreter, poor outlining or discrepancies in the borders of the stands with respect to the contour lines or to the field grade elevations, use of aerial photograps or orthophotographs with a low spatial resolution (Aguirre, 2013; Ancira-Sánchez and Treviño, 2015). A viable alternative to improve the technique for the photointerpretation of the stands would consist in the use of aerial or satellite images with a very high spatial resolution favoring the identification of objects located on the surface; however, this entails high investment costs (Ancira-Sánchez and Treviño, 2015; Valdez et al., 2006).
On the other hand, the semi-automated method has the advantage of producing zonal statistics for the slope and altitude variables based on the same criteria and in a significantly shorter time than the photogrammetric technique and is therefore regarded as a useful tool with potential to support and monitor the cartography for forest management programs. Its use also makes it possible to attain standardized polygon delimitation in order to ensure the continuity of the outer boundaries of the plots.
The differences in the outline and delimitation of the stands between the methods described above are shown in Figure 8, which was obtained by exporting the delimitation of both layers to the KML format of Google Earth and, subsequently adding an altitude factor in order to view it in 3D. The stands generated using the semi-automated method based on the DEMs show a better outlining of the higher parts of the plots, as well as of the streams, wherever the slope is pronounced, although they do not clearly outline the valleys or the relatively flat areas. On the other hand, the stand delimitation using photogrammetric techniques shows differences in the continuity of the boundaries of adjacent plots; this can be corrected by utilizing the proposed methodology.
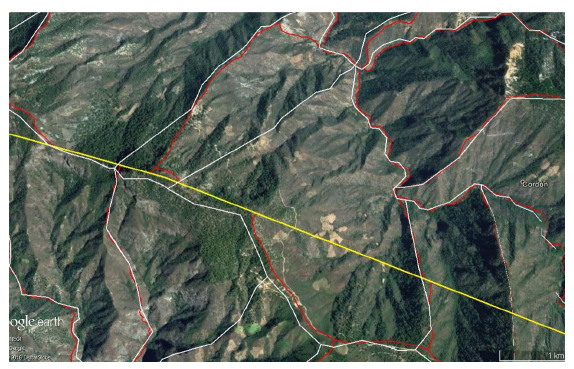
Figure 8 Comparative detail of the stand delimitation on a Google Earth image using photogrammetric techniques (red) and the semi-automated method for the geomorphometric land surface analysis based on Inegi’s DEM (white); the border of the plot is marked in yellow.
Based on the findings of this research, we recommend using the DEMs, regardless of their source (ASTER, STRM or Inegi), as basic input for the generation of micro watersheds, since they all showed similar results, are open-source and have a national or global coverage. Debugging with the method presented herein is relatively simple, in contrast with the generation of the model based on contour lines (González et al., 2004). There are various comparative studies (Szabó et al. 2015; Forkuor and Maathuis, 2012; Huggel et al. 2008) on the DEMs of ASTER and SRTM which conclude that both can be used in geomorphological applications.
Conclusions
The comparison carried out in the 51 polygons of plots, between the stand delimitation techniques using photointerpretation and the semi-automated method for the geomorphometric land surface analysis of the three DEMs discussed herein showed no significantly statistical differences in the exposure variable, while statistically different estimations were observed for altitude and slope.
We conclude that semi-automated methods make it possible to obtain homogenous stand delimitations in terms of altitude, slope and exposure based on the DEMs of INEGI, ASTER and SRTM.
The semi-automated methodology for geomorphometric land surface analysis is easy to apply, does not entail additional costs and can be implemented in open-source or commercial softwares. Its use does not exclude the user’s intervention to edit the polygons and carry out an extraction with a good level of reliability, particularly in flat areas.
It is advisable to use the methodology proposed here in order to ensure homogeneity and continuity of the boundaries between adjacent plots, as well as to have permanent polygon delimitations at stand level that will allow the temporary traceability monitoring that is required in order to attain sustainable forest management practices.
Acknowledgements
The authors wish to express their gratitude to Conacyt for the financial support granted to the first author for studying the program of the Institutional Doctorate in Agricultural, Livestock and Forestry Sciences (DICAF).
REFERENCES
Abrams, M. 2000. The Advanced Spaceborne Thermal Emission and Reflection Radiometer (ASTER): data products for the high spatial resolution imager on NASA's Terra platform. International Journal of Remote sensing 21(5):847-859. [ Links ]
Aguirre S., C. A. 2013. Modelación geoespacial de variables de densidad forestal. Doctoral dissertation. Universidad Autónoma de Nuevo León. San Nicolás de los Garza, N.L., México. 105 p. [ Links ]
Ancira-Sánchez, L. y E. J. Treviño G. 2015. Utilización de imágenes de satélite en el manejo forestal del noreste de México. Madera y Bosques 21 (1):77-91. [ Links ]
Ávalos N., D. 2004. Continúo de Elevaciones Mexicano. Revista Cartográfica (78/79):49-51. [ Links ]
Burrough, P. A. 1986. Principles of Geographic Information Systems for Land Resource Assessment. Monographs on Soil and Resources Survey. Oxford Science Publications. New York. NY USA. pp. 37-52. [ Links ]
Corral-Rivas, S., J. G. Álvarez-González, J. J. Corral-Rivas y C. A. López-Sánchez. 2015. Characterization of diameter structures of natural forests of northwest of Durango, Mexico. Revista Chapingo Serie Ciencias Forestales y del Ambiente 21(2):221-236. [ Links ]
Diario Oficial de la Federación (DOF). 2008. Norma Oficial Mexicana NOM-152-SEMARNAT-2006. Semarnat. 17 octubre 2008. México, D. F., México. 24 p. [ Links ]
Environmental Systems Research Institute (ESRI). 2011. ArcGIS Desktop: Release 10. Environmental Systems Research Institute. Redlands, CA USA. n/p. [ Links ]
Forkuor, G. and B. Maathuis. 2012. Comparison of SRTM and ASTER Derived Digital Elevation Models Over Two Regions in Ghana-Implications for Hydrological and Environmental Modeling. http://cdn.intechopen.com/pdfs/32991.pdf (4 de enero de 2016). [ Links ]
García, E. 1988. Modificaciones al sistema de clasificación climática de Köppen. Serie Libros. Núm. 6. Instituto de Geografía, UNAM. México, D.F., México. 90 p. [ Links ]
González M. et al.. 2004 Rodalización mediante sistemas de información geográfica y sensores remotos. Investigaciones Geográficas 53: 39-57. [ Links ]
Geographic Resources Analysis Support System (GRASS) 2012. Geographic Resources Analysis Support System Development Team. Software Version 6.4.1. Open Source Geospatial Foundation. http://grass.osgeo.org (29 de agosto de 2012). [ Links ]
Hernández-Díaz, J. C. et al. 2008. Evaluación del manejo forestal regular e irregular en bosques de la Sierra Madre Occidental. Madera y Bosques 14(3):25-41. [ Links ]
Huggel, C., D. Schneider, P. J. Miranda, H. Delgado G. and A. Kääb. 2008. Evaluation of ASTER and SRTM DEM data for lahar modeling: a case study on lahars from Popocatépetl Volcano, Mexico. Journal of Volcanology and Geothermal Research 170 (1-2):99-110. [ Links ]
Instituto Nacional de Estadística y Geografía (Inegi). 2013. Ortofoto digital Aspectos teóricos/metodológicos. http://www.inegi.org.mx/est/contenidos/proyectos/Preview.aspx (20 de febrero de 2015). [ Links ]
Instituto Nacional de Estadística y Geografía (Inegi). 2015. “Continuo de Elevaciones Mexicano 3.0”. http://www.inegi.org.mx/geo/contenidos/datosrelieve/continental/descarga.aspx (9 de marzo de 2015). [ Links ]
Jasiewicz, J. and M. Metz. 2011. A new GRASS GIS toolkit for Hortonian analysis of drainage networks. Computers & Geosciences 37 (8):1162-1173. [ Links ]
Kruskal, W. H. and A.W. Wallis.1952. Use of ranks in one-criterion variance analysis. Journal of the American Statistical Association 47(260):583-621. [ Links ]
Luján Á., C. et al. 2016. Desarrollo forestal comunitario sustentable en la región norte de México y su desafío en el contexto de la globalización. Madera y Bosques 22(1):37-51. [ Links ]
Nájera-Frías, J., A. Pinedo-Álvarez, F. Cruz-Cobos, S. Corral-Rivas, y R. Meraz-Alemán. 2013. Modelación geoespacial del potencial natural de bosques templados en Pueblo Nuevo, Durango. Tecnociencia Chihuahua 7(1):39-48. [ Links ]
National Aeronautics and Spatial Administration (NASA). 2015. Advanced Spaceborne Thermal Emission and Reflection Radiometer. http://reverb.echo.nasa.gov/reverb/#utf8=%E2%9C%93&spatial_map=satellite&spatial_type=rectangle (22 de mayo de 2014). [ Links ]
Neteler, M. 2005. GRASS 6: una guia de inicio. Geospatial Open Source. University of Minnesota, Minneapolis. https://www.grassbook.org/wp-content/uploads/neteler/osg05/g63_nutshell_v1_1_es.pdf (21 de abril de 2015). [ Links ]
Pérez V., A. y J. F. Mas. 2009. Evaluación de los errores de modelos digitales de elevación obtenidos por cuatro métodos de interpolación. Investigaciones Geográficas. 69: 39-57. [ Links ]
Pike, R. J. 2000. Geomorphometry - diversity in quantitative surface analysis. Progress in Physical Geography 24(1):1-20. [ Links ]
QGIS. 2014. Quantum Gis. Documentación. http://docs.qgis.org/2.2/es/docs/user_manual/plugins/plugins_zonal_statistics.html (4 de noviembre de 2014). [ Links ]
Rabus, B., M. Eineder, A. Roth and R. Bamler. 2003. The shuttle radar topography mission a new class of digital elevation models acquired by spaceborne radar. ISPRS Journal of Photogrammetry and Remote Sensing 57(4):241-262. [ Links ]
Rasemann S., J. Schmidt, L. Schrott and R. Dikau. 2004. Geomorphometry in mountain terrain. In: Bishop, M. P. and J. F. Shroder (ed.). GIS & Mountain Geomorphology, Springer. Berlin, Germany. pp. 101-145. [ Links ]
Statistical Analysis System (SAS). 2008. User’s Guide. SAS/ETS® Version 9.2. SAS Institute Inc. Cary, NC USA. 2861 p. [ Links ]
Simulador de Flujos de Agua de Cuencas Hidrográficas (SIATL). 2015. Red hidrográfica. http://antares.inegi.org.mx/analisis/red_hidro/SIATL/# (5 de mayo de 2015). [ Links ]
Szabó, G., S. K. Singh, and S. Szabó. 2015. Slope angle and aspect as influencing factors on the accuracy of the SRTM and the ASTER GDEM databases. Physics and Chemistry of the Earth. Parts A/B/C 83-84: 137-145. [ Links ]
United States Geological Survey (USGS). 2015. https://lta.cr.usgs.gov/SRTM1Arc . (20 de abril de 2015). [ Links ]
Valdez L., J. R., M. D. J. Gonzalez G. y H. M. de los Santos-Posadas. 2006. Estimación de cobertura arbórea mediante imágenes satelitales multiespectrales de alta resolución. Agrociencia 40(3):383-394. [ Links ]
van Rossum, G., and F. L. Drake. 2011. The python language reference manual. Ed. Network. Lewiston, NY USA. 150 p. [ Links ]
Velasco H., J. A., J. G. Flores-Garnica, B. Márquez A y S. López. 2013. Áreas de respuesta homogénea para el muestreo de combustibles forestales. Revista Mexicana de Ciencias Forestales 4(15):41-52. [ Links ]
Zambrano R., A., J. Torres C. y J. Ibarra G. 2011. Delimitación, codificación de las cuencas hidrográficas según los métodos de Pfasftetter y Strahler utilizando Modelos de Elevación Digital y técnicas de Teledetección. In: XV Simpósio Brasileiro de Sensoriamento Remoto-SBSR-INPE. 30 de abril a 5 de maio de 2011. Curitiba, Parana, Brasil. pp. 1105-1112. [ Links ]
Received: March 21, 2017; Accepted: April 22, 2017
 Este es un artículo publicado en acceso abierto bajo una licencia Creative Commons
