Introduction
Geomagnetic activity in general and geomagnetic storms (GS) in particular, are manifested through a series of processes involving current systems that induce magnetic fields, measured by several geomagnetic ground observatories.
The intensity of the GS is given by the geomagnetic Dst (Disturbance storm time) (Sugiura, 1964) index. During the GS, there are several current systems at play. The storm starts with the momentum and plasma transfer from the solar wind to the magnetosphere (Dessler and Parker, 1959), which produces an intensification of the magnetopause currents, the field aligned currents and the ring currents; the latter produce the characteristic decrease in the Dst index. There is also the partial ring current that is one of the current systems located in the Northern and Southern Hemispheres at the geomagnetic equatorial plane, and closed through the ionospheric field aligned currents (Kalegaev, et al., 2008; Li, et al., 2011; Lockwood, 2013) and the magnetotail current system (Alexeev, et al., 1996). The intensity of each current system is a consequence of the energy injected to the magnetosphere by the solar wind (Clúa et al., 2013; Patra et al., 2011).
The Dst index was created 50 years ago (Hamilton et al., 1988), in order to have a quantitative measurement of the ring current. Four observatories monitor the Dst: Honolulu (Longitude (E) 201.98°, Latitude 21.32°), San Juan (Longitude (E) 293.88°, Latitude 18.11°), Hermanus (Longitude (E) 19.22°, Latitude -34.40°) and Kakioka (Longitude (E) 140.18°, Latitude 36.23°) located at mid and low latitudes (see Figure 1) where the influence of the equatorial electrojet is minimum. Each observatory reports the horizontal magnetic field intensity (H), and the Dst is constructed from these four reports. The Dst minimum indicates the moment of occurrence of the GS in universal time (UT) (Mandea and Korte, 2011; Campbell 2004; Mayaud 1980; Sugiura, 1964).
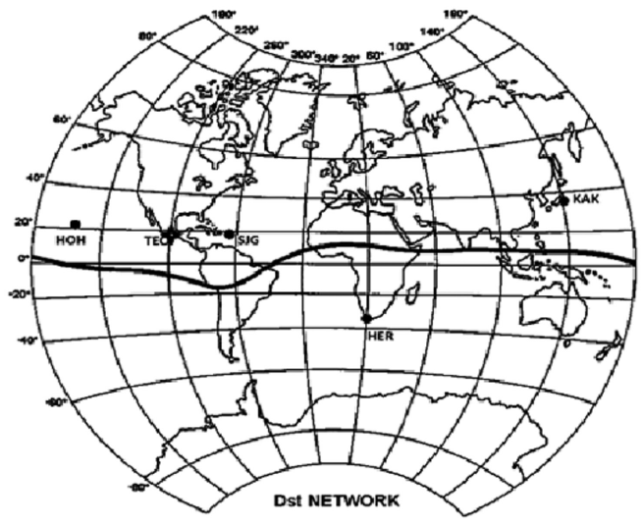
Figure 1 Map showing the location with circle of the four stations that are used to construct the Dst index: Honolulu (Longitude (E) 201.98°, Latitude 21.32°), San Juan (Longitude (E) 293.88°, Latitude 18.11°), Hermanus (Longitude (E) 19.22°, Latitude -34.40°) and Kakioka (Longitude (E) 140.18°, Latitude 36.23°). The star indicates the location of the Teoloyucan Magnetic Observatory (Longitude (E) 260.81°, Latitude 19.74°) (http://wdc.kugi.kyoto-u.ac.jp/dstdir/dst2/onDstindex.html).
The SYM-H index describes the geomagnetic disturbance field at mid-latitudes with a 1 min resolution. Dst and SYM-H are argued to be essentially the same (e.g., Sugiura and Poros, 1971) as their numerical differences are small. However, a recent work (Katus and Liemhon, 2013) shows that, although their correlation is 0.9, they are inherently different, because each index applies different methods to remove irrelevant fluctuations.
The derivation procedure for both the Dst and the SYM-H essentially consists for the following four steps: (1) Subtraction of the geomagnetic main field and the Sq (solar quiet daily variation) field to calculate the disturbance field component. (2) Coordinate transformation to a dipole coordinate system. (3) Calculation of the longitudinally symmetric component (i.e. six-station average for SYM-H and four stations average for Dst) and the asymmetric component (i.e. disturbance field minus the symmetric component). (4) Derivation of the asymmetric indices (i.e. the range between the maximum and the minimum asymmetric fields), http://wdc.kugi.kyoto-u.ac.jp/aeasy/asy.pdf)
As a first approximation, the ring current is a toroidal westward current system centered at the equatorial plane, at a geocentric distance between 2 and 9 terrestrial radii (Bogdanova et al., 2014). It is formed mainly by positive ions and ~25% electrons (Liu et al., 2005), with energies between tens and hundreds keV and subjected to an azimuthal drift. The ring current increases its density during the GS main phase, decreasing during the recovery phase. The loss mechanisms are more efficient near dawn and dusk (Le, 2013), which explains why the ring current and the ionosphere control the electric fields in the interior of the magnetosphere at dawn and dusk (Bogdanova et. al., 2014). These effects are due to the electric fields that appear during the dusk near the equatorial ionosphere (Tsurutani et al., 2012). The magnetotail currents are also systems that strongly contribute to the Dst decrease during a GS. The ring current is very important for the ionosphere/magnetosphere dynamics (Hamilton et al., 1988). It has been shown that the O+ ions, of ionospheric origin, contribute significantly to the plasma pressure of the inner magnetosphere during a GS (Keika et al., 2013; Daglis et al., 1999; Welling et al., 2011). Also, strong ionospheric effects associated with a GS have been reported. The ionospheric local currents affect the H, thus the measurements of the geomagnetic observatories depend on the latitude, and the Magnetic Local Time (MLT) (Shinbori et al., 2012; Ahn et al., 2002).
There is a strong dependence of the ionospheric conductivity and the decrease of H. Also, there is a seasonal dependence of the sudden storm commencement amplitude and the MLT, according to the current systems involved (Shinbori et al., 2012).
The purpose of the present work was to determine, and evaluate the difference in time during a GS between the occurrence of the minima in Dst, SYM-H and H measured in the Teoloyucan Magnetic Observatory (TEO) of Mexico. Knowing these differences is important for research concerning local geomagnetic phenomena.
Methods
TEO is located in Mexico at Longitude (E) 260.81°, Latitude 19.74°(see Figure 1). The vector of the magnetic field has been continuously monitoring 1914, being one in a worldwide network of magnetic observatories and belonging to the international INTERMAGNET project. Besides, TEO is the backbone of the Magnetic Service of the Geophysics Institute of the National Autonomous University of Mexico (Instituto de Geofísica of the Universidad Nacional Autónoma de México) and the hub of a broad ranges of geophysical and magnetic field research in Mexico.
The data base we use corresponds to the TEO H component (TEO-H) from January 2003 to December 2006 corresponding to the descending phase of solar cycle 23 (http://www.intermagnet.org/data-donnee/downloadeng.php and http://www.geomaglinux.geofisica.unam.mx/). We also used the Dst data for GS with Dst ≤ 100nT (There are reports of effects on biological systems) from the World Data Center for Geomagnetism Kyoto, (http://wdc.kugi.kyoto-z.ac.jp/index.html) for the same time period. We processed 113 976 Kyoto hourly data, and 1,721,820 TEO-H and SYM-H data reported each minute. For SYM-H the data were taken from (http://omniweb.gsfc.nasa.gov/form/omni_min.html).
To calculate the time differences (Δ) between the GS minima reported by the Dst and the TEO-H, we proceeded as follows.
We located the TEO-H data within a window of two days, before and three days after the day of the Dst minimum. We identified 15 GS within this window with Dst≤-100nT.
They were organized according to the time of occurrence in UT; then TEO-H local time was calculated for each GS (Table 1).
Besides, as the other hand, as the geomagnetic index Dst is hourly, it was necessary to carry out an interpolation with resolution of one minute. In order to do this, Hermite interpolating polynomials were used the interpolation was performed based on a group of data pairs {(t1,f(t1)), (t2,f(t2)),... , (tk,f(tk)),...}. Two successive values of time tk differ in one hour, that is tk+1 tk=1h, where f(tk) is the data that corresponds to the time tk. The interpolating polynomial Pk(t) was obtained starting from the points {(tk,f(tk)), (tk+1, f(tk+1))}. These polynomials are built in such a way that the derivative is continuous in the node points (tk,f(tk)), that is to say, two adjacent interpolating polynomials Pk(t) and Pk+1(t) are smoothly united. This limits the function formed by the union of the polinomials Pk(t) in such a way that it does not become too disperse, and allows it to present less variations if the data are not smooth.
Once we located the minimum for each of the obtained functions, related to each GS (using either the Dstmin or SYM-H), we calculated ∆ and ∆ SYM-H according to the following expressions (1a) and (1b):
∆ = Dstmin -TEO-H (1a)
or
∆ SYM-H = SYM-H-TEO-H (1b)
Δ differences are given in minutes.
Results and discussion
In order to distinguish relevant magnetospheric current systems, we have sketched several figures. They represent the Earth from the North Pole; the inner circle represents the universal time (UT) and the outer circle represents the MLT.
Thick lines are at the night side and thin lines at the day side. Regions of currents are: the magnetotail electrojet in the night side, the dawn, the dusk and the day side.
To obtain Δ and ∆ SYM-H we compare directly the plots of Dst or SYM-H and TEO-H. According to expressions 1a or 1b, a negative (positive) Δ or ∆ SYM-H means that the minimum appears first (afterwards) in the Dst or SYM-H indices (Dstmin or SYM-H min ) and afterwards (first) in the TEO-H. Figure 2 shows GS 1, GS 2 and 4 to 11, and Table 1 indicates that, for these storms, Δ or ∆ SYM-H is negative. Figure 3 shows GS 12 to 15, and Table 1 shows that for these storms Δ is positive. Figure 4 presents GS 3, as Table 1 indicates that it has a positive Δ or ∆ SYM-H . In the next section, we will discuss in the next section this storm in particular.
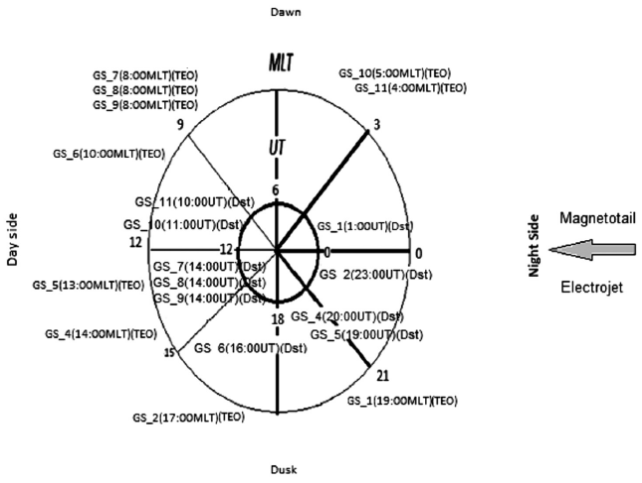
Figure 2. The Earth as seen from the North Pole. The inner circle corresponds to Universal Time (UT) and the outer circle to Magnetic Local Time (MLT). Also are shown the locations of geomagnetic storms (GS) at the moment of occurrence of the storms. The figure shows those GS with negative ∆ (GS 1, GS 2 and 4 to 11 according to Table 1).
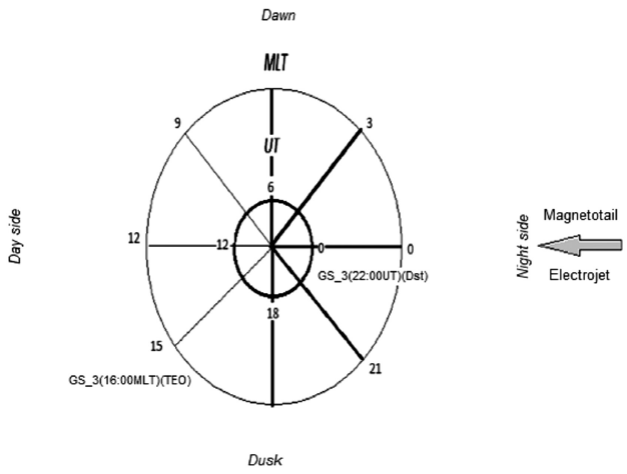
Figure 4 As Figure 2 but showing the location of the GS 3 (according to Table 1) at the moment of occurrence of the storm.
Figures 5, 6 and 7 show the plots of GS 6, 12 and 3 respectively. The GS_6 (Figure 5) is an example of a GS, with negative Δ, and occurred on the 18th of August 2003 with Dst =-148nT. The GS_12 in Figure 6 is an example of a storm with positive Δ, occurred on the 18th of January 2005 with Dst=-103nT. Finally, GS_3 Figure 4 occurred on the 20th of November , 2003 with Dst= -422 nT, being the most intense of the whole sample.
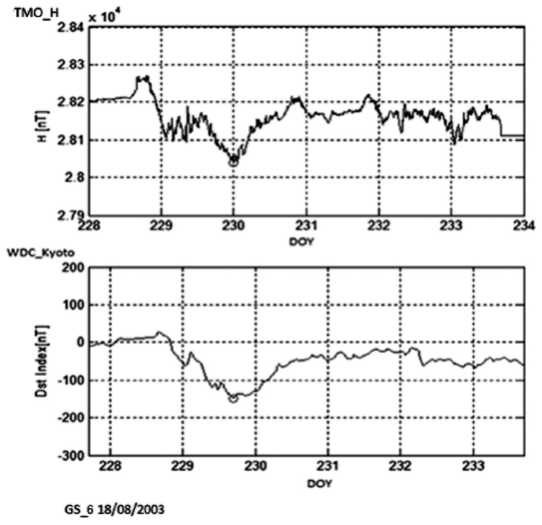
Figure 5 Example of a storm with a negative ∆. GS 6 (see Table 1) shows at the top the TEO-H and at the bottom the Dst. The small empty circle marks the minimum. The minimum presents first in Dst and afterwards in TEO-H.
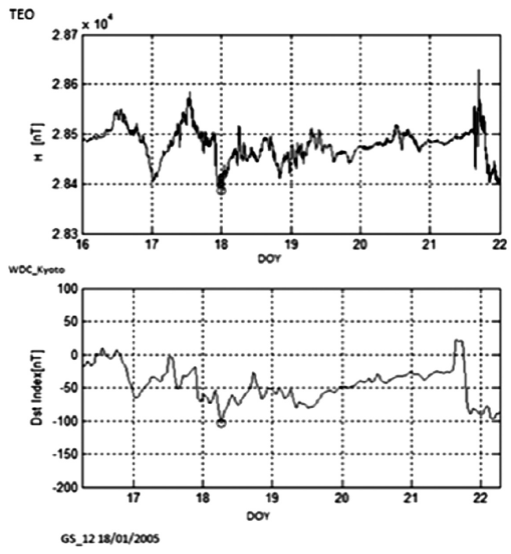
Figure 6 Example of a storm with a positive ∆. GS 12 (see Table 1) shows at the top the TEO-H and at the bottom the Dst. The small empty circle marks the minimum. The minimum presents first in TEO-H and afterwards in Dst.
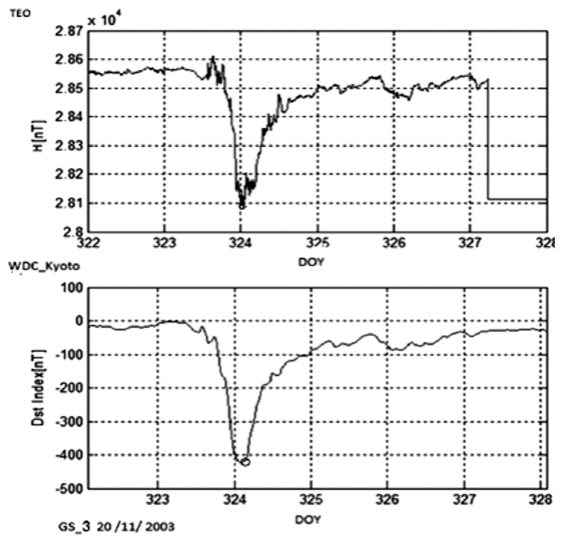
Figure 7 GS 3 (see Table 1) presents a positive ∆. At the top is the TEO-H and at the bottom the Dst. The small empty circle marks the minimum. The minimum presents first in TEO-H and afterwards in Dst. This storm has the largest intensity of the sample (Dst=-422nT).
Figure 2 and Table 1 show that all TEO-H minima that occur in the day side, dawn and dusk have a negative Δ (GS 1,GS 2 and 4 to 11), except GS 3, which has positive Δ. Figure 3 shows that all TEO-H minima that occur in the night side have a positive Δ (GS 12 to 15).
From Figure 2, and Δ, we see that when the TEO is under the influence of the ionospheric currents associated to the day side, down and dusk, the minimum occurs first in the Dst minimum and afterwards in TEO, so ∆ is negative.Furthermore, we notice that GS 2, 4, 5 and 6 are influenced by the equatorial electrojet, which is very strong during the daytime [Kalegaev et al., 2008]. Also, in the day side dawn and/or dusk, the GS 7, 8 and 9, occurred at the same time in different dates, that is 14:00UT and in local time at 8:00hrs in the morning. The values of the deltas do not seem to depend on the intensity of the GS expressed in the value of Dst, hence we assume that they are caused by ionospheric currents.
The GS 10 presents a minimum in TEO at 5:00 MLT, then it is under the influence of the dawn current systems. For GS 11 (Figure 2) and 12 (Figure 3), according to Table 1, we notice a change of sign in Δ; we propose that this happens because they occur in the border of influence of the dawn currents.
These results agree with Li et al. (2011), who found that during the ring current injection of a magnetic storm, ions are mostly present in the dusk and pre-midnight sectors of the Earth, because of duskward drifting, producing a highly asymmetric geomagnetic disturbance with MLT.
The GS 12 and 13 have positive Δ and ∆SYM-H (Figure 3 and Table 1), and are located in the zones of the night side current systems. The GS 14 and 15 are located near the magnetotail electrojet zone. In these cases, the electrojet injects directly the ring current when TEO is nearby it, recording first the minimum in TEO-H.
Finally, we noticed that the magnitude of Δ and ∆SYM-H is not related to the GS intensity for all the GS studied except GS 3 (Table 1). Concerning GS 3, we propose that somehow its great intensity (Dst =-422nT) would increase the complexity of all the involved phenomena. Also, the difference in Δ would depend on the intensity of the ionospheric currents that are present at the moment of the GS. Then, it seems that these currents would be capable of locally delay or forward the appearance of the minimum in TEO.
According to Cid et al., (2014) GS have a significant local variation, which agrees with GS 14 and 15, that present large Dst minima. However GS_3, having a Dst= -422nT, has a very small local variation.
It has been argued that the presences of currents affect the local measurements of the geomagnetic observatories [Shinbori et al., 2012]. Knowing the difference in time for the occurrence of the minima in Dst and local is important to better quantify the local impacts of GS, that is why a direct correlation between local measurements and Dst should be analyzed.
Conclusions
We analyzed the differences in time (Δ and ∆ SYM-H ) between the occurrence of the minima in Dst, ∆ SYM-H and TEO-H, calculated in UT for 15 GS, Dst ≤-100nT, during the descending phase of the solar cycle 23 (January 2003 to December 2006).
We found that when TEO is in the day side, dawn or dusk, the minimum appears first in Dst and afterwards in TEO (negative Δ, ∆ SYM-H). However, GS 3 did not follow this behavior, perhaps due to its great intensity; however we cannot explain yet why. We suppose that the day side, dawn and dusk ionospheric currents are the reason of the delay. When TEO is near midnight the minimum is found first in TEO and afterwards in Dst (positive Δ, ∆ SYM-H); again we suppose that the magnetotail currents are the cause of this delay.
The differences between Sym-H and Dst, may be because one is an average time and Sym-H is per minute, and that data can come from different observatories.


 nueva página del texto (beta)


