Introduction
Without doubt the great 1985 Michoacán earthquake (Mw 8.1) was the most damaging in Mexico City history. This earthquake and its disastrous effects have been thoroughly and controversially analyzed and discussed during the last three decades after the tragedy. We refer to the review paper by Flores-Estrella et al. (2007) with an exhaustive list of references. Surface waves always play an important role in the earthquake effects for well-known physical reasons. These waves carry most of the energy from the source because the crust layers constitute an efficient waveguide. The Malischewsky’s (2004) report examined the principle “As simple as possible, as complicated as necessary”.
Equivocalness of dispersion curves
Usually it is silently (to avoid saying shamefully) assumed in seismological literature that dispersion curves of Rayleigh waves are unique in the sense that one phase-velocity value belongs to a given frequency. However, we have observed that this is not always true. To illustrate this, let us consider the elastic model of a “Layer with Fixed Bottom” (LFB), i.e. a layer with a stress-free surface and a bottom with vanishing displacements. The secular equation for LFB is propagation conditions for surface waves in the valley of Mexico City (CDMX). One notorious characteristic is an extremely high Poisson ratio in the uppermost layers together with a very high impedance contrast between the layers and the subsoil. Investigating the socalled osculations of dispersion curves (Kausel et al., 2015) we have casually discovered unusual higher-mode Rayleigh waves because of the equivocal behaviour of their dispersion curves in a certain frequency range. Following Furumura and Kennett (1998) the dominant seismic phases at regional distances are usually the crustal P8 and L8 phases and the recorded L8 phase can be regarded either as a superposition of multiply reflected S waves in the crust or as a sum of a number of higher surface wave modes sampled at the free surface of the crust. So it is appropriate to have a closer look on the higher modes as well. It turns out that the conditions for the occurrence of this special behaviour, to be presented here, coincide with the natural conditions in Mexico City. This behaviour is reproduced by using very simple models. This observation agrees also with the Paul Dirac’s statement that natural laws seem to be constructed following the
where F and C are the dimensionless frequency and phase velocity, respectively, defined by
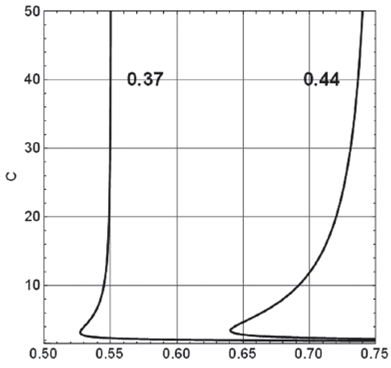
with ƒ = frequency, c = phase velocity, β = shear velocity, h = layer thickness, and v =Poisson ratio. Formula (1) implies the dispersion equation C = C(F) and was rewritten from the one found by Tran (2009). The phenomenon to be described here occurs for higher modes only. We have analysed Eq. (1) with the software Mathematica and have obtained dispersion curves of the first higher mode of Rayleigh waves for different values of v, the Poisson ratio. Figure 1 presents results for two of them.
Obviously, there is a frequency range for each v - value, in which each frequency has two different phase velocities. By defining the distance d,

Figure 1 Rayleigh-wave dispersion curves of the first higher mode for the LFB model with v = 0.37 and v = 0.44, respectively
with F ∞ = frequency value for C = ∞, and F min = minimal frequency value of the curve, we have found a measure for the strength of the effect under consideration. By using the ordinary formula for the group velocity it would become zero for F = Fmin. This point is known in ultrasonic literature as Zero-Group Velocity (ZGV) point and is subject of voluminous considerations and discussions, which are far beyond the scope of this article. The interested reader may find a good entry into this field e. g. by Negishi (1987) or Prada et al. (2009), where dispersion curves of Lamb waves with a very similar shape like our curves in Figure 1 are presented. While plate-structures are known to bear rich features of dispersion, layered structures with seismic velocity monotonously increasing with depth are silently expected to show normal dispersion for all modes, commonly. Kausel (2012) provides a thorough analysis of these phenomena together with an interesting discussion of the occurrence of ZGV-points of higher modes depending on Poisson’s ratio. It should be also noted that Lysmer (1970) presented a group velocity curve for a layered model with positive and negative parts in a seismological context, which anyhow gives tentatively evidence in the same direction.
Because d is not accessible analytically it was numerically calculated and depicted in Figure 2.
Apparently, the phenomenon is present in a range approximately 0.19 < v < 0.5 and has its maximum at about v ≈ 0.4375 = 7/16, where the P-wave velocity is the threefold of the S-wave velocity. Therefore, this special behaviour occurs in the whole range of practically important n - values with preference of higher values.
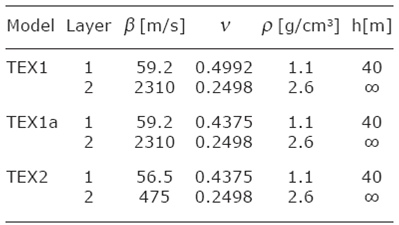
The special feature continues to appear for the “Layer Over Halfspace” (LOH) model as well, when the impedance contrast between layer and half-space is big enough. For lower impedance contrasts the picture is more complicated and some new effects occur, which are beyond this communication. Let us demonstrate the behaviour of the first higher mode for 2 simplified models TEX1 and TEX2 of the Texcoco region from Malischewsky Auning et al. (2006) and Malischewsky et al. (2010) with slightly modified parameters. Both models differ in their shear-wave ratios between layer and half-space, which is about 0.0256 for TEX1 and 0.12 for TEX2. The parameters are given in Table 1.
Table 1 Parameters for the models under consideration: β =shear-wave velocity, v = Poisson ratio, p = density, and h = thickness of the layer.

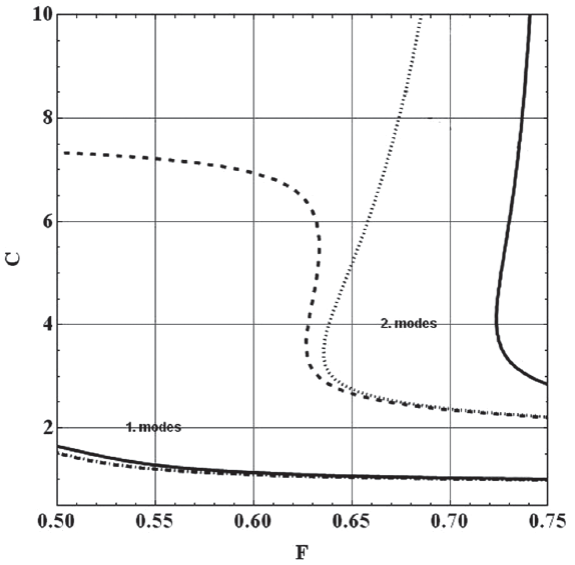
Table 1 contains also the model TEX1a, which differs from TEX1 only by a somewhat diminished v for the layer in order to demonstrate the greater effect in this case, in agreement with Figure 2. It is very likely that some regions, even within Texcoco, have not such an extremely high Poisson ratio as the one in TEX1. The dispersion curves for the models were calculated again with Mathematica, but the secular equation for LOH is by far too voluminous to be given here. The results for all 3 models are included in Figure 3.

Figure 3 Dispersion curves of the 1. Fundamental, and 2. First higher modes for the models TEX1, TEX1a and TEX2 depicted with solid, dotted, and dashed lines, respectively.
The described effect can be seen in a pronounced manner around F = 0.65 for TEX1a, but it also occurs in a not so pronounced manner around F = 0.725 for TEX1 and a bit weaker for TEX2 with a lower impedance contrast. Such effects appear for multilayered media too, when the impedance contrast at the bottom is high enough. The analytical results of Figure 3 were checked by using two numerical approaches. Namely, the one by Fuchs and Müller (1971), and also, by Schwab and Knopoff (1972) and a perfect coincidence was found. On the other hand, there are computer programs widely used for the calculation of dispersion curves which are simply not fit to handle the special cases described above. Thus, it is advisable in applying numerical schemes to be aware of the occuring peculiarities of dispersion curves under analysis.
Discussion
It is noticed that instead of C = C(F) the inverse function F = F(C) can be considered as a dispersion curve. In this case, an ambiguity will occur for fixed phase velocity with 2 different frequencies when the curve C = C(F) has a local extremum, but this does not happen for the LFB and LOH models. Further, it should be noted that the occurrence of 2 different phase velocities for a fixed frequency generates beats in the wave field. A standard dispersion analysis based on phase differences will inevitably fail in such cases. This analysis approach calculates the phase difference of the seismograms Fourier coefficients at two observation locations divided by the distance between these locations. The reciprocal of this value times the angular frequency is taken as the phase velocity. In the case, an ambiguity would occur the Fourier phase becomes meaningless with respect to phase velocity in the frequency band where three roots of the secular equation exist at each frequency. For the very same reason all methods must fail with the dispersion discussed here which rely on a unique dispersion relation kl ( ω ) for the wavenumber kl of the l-th surface wave mode. This applies to the deconvolution method used by Sèbe et al. (2009) for the extraction of fundamental mode data as well as to phasematched filter techniques like those presented by Herrin and Goforth (1977) or by Russel et al. (1988) for example. Methods of wave field transformation (Forbriger, 2003; McMechan and Yedlin, 1981) however remain applicable for the purpose of dispersion analysis.
Likewise, methods of calculating synthetic dispersion curves might get into trouble. Commonly dispersion curves are constructed by finding the roots of the secular equation starting at the cut-off frequency. Roots for the same overtone are then searched with increasing frequency near the phase velocity value for the previous (smaller) frequency. In the current case the extremum of F(C) causes such algorithms to loose the dispersion curve, which first becomes stationary with frequency and then continue to decreasing frequency values.
So the influence of this special dispersion is two-fold: it produces a special wavefield, whose manifestation and influence for Mexico City has yet to be investigated in the future. On the other hand it requires care in inverting surface wave data for a correct underground model, which for its part is essential for the estimation of the seismic hazard.
The unusual cases described herein suggest care in the analysis of surface waves and may be a warning for the research community to explore these anomalous problems. In other context, the dispersion curves may seem usual but produce slowly attenuating leaky modes for a restricted set of mechanical parameters (García-Jerez and Sánchez-Sesma, 2015).
Conclusions
The special feature “unusual or equivocal dispersion curves”, although hardly known in seismology, seems to be rather common for higher mode Rayleigh waves in layered models with sharp impedance contrasts between layers and half-space and sufficiently high Poisson ratios in the layers. Just these conditions are fulfilled in the valley of Mexico City and these dispersion curves influence the surface-wave field and have to be kept in mind in processing the dispersion curves for model-parameter inversion. Although this research was focused on the characteristics of Mexico City soft layers like those found in the ancient Texcoco lake zone, the results are so general and should not be disregarded as exotic, strange phenomena. Certainly, the problem requires further scrutiny.


 nueva página del texto (beta)


