Introduction
Paleoseismological studies in Mexico are a recent development (e.g. Langridge et al., 2000; Norini et al., 2010; Garduño-Monroy et al., 2009; Langridge et al., 2013; Ortuño et al., 2015; Sunye-Puchol et al., 2015). They were mainly developed due to lack of instrumental data in regions of low strain rate, such as the Trans-Mexican Volcanic Belt (TMVB), notwithstanding the historical occurrence of large events such as the November 19 1912, Acambay earthquake (Ms 6.7/mb 6.9; Urbina and Camacho, 1913; Abe, 1981), a moderate crustal normal-faulting event that caused widespread destruction and loss of lifes at several towns near its epicenter (Urbina and Camacho, 1913; Singh et al., 1984, 2011; Singh and Suárez, 1987). Other relevant shallow crustal events (M > 5) at the TMVB are: the 1567/68 Ameca earthquake (Mw ~ 7.2; Suter, 2015); the 1887 Pinal (mb 5.3; Suter, 1996); the 1920 Jalapa (Ms 6.2/mb 6.5; Abe, 1981); the 1950 Ixmiquilpan (mb 5.0; Singh et al., 1984); the 1976 Cardonal (mb 5.3; Mexican Seismological Service); and the 1979 Maravatío (mb 5.5; Astiz, 1980) earthquakes (Figure 1). These intraplate events pose a significant seismic hazard to people and infrastructure in Central Mexico, the most populated region in the country. The importance of the information extracted from paleoseismological studies in seismic hazard analysis highlights the need for systematic treatment of uncertainties. Interpretation of geological observations has a source of uncertainties inherent to large number of hypothesis that may explain the observed geological features. For example, the uncertainties which are related to the spatial observation window (at the scale of the trench) and the preservation of the geological record. In particular, breaking evolved along the fault and, in the paleoseismological studies, it can only be observe deformations preserved in the sedimentary record. Moreover, in Central Mexico, the differential compaction of surface sediments can produce structures that can be interpreted, wrongly, as tectonic movements if the study areas are wrongly chosen. Finally, fractures without associated displacement can be wrongly interpreted as being associated with a seismic event on paleoseismological studies. However, without any other structural features described in the trench it can not be discarded that fractures could also be associated to other factors such as a distant earthquake, a period of drought, etc. This makes estimating the uncertainties related to paleoseismological data for their use in seismic hazard analysis a difficult task (Atakan et al., 2000). To overcome these pitfalls, a detailed description of the source of paleoseismological data is needed (Atakan et al., 2000). None of the paleoseismic studies in Mexico had tried to quantify a total uncertainty in their results. Using paleoseismic data in seismic hazard analysis without any uncertainty quantification may lead to a misinterpretation of the true seismic hazard. In this study, we applied the method proposed by Atakan et al. (2000) to estimate uncertainties in paleoseismic studies carried out in the Acambay graben region in Central Mexico. The method is based on logic-tree formalism and it has been applied in paleoseismological and archaeoseismological studies with success (Atakan et al., 2000; Grützner et al., 2010, respectively). Furthermore, we employ a measure of the information entropy (Shannon, 1948) at each step in the estimation to provide an additional source of validation of the results.
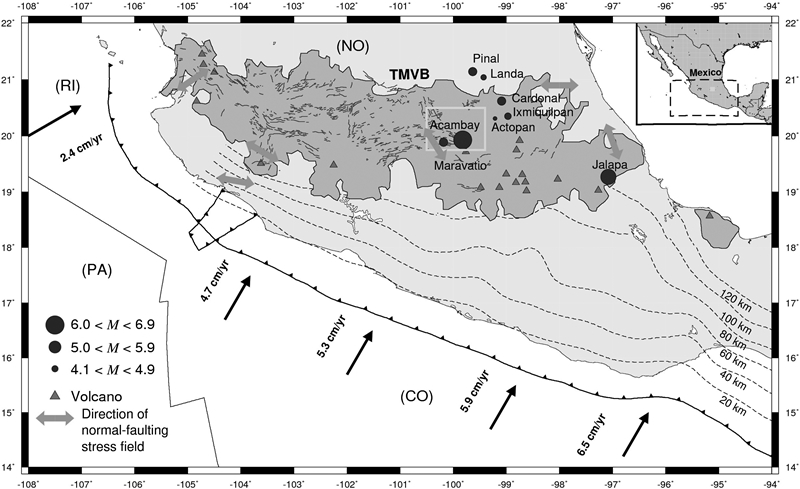
Figure 1 Main tectonic features in Central Mexico. NA is the North American plate, CO is the Cocos plate, PA is the Pacific plate, RI is the Rivera micro plate, and TMVB is the Trans-Mexican Volcanic Belt. Red triangles are volcanoes and the black-bold line delimits the boundary of the TMVB. Dashed lines show contour lines of the subducted slab at 20, 40, 60, 80 and 120 km depth (Hayes et al., 2012). Gray circles are shallow crustal earthquakes in the TMVB with M > 4.1 (Orozco and Berra, 1887; Urbina and Camacho, 1913; Astiz, 1980; Suter, 2015; and the Mexican Seismological Service). The size of the circle is proportional to the magnitude. The green rectangle shows the Acambay region. The arrows show the convergence rate relative to North America (DeMets et al., 1994). Blue lines are geological faults in the TMVB reported in Ferrari et al. (2012). Orange arrows indicate direction of horizontal stress in provinces with a normal fault-type stress field based on Suter (1991).
Tectonic setting
The TMVB is an active calc-alkaline volcanic arc that traverses Mexico from the Pacific Ocean to the Gulf of Mexico (1200-km-long, 100-kmwide; Figure 1). The TMVB is associated with the subduction of the Cocos and Rivera plates beneath the North America plate (Suárez and Singh, 1986; Ego and Ansan, 2002; Figure 1). The crustal seismicity of this region is not related to the subduction along the Middle America Trench (MAT) but is due to numerous east-west striking normal faults that are characterized by pronounced scarps and displace Quaternary volcanic rocks (Suter et al., 1992; 1995). The Acambay region is located at the central part of the TMVB; it consists of a series of depressions bounded by normal faults, such as the Acambay graben (Figure 2). The Acambay graben is up to 80 km long and 15-38 km wide and has a maximum topographic relief of 500 m (Suter et al., 1992; 1995). The graben is delimited by the Epitacio-Huerta and Acambay-Tixmadejé faults to the north and by the, Venta de Bravo and Pastores faults, to the south (Figure 2). The Epitacio-Huerta fault is 30-km-long normal fault with E-W direction and dip to the south but its activity has not been demonstrated. The Acambay-Tixmadejé fault is about 42-km-long, south-dipping normal fault (Suter et al., 1992) (Figure 2). The Acambay-Tixmadejé fault forms the master fault of the Acambay graben and was the principal seismogenic source of the 1912 Acambay earthquake (Urbina and Camacho, 1913). The Venta the Bravo is a 45-km-long active normal fault with E-W direction and dip to the north. The Pastores fault is about 32-km-long, north-dipping active normal fault (Suter et al., 1992; Langridge et al., 2013; Figure 2). The San Mateo fault is 13 to 25-km-long active normal fault with E-W direction and dip to the south at the center of the graben (Sunye-Puchol et al., 2015).
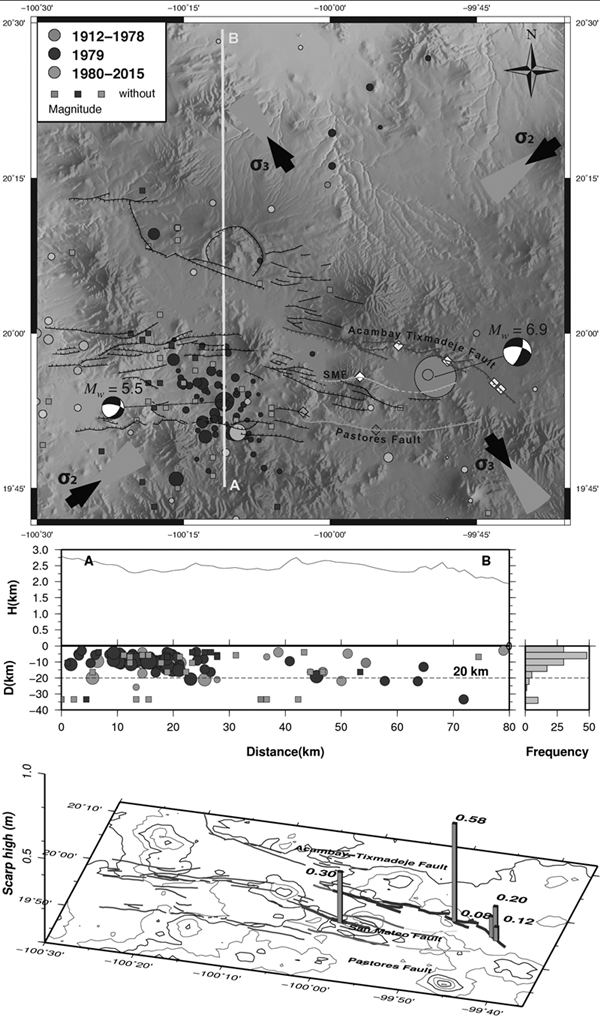
Figure 2: a) Main tectonic features in the Acambay region: the Acambay-Tixmadejé fault, the Pastores fault (PF), and the San Mateo fault (SMF). Diamonds are paleoseismological trench sites of Langridge et al. (2000) (yellow), Langridge et al. (2013) (magenta), Ortuño et al. (2015) (green), and Sunye-Puchol et al. (2015) (white). Focal mechanisms based on results of Astiz (1980) (Maravatio earthquake, Mw 5.5) and fault orientation reported by Suter et al. (1995) and Langridge et al. (2000) (Acambay earthquake, Mw 6.9). Thick black arrows indicate the direction of principal stresses with their incertitude cone based on Ego and Ansan (2002). b) Most of the events in the region occur at depths less than 20 km (Cross-section AB). c) Major surface fault rupture for the 1912 event (blue bold line). Red bold lines show the interpreted extended fault rupture based on descriptions of Urbina and Camacho (1913) in adjacent areas. Vertical bars depict scarp heights reported by Urbina and Camacho (1913) and Langridge et al. (2000)
Data and methods
Data
Paleoseismological studies on faults in Mexico concentrate mainly near the epicentral area of the Acambay 1912 earthquake (central segment of the TMVB; Figures 1 and 2), since that was one of the most damaging events occurred in the continental enviroment of Mexico and there are other faults which have not ruptured in historical times. We used the method proposed by Atakan et al. (2000) to estimate uncertainties in paleoseismic studies in the Acambay graben region. We focus our analysis on the studies conducted by Langridge et al. (2000) on the Acambay-Tixmadejé fault; Langridge et al. (2013) and Ortuño et al. (2015) on the Pastores fault; and Sunye-Puchol et al. (2015) on the San Mateo fault (Figure 2). All the mentioned studies used trench evidence for identifying paleoearthquakes with a magnitude and time of occurrence, making them suitable for the methodology proposed by Atakan et al. (2000). The relevant data employed in the uncertainty estimation will be discussed in a subsequent section.
Uncertainty
estimation Atakan et al. (2000) introduced a method to estimate uncertainties in paleoseismic studies using a logic-tree formalism. The method is based on quantitative description of uncertainties related to paleoseismological data and its interpretation. In this method, the cumulative uncertainties associated with different stages of the study are computed as the combination of the preferred alternative branches of the logic-tree. The total uncertainty and its relative importance in seismic hazard analysis is expressed by a quality factor, known as the paleoseismic quality factor (PQF). This PQF can be directly used in seismic hazard analysis and compared with other studies (Atakan et al., 2000). The different study stages are represented as different nodes of the logic-tree. Each node has at least two alternative branches with their respective uncertainties. One branch represents the preferred solution and the other the sum of the remaining alternatives. The uncertainties are expressed in terms of probabilities assigned to each branch of the logic-tree. Eventually, a joint probability of the preferred alternatives will provide a qualitative measure of uncertainty of the paleoseismological analysis. According to Atakan et al. (2000), the relevant steps in the paleoseismic analysis are: 1) tectonic setting and strain-rate; 2) site selection criteria: 3) extrapolation of the conclusions drawn from the detailed site analysis to the entire fault; 4) identification of individual paleoearthquakes; 5) dating of paleoearthquakes; 6) paleoearthquake size estimates. In what follows, we summarize the main aspects of each step.
Atakan et al. (2000) classified the tectonic settings into three different categories. Each of them with an associated quality weight factor (QWF): plate boundaries (high strainrate, QWF = 0.8 - 1.0); active plate interiors (intermediate strain-rate, QWF = 0.6 - 0.8); and stable continental regions (low strain-rate, QWF = 0.4 - 0.6). The site selection criteria take into account the methods used to select a site for detailed analysis. The site selection is mainly based on geomorphological information but according to the authors it should be supported by complementary studies. If the geomorphological evidence is supported by at least two or more geodetic and/or geophysical analyses, a QWF of 0.8 - 1.0 is assigned. If the geomorphological evidence is supported by an additional geodetic or geophysical study, a QWF of 0.6 - 0.8 is assigned. If only geomorphological is used, a QWF of 0.4 - 0.6 is assigned. If the selection is based on other indirect evidence, a weight of < 0.4 is assigned.
A criterion to assess the amount of extrapolation of site data to the entire fault is proposed. This criterion is based on the ratio of the total trench area studied to that of the entire fault area (TFR). TFR is defined as (Atakan et al., 2000:
where Ast is the total area of the studied trenches, Af is the total fault area, n is the number of trenches used, Tli and Tdi are the trench length and depth for the i-th trench, respectively, Fl is the fault length and Fd is the fault depth. Depending on the TFR value, a QWF is assigned. If TFR is in the interval of 0.5 - 1.0 (very good classification), QFW is equal to 0.8 - 1.0. If TFR ranges from 0.1 to 0.5 (good classification), QFW is equal to 0.6 - 0.8. If TFR varies from 0.01 to 0.1 (moderate classification), QFW is equal to 0.4 - 0.6. If TFR ranges from 1 x10⁻⁶ to 0.01 (poor classification), QFW is equal to 0.2 - 0.4. If TFR is < 1 x10⁻⁶ (very poor classification), QFW has a value of < 0.2. We estimated uncertainties in the TFR by using error propagation rules. Uncertainties in the TFR are mainly due to errors in Fl and Fd. We do not consider errors in the trench dimensions, because they are controlled parameters. We obtained the following expression to estimate error factor in the TFR (dTFR):
where dFl and dFd are the uncertainties in the fault length and depth, respectively.
Paleoearthquake identification in the trenches is based on diagnostic criteria. These criteria are used to preclude the possibility of similar structures created by nontectonic processes. The criteria consider the paleoseismic features defined by McCalpin and Nelson (1996) which focus on three aspects: genesis, location and timing, respectively. Based on the abundance of non-seismic features, a QWF is assigned: few (QWF = 0.8 - 1.0), some (QWF = 0.6 - 0.8), common (QWF = 0.4 - 0.6) and very common (QWF < 0.4) features, respectively. The uncertainties related to the dating of paleoearthquakes depend on the precision and accuracy of the techniques used. Estimating the size of the events is based on either primary or secondary evidence (Atakan et al., 2000). Primary evidence includes the following criteria: seismic moment (QWF = 1.0); rupture area (QWF = 0.9); length x displacement, and average displacement (QWF = 0.8); surface-rupture length (QWF = 0.7); maximum displacement (QWF = 0.6). On the contrary, secondary evidence includes the following criteria: the total are afected by liquefaction (QWF = 0.5) and landslides (QWF = 0.4).
The QWFs are expressed in terms of percent probabilities indicating the relative reliability of the chosen (preferred) alternative. This allows to account for uncertainties systematically. The concept of entropy has been used in information theory to characterize uncertainties in decision trees (Shannon, 1948). The entropy of a probability distribution (H) is defined as (Shannon, 1948):
where pi are the probabilities. H ranges from 0 to 1 where high H is associated with high uncertainty and viceversa. We also quantified the conditional entropy in order to estimate uncertainties in tree nodes conditioned on a particular probability value in previous branches (stages in paleoseismology analysis). The conditional entropy is defined as:
where a and b are two random variables.
The cumulative uncertainties provide an end solution (probability) (paleoseismic quality factor, PQF). PQF is defined as:
where Pes is the probability of the preferred end-solution, in the logic-tree analysis, Cri is a correction term for the relative level of importance of the investigation in the seismic hazard analysis. Cri depends on the aim of the paleoseismic study (see Table 1).
Case study 2 (Pastores fault): The Pastores fault is also located in a continental plate interior, where the strain-rate is classified under the intermediate strain-rate category (< 0.04 mm/yr in the central fault segment, Suter et al., 1995; and 0.23 - 0.37 mm/yr at the western fault tip, Ortuño et al., 2015) (Figure 2). The site selection was based on geomorphological evidence supported by a ground penetrating radar (GPR) prospecting (Langridge et al., 2013; Ortuño et al., 2015). Fault length and depth are 32 and 15 km, respectively. Table 2 shows the number of trenches and their dimensions. The diagnostic features observed in the trenches were of primary origin on the fault and co-seismic. The evidence used to identify the events was based on disturbed stratigraphic horizons and colluvial wedges indicating vertical offset (Langridge et al., 2013; Ortuño et al., 2015). Both and used 14C to determine the date of the organic material from the sedimentary deposits in the trenches. In the central fault segment, three paleoearthquakes were identified (Langridge et al., 2013). The events occurred at 12.2 - 23.9 ky cal BP, 23.9 - 34.6 ky cal BP, and 31.5 - 41.0 ky cal BP, respectively. The average recurrence time is about 10 - 15 ky cal BP (Langridge et al., 2013). At the western fault tip, five paleoearthquakes were identified within the past 4 ky (Ortuño et al., 2015). A recurrence interval of 1.1 - 2.6 ky cal was inferred (Ortuño et al., 2015). Langridge et al. (2013) reported magnitudes of 6.4 < Mw < 6.8 for the paleoearthquakes based on maximum displacement and surface rupture. Ortuño et al. (2015) reported magnitudes of 5.8 based on the scaling relationships of Wells and Coppersmith (1994) for average displacement of normal fault events at the western end. The magnitudes were also estimated with the scaling relations of Wesnousky (2008), obtaining magnitudes of about Mw ~ 6.7.
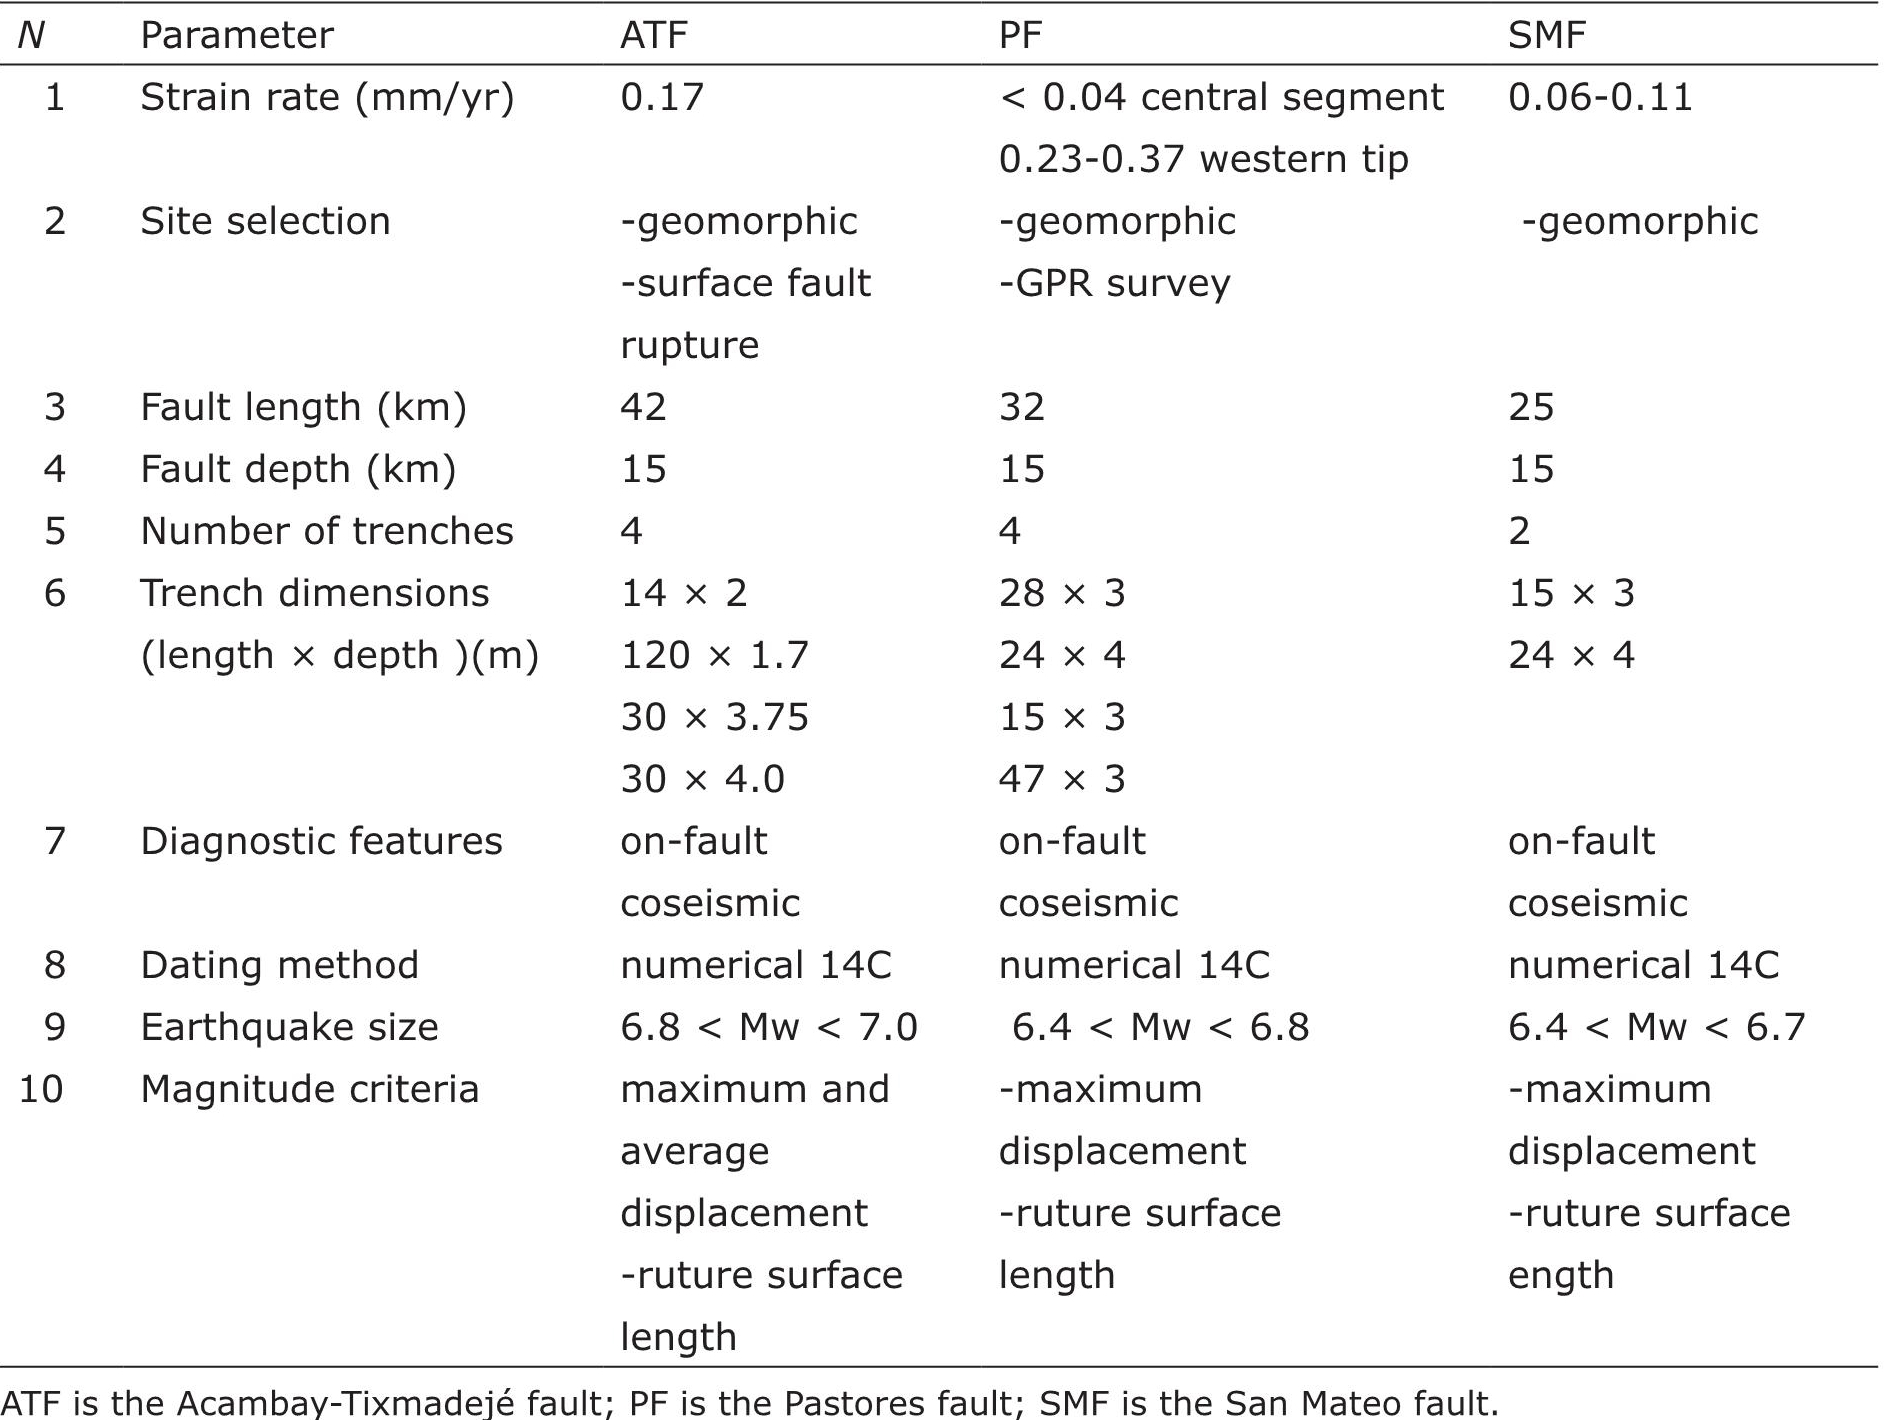
ATF isthe Acambay-Tixmadejé fault; PF is the Pastores fault; SMF is the San Mateo fault.
Table 2 Input parameters
Case study 3 (San Mateo fault): The San Mateo fault is located in a continental plate interior as the other cases, and the strain-rate is classified under the intermediate strainrate category (0.060 - 0.11 mm/yr, Sunye-Puchol et al., 2015). The site selection was based only on geomorphological evidence (Sunye-Puchol et al., 2015). Fault length and depth are 25 and 15 km, respectively. Table 2 shows the number of trenches and their dimensions. The diagnostic features observed in the trenches were of primary origin on the fault and co-seismic. The evidence used to identify the events was based on disturbed stratigraphic horizons and colluvial wedges indicating vertical offset (Sunye-Puchol et al., 2015). Sunye-Puchol et al. (2015) used 14C to determine the date of the organic material from sedimentary deposits in the trenches. The dating results indicated that in total, three paleoearthquakes were identified (Sunye-Puchol et al., 2015). These events occurred in the last 31 - 29.2 ky cal BP, 19.1 - 6.5 ky cal BP and 6.0 - 4.2 ky cal BP, respectively (Sunye-Puchol et al., 2015). A recurrence interval of 11.57 ± 5.32 ky cal BP was inferred (Sunye-Puchol et al., 2015). Sunye-Puchol et al. (2015) reported magnitudes in the range of 6.4 < Mw < 6.7 based on maximum displacement and surface rupture length of 13 km.
Results and Discussion
The results are presented for individual faults and then we discuss the advantages and possible drawbacks in the paleoseismology uncertainty method. The assigned QWFs in all the logic tree stages are listed in Table 3. Uncertainties in TFR are estimated with the following assumptions: Fl = 42 ± 2 km and Fd = 15 ± 5 km; Fl = 32 ± 4 km and Fd = 15 ± 5 km; Fl = 13 ± 7 km and Fd = 15 ± 5 km for the Acambay-Tixmadejé, Pastores and San Mateo faults, respectively. Estimations of Fd are based on reported seismicity in the Acambay region (Figure 2b). The calculated TFR with uncertainties are: (7.37 ± 2.48) x 10-7, (7.62 ± 2.71) x 10-7 and (3.76 ± 2.19) x 10-7 for the Acambay-Tixmadejé, Pastores and San Mateo faults, respectively. All the results belong to the very poor class according to the classification of Atakan et al. (2000). These errors represent 34, 36 and 58% of the TFR value for the ATF, PF and SMF, respectively.
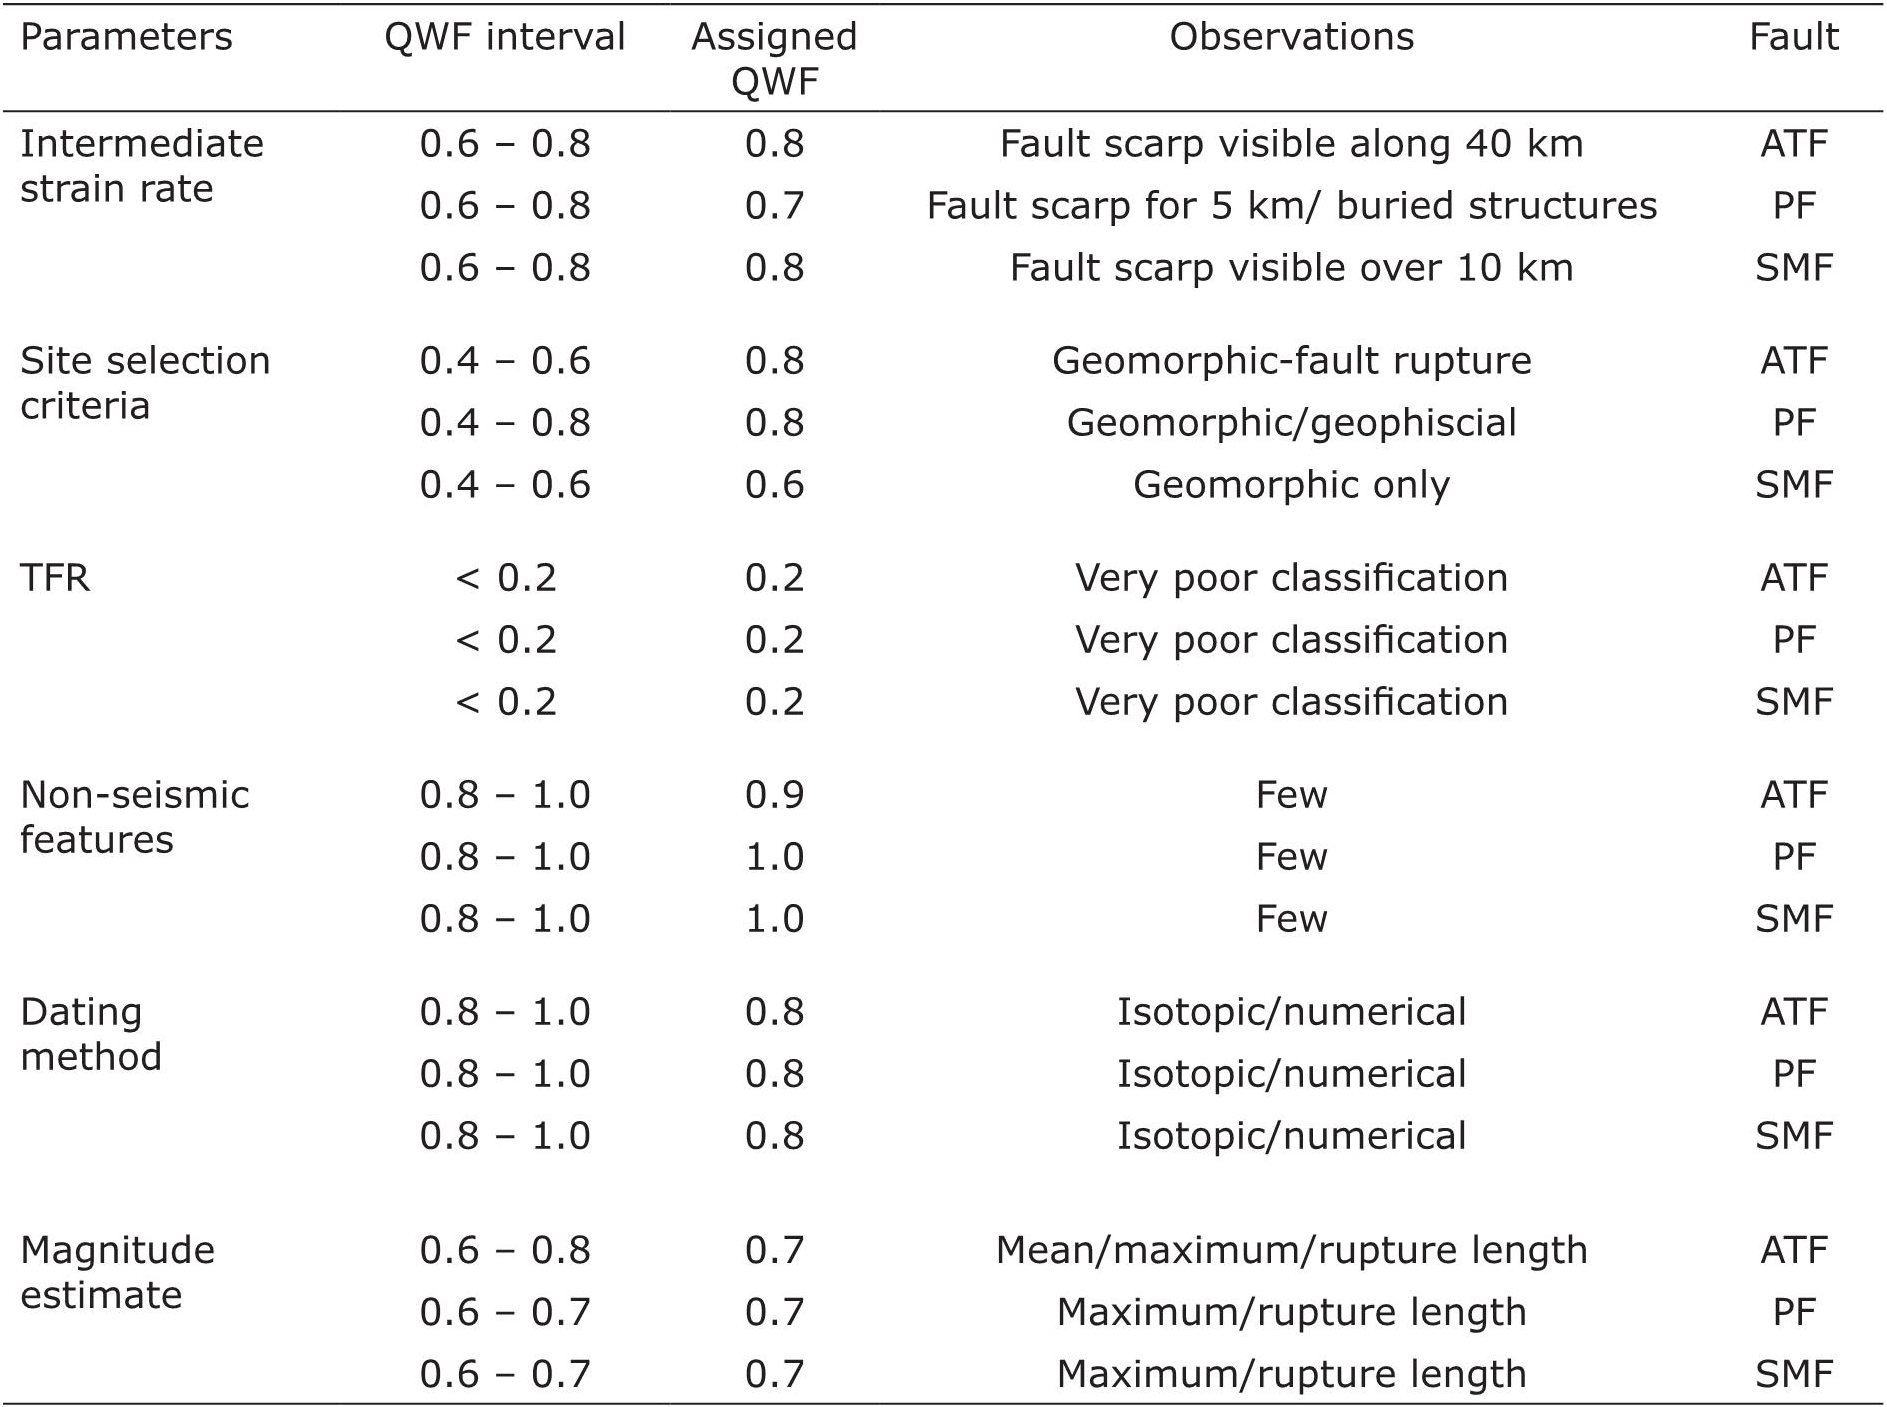
ATF isthe Acambay-Tixmadejé fault; PF is the Pastores fault; SMF is the San Mateo fault.
Table 3 Results
Applying the logic-tree formalism, the probability of the preferred end solution in the analysis is found to be Pes = 0.0681 (Figure 3) for the Acambay-Tixmadejé fault. The study conducted by Langridge et al. (2000) focused on characterizing typical events in terms of magnitude and time recurrence in the Acambay-Tixmadejé fault, thus a Cri of 2 is assigned (Table 1 and Figure 3). Accordingly, we obtain a PQF of 0.14. For the case of the Pastores fault, we obtained a Pes of 0.0502 (Figure 3). Langridge et al. (2013) stated that the aim of their study is to assess the earthquake potential of the Pastores fault, thus a Cri of 8 is assigned (Table 1 and Figure 3). This gives a PQF1 of 0.40. The study conducted by Ortuño et al. (2015) focused on the activity of the Pastores fault, thus a Cri of 10 is also assigned (Table 1 and Figure 3). Accordingly, the PQF2 is 0.50. In the case of the San Mateo fault, the probability of the preferred end solution in the analysis is Pes = 0.0511 (Figure 3). Sunye-Puchol et al. (2015) stated that the aim of their study is to assess the earthquake potential of the San Mateo fault, thus a Cri of 8 is assigned (Table 1 and Figure 3). For this case, we get a PQF of 0.41.
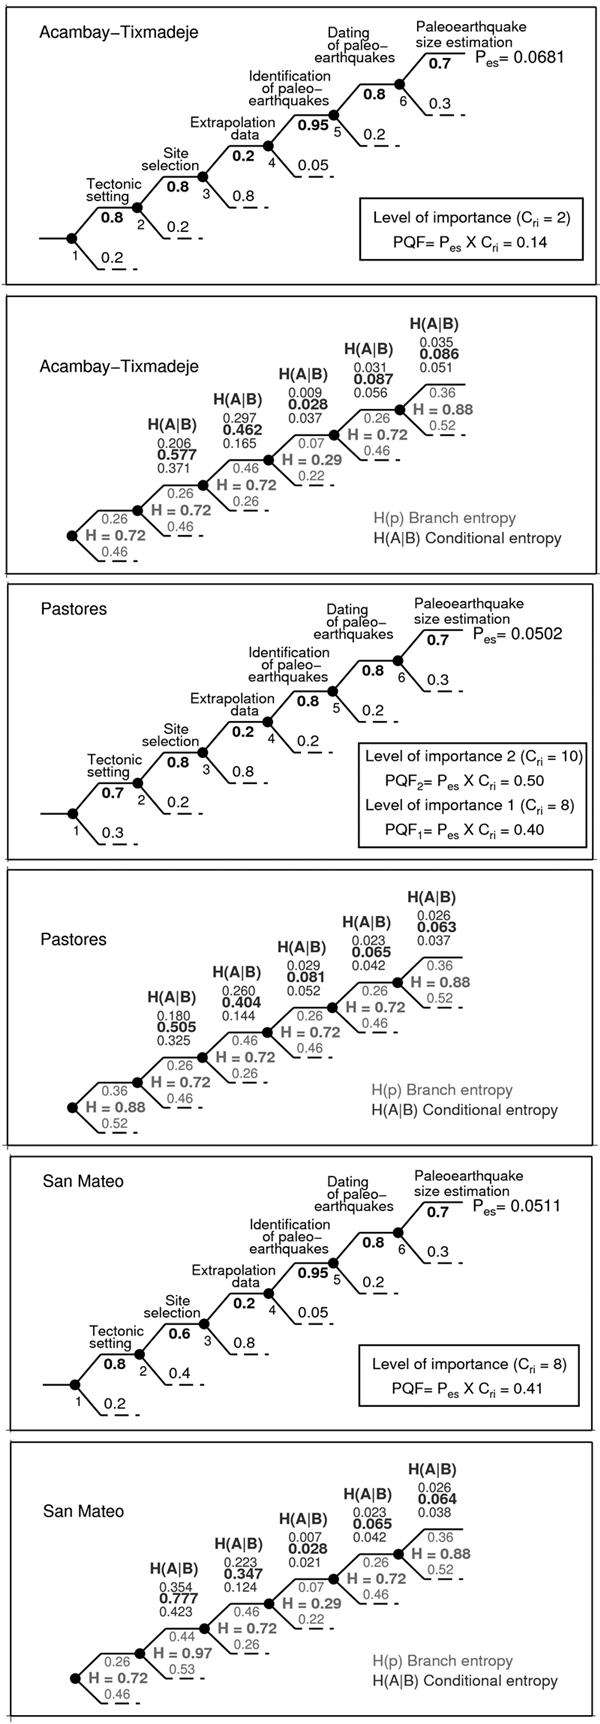
Figure3: Paleoseismology logic-trees for the Acambay-Tixmadejé, Pastores and San Mateo faults. The logic-trees consist of 12 branches and 6 nodes at which certain probabilities must be defined. The result is the probability of the preferred end solution (Pes). In this study, Pes is 0.0681, 0.0502 and 0.0511 for the Acambay-Tixmadejé, Pastores and San Mateo faults, respectively. The paleoseismic quality factor (PQF) is Pes x Cri (Cri is a correction term depending on the level of importance of the study). PQF is 0.14, 0.40-0.50, and 0.41 for the AcambayTixmadejé, Pastores and San Mateo faults, respectively. Estimations of entropy for each branch is shown in the lower panels of a), b) and c) in red colors. Mean entropies are shown bold red color (middle value). Conditional entropy for each branch (upper and lower values) and the average (middle value) are indicated in blue color. Upper values represent the preferred branch.
Comparing the entropy, the lowest entropy values are related to the identification of the paleoevents stage (Figure 3a and 3c and Table 4) for the preferred branch and the mean entropy at the ATF and SMF. For these faults the conditional entropy showed a similar behavior throughout the stages (Figure 3a and 3c and Table 4). The correct identification of paleoearthquakes seems to be a key step in estimating uncertainties as is also seen in the Pastores fault case. A QWF of 0.8 in this stage produces significant fluctuations in the entropy of the tree (Table 4). The conditional entropy in the last tree node represents the uncertainty at the end of the paleoseismological study. This final entropy is lower than the conditional entropy in the first two study stages (for example in the site selection and extrapolation data steps) (Figure 3). By incorporating more stages with relative good QWFs, the conditional entropy decreases as shown in Table 4 and Figure 3. This highlights the importance of adding more stages in the paleoseismological studies resulting in more complex logic trees.
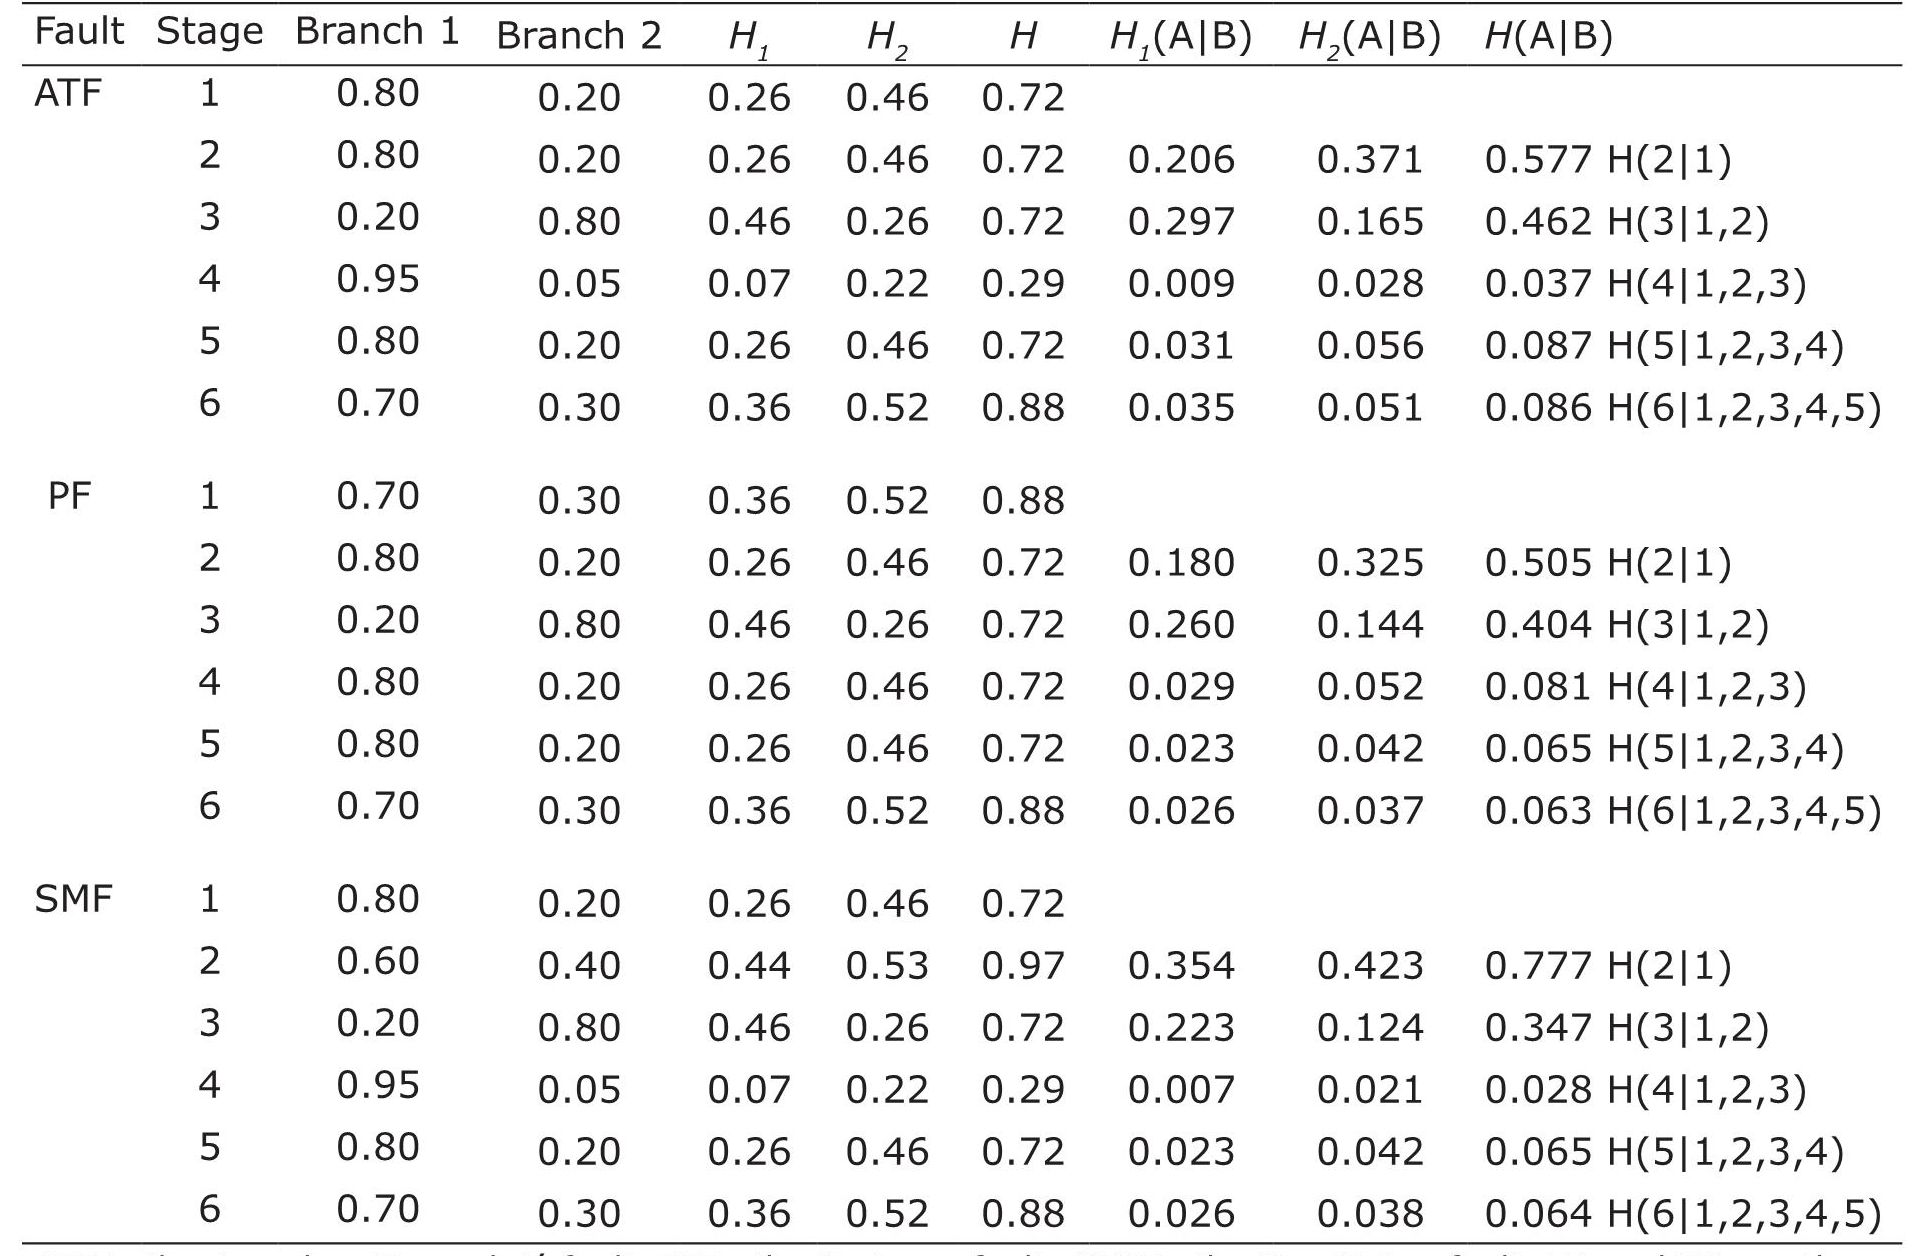
ATF is the Acambay-Tixmadejé fault; PF is the Pastores fault; SMF is the San Mateo fault. H1 and H2 are the entropy in branches 1 and 2, respectively. H is the mean entropy. H1(A|B) and H2(A|B) are the conditional entropies in branches 1 and 2, respectively. H(A|B) is the mean conditional entropy.
Table 4: Entropy analysis
Paleoseismology has to deal with many uncertainties caused in particular by limitations in site selection and earthquake identification. Subjective evaluations are inherent in paleoseismic studies, thus the quantification of uncertainty is necessary to address this problem. The logic trees are first attempts to quantify uncertainties that are often hard to express in numbers, and this approach reaches its limits at certain points. Some nodes of the logic trees are based on a number of different criteria, which allow calculations of a wide range of probability values. For example the estimation of QWF for intermediate strain-rate tectonic enviroments (0.6 < QWF < 0.8). Additionally, the paleoseismological logic-tree is mainly designed to investigate faults and related coseismic surface ruptures and hardly incorporates the large variety of secondary earthquake ground effects (e.g. ground failure, liquefaction, landslides). Atakan et al. (2000) mentioned that some of the uncertainties that are not considered in their analysis are: 1) those related with the completeness of the paleoseismic records; and 2) aspects concerning the time evolution of different processes involved rupture process. For example, the difficulties in matching the long-term deformation rates with the co-seismic slip and whether the maximum observed slip at fault is a result of a single or several paleoearthquakes. These aspects can be implemented in the logic-tree analysis but they are difficult to quantify. For future refined studies, these and other aspects would have to be taken into consideration, at least comparatively, to account for the peculiarity of the different studies areas. In the particular case of the Acambay graben, some important factors that are not taken into account by the logic-tree methodology proposed by Atakan et al. (2000), are: 1) the data relative to the 1912 earthquake rupture along the Acambay-Tixmadejé fault; 2) the width of the fault zone that may influence the distribution of deformation on unstudied secondary faults; 3) the completeness of the sedimentary record in the trench that directly controls the completeness of the record of paleoseismological events identified.
We now analyze possible sources for the low level of classification of the paleoseismological studies conducted in the Acambay region obtained through the logic tree scheme. One disadvantage of these studies is that few were supported by complementary geodetic and/ or geophysical methods. The identification of suitable places for trenching was mostly based on geomorphological evidence. Only one study used a complementary method to the paleoseismic analysis (see Ortuño et al., 2015). The advantage of the studies, on the other hand, was that they used numerical dating techniques and they provided a complete description of the diagnostic criteria employed at each trench. A key point in seismic hazard analysis, is the magnitude estimation of the paleoevents. Most of the estimated magnitudes were based on the scaling relationships of Wells and Coppersmith (1994). These relations have been shown to be a poor approximation to magnitudes in certain regions (Stirling et al., 2013), such as continental ones. The studies do not specify the valid magnitude range of these relations. For example, Ortuño et al. (2015) reported magnitudes of about 5.8 considering average displacement on the Pastores fault using relations developed for events in the magnitude range of 6.0 < M < 7.3. Another source of low uncertainity of the analyzed studies concerns the extrapolation of site data to the entire fault, since most of them were carried out at single point in the fault, so they fall under the very poor qualitative classification following the rules of Atakan et al. (2000) (Table 1). They, nevertheless, provide data of utmost importance since no other source of information was available previous to these studies, which could be used towards a comprehensive evaluation of risk in the region.
Because of the lack of similar studies and the absence of sufficient estimations of PQFs values for different regions, a robust comparison of our results in a logic-tree framework was not possible. We can just state that by incorporating geophysical/geodetic studies, and by analyzing more trenches, a better PQF can be obtained resulting in more reliable results for the Acambay region. For example, under these conditions Atakan et al. (2000) obtained better estimates of PQF (PQF = 0.76). More studies are needed to compare different tectonic settings and to prove whether the logic tree approach is suitable method to quantify uncertainties in paleoseismological studies. This comparison could be possible because the logic-tree approach takes into account the tectonic setting and site environment in the probability estimations. A direct comparison of several studies in a certain region may enhance the reliability of the results (Sintubin and Stewart, 2008; Grützner et al., 2010). Grützner et al. (2010) suggested the incorporation of secondary earthquake ground effects and their relation to ground geotechnical properties and seismic amplification in the logic tree approaches. This will allow to conduct more realistic assessments of non-faulted sites devastated by ground shaking which is the case for most of the severely damaged locations during individual earthquakes (Grützner et al., 2010). In the case of the Acambay region, a detailed study of site effects is needed to improve our uncertainty estimates and seismic hazard assessment. Nevertheless, the logic-tree formalism proposed by Atakan et al. (2000) is prone to improvement by considering other aspects currently not taken into account, or investigating the effect of different weights on the tree branches.


 nueva página del texto (beta)


