Introduction
It is well known that, throughout the Holocene prior the industrial period, global climate changes took place under the influence of only natural factors including solar activity and powerful volcanic eruptions (Shumilov et al., 2000; Shindell et al., 2003; Soon and Baliunas, 2003). These factors strongly affect climate and atmosphere of the Earth (Crowley, 2000; Shumilov et al., 2000; Shindell et al., 2003; Soon and Baliunas, 2003; Velasco and Mendoza, 2008), but which of them (and some others as well) plays a dominant role is currently under discussion. However, it should be noted that considerable contribution to climatic change in recent decades is due to man-made factors (Vecchi and Soden, 2007). Volcanic eruptions emit huge amounts of volcanic dust, sulfur dioxide and water vapor into the atmosphere reducing the atmospheric transparency and preventing the penetration of solar radiation to the earth’s surface. All these processes result in breaking the radiation balance of the atmosphere and lead to reduction of the surface temperature in most cases. Sulfate aerosols that enter the stratosphere after powerful volcanic eruptions may exist there for several years (Robock, 2000). Recent powerful volcanic eruptions such as Tambora (1815), Krakatau (1883), Santa Maria (1902), Katmai (1912), Agung (1963), El Chichon (1982), and Pinatubo (1991), caused a cooling in the Northern Hemisphere by 0.2 - 0.8º C for several years (Rampino and Self, 1982; Robock, 2000; Wigley, 2000; Zanchettin et al., 2013). For example, the 1815 Tambora eruption produced the “year without a summer” in 1815 (Rampino and Self, 1982; Robock, 2000). However, volcanic eruptions cause not always and not everywhere cooling events. The climatic response to volcanic eruptions varies regionally and depends on the amount, chemical composition and height of volcanic emissions. Some studies documented that volcanic activity can lead to regional warming and even droughts, as happened, for example, after the 1783 Laki eruption in Iceland, when most of the European territory was covered by an unusually dry fog (Thordarson and Self, 2003; Ogle et al., 2005), and after the 1991 Pinatubo eruption in Indonesia (McCormick et al., 1995; Robock, 2000).
The period of instrumental meteorological observations does not exceed 100 - 120 years and covers only a small number of powerful volcanic eruptions. Therefore, the climatic effects of volcanic activity were studied using several proxy records (the content of sulfuric acidity in ice cores and tree-ring data) (Hammer et al., 1980; Scuderi, 1990; Briffa et al., 1998; Gervais and MacDonald, 2001; Vaganov and Shiyatov, 2005; Shumilov et al., 2000; 2011; Kasatkina et al., 2013). The possible response of tree-ring growth and even the formation of so-called “frost rings” (Vaganov and Shiyatov, 2005) are associated with a decrease of temperature after major volcanic eruptions. The emission of a large amount of volcanic gases into the atmosphere leads to acid precipitation, which can as well cause deep depression in tree growth (Thordarson and Self, 2003; Ogle et al., 2005). Moreover, the reduction of atmospheric transparency can affect the process of photosynthesis (Scuderi, 1990; Ogle et al., 2005).
It should be noted that the temperature decreases are more considerable when the volcanic eruptions occur during the minima of solar activity. Widely known is the period of global cooling during the Maunder minimum of solar activity (1645 - 1715 AD) which occurred in the Little Ice Age. The main solar factors influencing climate and atmosphere are solar radiation (Lean et al., 1995; Haigh, 1996), cosmic rays and, possibly, cosmic dust influencing the cloud cover of the atmosphere (Shumilov et al., 1996; Svensmark and Friis-Christensen, 1997; Kasatkina and Shumilov, 2005; Kasatkina et al., 2007). Climatic impacts are most clearly expressed in ring width of trees growing in extreme conditions close to the tree line at sites of their biological surviving (Fritts, 1976; Grace et al., 2002). The northern (or Arctic) tree line is the northernmost latitude where trees can grow. The Arctic tree-ring chronologies are of most interest for paleoclimatic studies because the trees growing near the northern tree-line seem to be highly sensitive to the influence of such external factors as temperature and solar radiation.
The aim of this study is to verify a hypothesis concerning the possible regional climatic response to volcanic and solar activity impacts during the last millennium by analyzing polar tree-ring chronologies from Kola Peninsula and Finnish Lapland.
Geographic setting
The tree-ring data used in this study were collected near the northern tree-line at Loparskaya station, Kola Peninsula (68.63 N, 33.25 E) (Figure 1). The climate of the Kola Peninsula unlike the other polar regions of Russia is influenced by warm air masses of the North Atlantic and cold air of Arctic regions (the Barents Sea, the Kara Sea, and the Taymir Peninsula). The Kola Peninsula involves three climatic zones: sea coast, central area, and mountain section. The climate of the northern sea coast including the sampling site is influenced by the Barents Sea. The mean temperature is in the range from -6 to -12º C in the coldest month (February) and from 12 to 13º C in the warmest month (July). The annual mean temperature (precipitation) in the region ranges from 0º C (600-700 mm) on the coasts of the Barents and White Seas to -2º C (500-600 mm) in the central part of the Kola Peninsula. The mountain area is characterized by a cooler summer, a relatively mild winter, and a lot of precipitation with an average value of 1000 mm.
The Kola Peninsula is covered by taiga in the south and tundra in the north. The dominant tree species at or near the tree-line include pine (Pinus sylvestris L.), spruce (Picea obovata Ledeb.), and birch (Betula pubescens ssp. szerepanovii).
Methods
A total of 36 timber cores of Pinus sylvestris L. were sampled at the northern tree-line, including the oldest living pine with more than 560 years of age. Ring widths were measured with a precision of 0.01 mm by using an image analysis system (scanner and relevant software) (Kanatjev et al., 2014). Using these samples, the Loparskaya tree-ring chronology from living trees covering the period from 1445 to 2005 was developed. The data were processed using modern methods adopted in dendrochronology (cross-dating and standardization) with the help of COFECHA and ARSTAN programs (Holmes, 1983; Cook and Kairiukstis, 1990). In this study we also used the Finnish supra-long (~ 7500 years) tree-ring chronology collected at Northern Lapland (68-70º N; 20-30º E) (Helama et al., 2008).
Superposed epoch analysis of both chronologies was performed to asses the tree growth response on the most powerful (VEI>4, Volcanic Explosivity Index) volcanic eruptions (http://www.volcano.si.edu/world/largeeruptions.cfm). The VEI evaluates volcanic eruptions based on the height of the eruption column and solid material ejected (Newhall and Self, 1982). The most powerful volcanic eruptions can cause lowering of temperature and tree growth for five years and more (Rampino and Self, 1982; Scuderi, 1990; Robock, 2000; Wigley, 2000; Gervais and MacDonald, 2001; D’Arrigo et al., 2013; Zanchettin et al., 2013). aIn the present study, the analysis was based only on those events that are at least 7 years apart. As a result, a total of 19 events are considered covering the period from 1445 to 2005 (see the Table 1). Analysis of individual events (Huaynaputina in 1600, Laki in 1783 and Tambora in 1815) was also performed. Yearly averages of sunspot numbers were obtained from the National Geophysical Data Center (ftp://ftp.ngdc.noaa.gov) for the period of 1700 - 2005.
Table 1 Most powerful volcanic eruptions (VEI>4) since AD 1470.
| Volcanoes | Eruption dates | Coordinates | VEI | |
|---|---|---|---|---|
| Sakura-Jima, Japan | November 3, 1471 | 31.6 N, 130.7 E | 5 | |
| Agua de Pau, Azores | June 28, 1563 | 37.8 N, 25.5 W | 5 | |
| Huaynaputina, Peru | + | February 19, 1600 | 16.6 S, 70.9 W | 6 |
| Parker, Philippines | + | January 4, 1641 | 6.1 N, 124.9 E | 5 |
| Gamkonora, Indonesia | May 20, 1673 | 1.4 N, 127.5 E | 5 | |
| Tongkoko, Indonesia | + | 1680 | 1.5 N, 125.2 E | 5 |
| Fuji, Japan | December 16, 1707 | 35.4 N, 138.7 E | 5 | |
| Katla, Iceland | + | May 11, 1721 | 63.5 N, 19 W | 5 |
| Shikotsu, Japan | + | August 19, 1739 | 42.7 N, 141.3 E | 5 |
| Katla, Iceland | October 17, 1755 | 63.5 N, 19 W | 5 | |
| Laki, Iceland | June 8, 1783 | 64.4 N, 17.3 W | 4+ | |
| St Helens, USA | + | January 15, 1800 | 46.2 N, 122.2 W | 5 |
| Tambora, Indonesia | April 10, 1815 | 8.3 S, 118.0 E | 7 | |
| Galunggung, Indonesia | October 8, 1822 | 7.3 S, 108.1 E | 5 | |
| Cosiguina, Nicaragua | + | January 20, 1835 | 13 N, 87.6 W | 5 |
| Askja, Iceland | March 29, 1875 | 65 N, 17 W | 5 | |
| Azul, Chile | + | April 10, 1932 | 35.7 S, 70.8 W | 5 |
| Agung, Indonesia | March 17, 1963 | 8.3 S, 115.5 E | 5 | |
| Pinatubo, Philippines | + | June 15, 1991 | 15.1 N, 120.4 E | 6 |
By crosses indicated the major volcanic eruptions that affect the tree growth at the study area.
To identify the main periodicities and their evolution in time-frequency mode, we applied the continuous wavelet transform (CWT) of a time series X (Torrence and Compo, 1998):
where t is the time, s is the wavelet scale, b is the shift of the analysis window, ψ is the base wavelet function. We used here the Morlet function that may be defined as a plane wave modulated by a Gaussian function (Torrence and Compo, 1998):
where ω 0 is the dimensionless frequency (we use here ω 0=6, since it provides a good balance between time and frequency localization). In order to avoid the edge effects, Torrence and Compo (1998) introduced the cone of influence (COI) in which the wavelet power caused by a discontinuity at the edge has dropped by a factor e-2.
To examine the relationship in time-frequency scale between tree-ring growth and solar activity, the cross-wavelet transform was applied to two time series (Grinsted et al., 2004):
where (*) denotes the complex conjugate, L and N indexes denote tree-ring and sunspot number time series respectively. The phase angle of W LN describes the phase relationship between L and N in time frequency space. We standardized (zero mean, unit standard deviation) both time series before analysis. The wavelet coherence (WTC) was used to assess a localized correlation coefficient in time frequency space between tree ring data and sunspot numbers (Grinsted et al., 2004):
where S denotes smoothing in both time and scale. The statistical significance levels of CWTs and WTC were estimated using Monte Carlo method against a red noise model (Torrence and Compo, 1998; Grinsted et al., 2004).
Results and Discussion
In this study, we analyzed climatic impacts of solar and volcanic activity with help of both (Loparskaya and Finnish supra-long) tree-ring chronologies developed on the basis of samples taken near the northern tree line (Figure 1).
Figure 2 shows tree-ring growth responses on the most powerful volcanic eruption of Huaynaputina (VEI=6) in February 1600 (see the Table). For comparison, the upper timberline Cirque Peak (California; 36.5º N, 118.2º E) foxtail pine tree-ring record (Scuderi, 1990) is also presented (see Figure 2 c). The 1600 eruption of Huaynaputina in Peru was the largest volcanic eruption in South America spanning the past 2000 years (de Silva and Zielinski, 1998; Fei et al., 2015; Stoffel et al., 2015). Based on ice core and tree-ring records, this eruption injected a large amount of sulfur (up to 32 Mt) into the atmosphere, reducing solar insolation and resulting in global temperature drop (Hammer et al., 1980; Scuderi, 1990; de Silva and Zielinski, 1998). The eruption of Huaynaputina in 1600 AD had a global impact on human society and dramatically affected the weather and environment in Central Europe, southern Scandinavia, China and the North America (Scuderi, 1990; de Silva and Zielinski, 1998; Verosub and Lippman, 2008; Fei et al., 2015; Stoffel et al., 2015). In Russia, this event caused strong frosts in the summer of 1601 and crop failure which led to severe famine and unprecedented mortality (more than 500,000 people) in 1601 - 1603, social disruption and political unrest called the Time of Troubles (Verosub and Lippman, 2008). Figure 2 shows a significant (more than 25%) reduction in tree growth, which is observed almost simultaneously in all three sites in the year following the eruption. All three curves behave identically and reveal a significant ring width decrease more than ten years (see Figure 2).
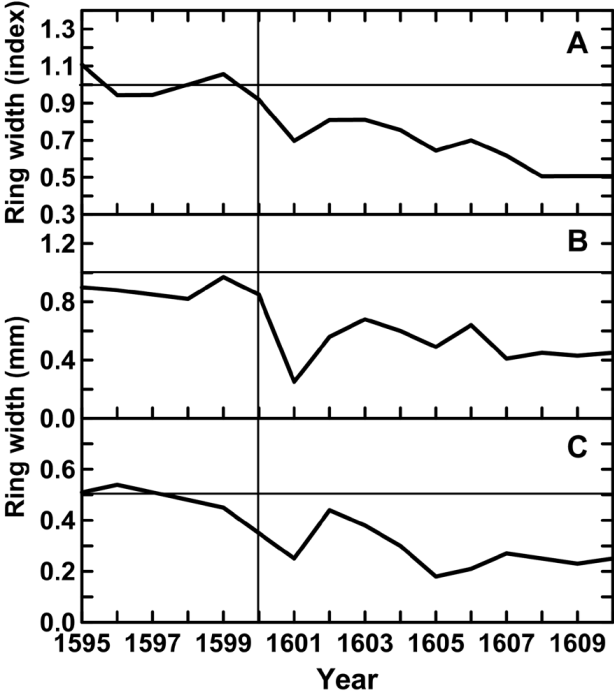
Figure 2 Tree-ring growth response to the volcanic eruption of Huaynaputina (VEI=6) in Peru (1600 AD): (A) the Loparskaya (68.63 N, 33.25 E) pine tree-ring chronology, (B) the Finnish supra-long (~ 7500 years) pine tree-ring chronology (68-70º N; 20-30º E), (C) the Circue Peak (California; 36.5º N, 118.2º E) foxtail pine tree-ring chronology (Scuderi, 1990)
The 1815 eruption of Tambora in Indonesia (VEI>7), which was the most powerful over the study period, ejected 80 Mt of sulfuric dioxide into the atmosphere and led to the temperature decrease (~ 0.8º C) in the Northern Hemisphere (Sadler and Grattan., 1999; Ogle et al., 2005; Stoffel et al., 2015). In North America and Central Europe, 1816 was called the “year without a summer”. However, the climate in Scandinavia in that year was mild, and no significant temperature drops were observed (Sadler and Grattan., 1999; D’Arrigo et al., 2013). From Figure 3, it is observed that the year 1816 shows no decrease in tree growth relative to the previous year. The decrease began much earlier (in 1808) and lasted until 1822, and again, all three curves are identical (see Figure 3). Some evidence (large acidity peak in ice core) indicate that a powerful climatically effective unknown volcanic eruption occurred in 1908/1909 (Scuderi, 1990; White et al., 1997; D’Arrigo et al., 2012; Guevara-Murua et al., 2014; Wahl et al., 2014). Two other powerful low-latitude volcanic eruptions in 1673 (Gamkonora) and in 1822 (Galunggung) also did not lead to the expected volcanic cooling (see Table 1). According to radiocarbon dating, a powerful volcanic eruption in 1660 (± 20 y) in New Guinea may have preceded the eruption of Gamkonora (White et al., 1997; Wahl et al., 2014). In this case, the expected volcanic cooling possibly resulted from increased atmospheric opacity from low-latitude eruptions in 1673 (Gamkonora), 1815 (Tambora), and 1822 (Galunggung) could be masked on the already existing background provided by the previous eruptions.
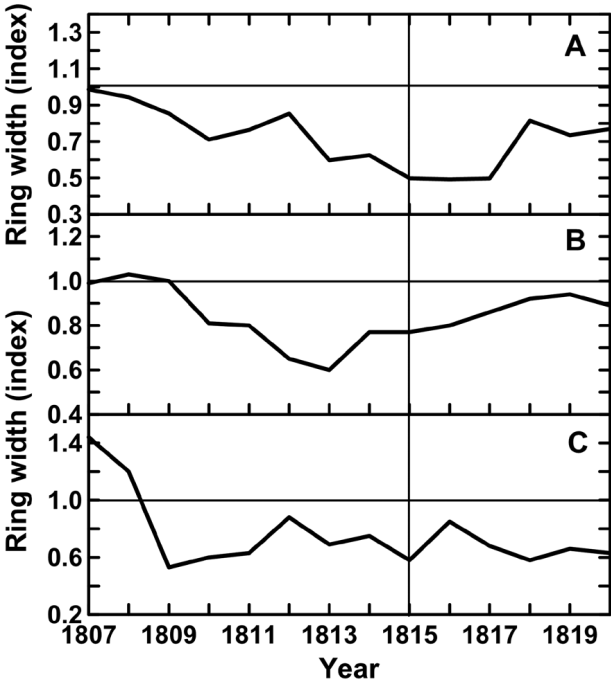
Figure 3 Tree-ring growth response to the volcanic eruption of Tambora (VEI=7) in Indonesia (1815): (A) the Loparskaya (68.63 N, 33.25 E) pine tree-ring chronology, (B) the Finnish supra-long (~ 7500 years) pine tree-ring chronology (68-70º N; 20-30º E), (C) the Circue Peak (California; 36.5º N, 118.2º E) foxtail pine tree-ring chronology (Scuderi, 1990).
It should be noted that all these eruptions occurred during the minimuma of solar activity, which possibly intensified the climatic response.
Icelandic volcanoes are most closely located to the Kola Peninsula and Finnish Lapland. Therefore, it is more interesting to study the environmental and climatic impacts of their most powerful eruptions on this region. Figure 4 shows tree growth response to the eruption of Laki (VEI= 4+), which began in June 1783. The 1783 eruption of Laki in Iceland continued eight months, ejecting around 122 Mt of sulfur dioxide into the atmosphere and causing an unusually dry fog and drought in most of Europe (Thordarson and Self, 2003; Ogle et al., 2005). According to our data, no deviation in the annual tree growth was observed in 1783 - 1785 (see Figure 4). From Figure 4b, it is seen that the Loparskaya tree-ring record reveals a significant drop (by 50% relative to the previous year) in 1786, three years after the eruption of Laki volcano, therefore it can hardly be associated with this event. This conclusion is also confirmed by the absence of any depression after 1783 in the annual tree growth according to the Finnish data (Figure 4 a). Similar results demonstrating the absence of a decrease in the annual growth immediately after the Laki eruption were obtained in other studies (Sadler and Grattan, 1999; Thordarson and Self, 2003; Ogle et al., 2005). The analysis of climatic response to other powerful eruptions of Icelandic volcanoes (see the Table 1) revealed no changes. As it concerned the Laki eruption, that question had been considered in details in connection with a meteorological situation during the event (Grattan and Pyatt, 1999; Thordarson and Self, 2003; Sonnek et al., 2016). In accordance with these results, one can assume that a stable blocked high-pressure air pattern over Europe concentrated volcanic gases near the Earth’s surface and prevented them to spread into the Kola Peninsula.
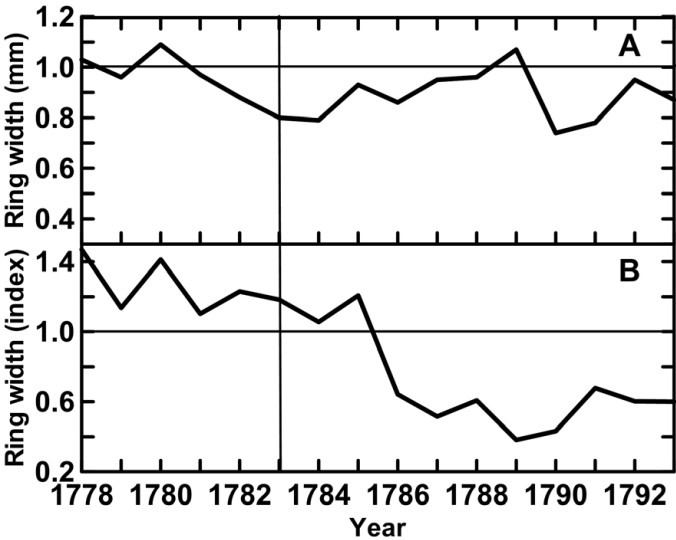
Figure 4 Tree-ring growth response to the volcanic eruption of Laki (VEI=4+) in Iceland (1783): (A) the Loparskaya (68.63 N, 33.25 E) pine tree-ring chronology, (B) the Finnish supra-long (~ 7500 years) pine tree-ring chronology (68-70º N; 20-30º E).
Figure 5 presents the composite response of tree growth in polar region obtained by the superposed epoch method for 19 volcanic eruptions listed in the Table 1. A significant suppression in tree growth is observed at both polar sites for seven years after the eruption with the subsequent recovery (see Figure 5). This result is consistent, in general, with the findings obtained earlier from dendroclimatic reconstructions of northern Eurasia (Vaganov and Shiyatov, 2005) and North America (Scuderi, 1990). Our analysis showed that the main contribution to the observed decrease in tree growth at both polar sites was made by low-latitude volcanic eruptions (see the Table 1).
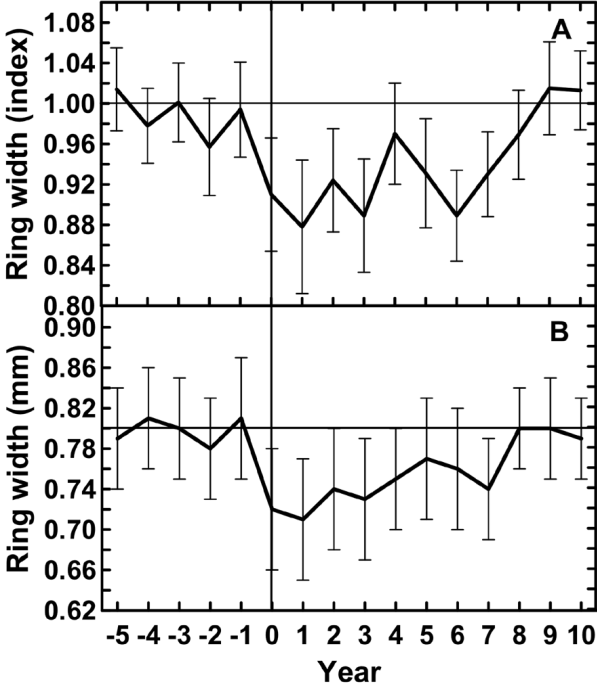
Figure 5 Response of polar tree-ring growth to the most powerful (VEI>4) volcanic eruptions since AD 1470 (see the Table) obtained by the superposed epoch method: (A) the Loparskaya (68.63 N, 33.25 E) pine tree-ring chronology, (B) the Finnish supra-long (~ 7500 years) pine tree-ring chronology (68- 70º N; 20-30º E). Standard errors are shown by vertical lines.
As was noted above, global climatic changes occurred under the composite influence of two main natural factors: powerful volcanic eruptions and solar activity. The main solar factors acting on climate and atmosphere are solar radiation (Lean et al., 1995; Haigh, 1996), cosmic rays and possibly, cosmic dust influencing the cloud cover of the atmosphere (Shumilov et al., 1996; Svensmark and Friis-Christensen, 1997; Kasatkina and Shumilov, 2005; Kasatkina et al., 2007). Volcanic factors act during powerful eruptions, while solar factors work continuously depending on cyclic intensity of solar activity. As can be seen from Fig. 6, the long variation in tree-ring indexes seems to demonstrate a certain similarity with the envelope of the 11-year maxima of sunspot numbers (r=0.31, p<0.05). The Sporer (1416 - 1534), Maunder (1645 - 1715), and Dalton (1801 - 1816) minima of solar activity are accompanied by cooling in the Kola Peninsula and tree growth depression. The significant tree growth depression and cooling from 1780 to 1830 coincide with the Dalton minimum of solar activity and most powerful volcanic eruption of Tambora in 1815 (see Figure 6).
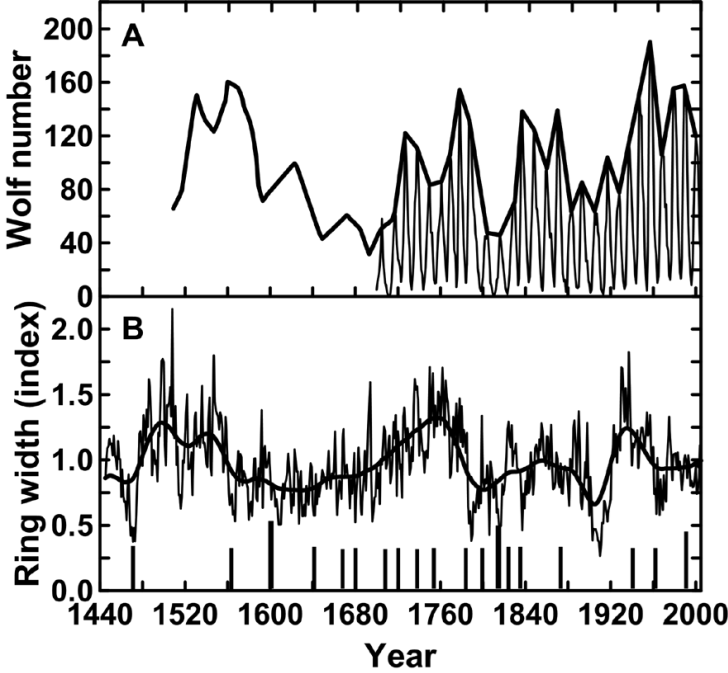
Figure 6 (A) Time series of sunspot number (1700-2005) (thin line) and their 11-year maximum envelope (1500-2005) (thick line). The sunspot numbers since the 1500 AD have been reconstructed on the polar aurora data (Shove, 1955). (B) The Loparskaya tree-ring width standard chronology of Pinus sylvestris L. (1445-2005) (thin line) and its smoothed 23-year moving average alpine. Most powerful volcanic eruptions (VEI>4) since AD 1470 are shown by vertical lines (see the Table).
For identification of solar cycles in tree-ring records and understanding their evolution in time frequency scale, we applied the Morlet-based continuous wavelet transform (CWT) and the wavelet coherence analysis (WTC). Figure 7 shows the wavelet power spectrum for the (a) Loparskaya tree-ring chronology, the (b) yearly sunspot number, and the (c) WTC between the tree rings and sunspot number. WTC is used as a localized correlation coefficient between two time series in time frequency space (Grinsted et al., 2004). Arrows indicate a phase relationship between the variables (see Figure 7c). The wavelet spectrum for the Loparskaya tree-ring chronology shows significant periodicity around 100 years (Gleissberg solar cycle), which is present all the time (see Figure 7a). The ~ 22 year solar cycle signal (Hale cycle) with less intensity intermittently appears between 1470-1620, 1680-1830, and 1920-1970 (see Figure 7a). The major ~ 11 year solar cycle signal (Schwabe cycle) is highly suppressed along the time interval, weakly appearing between 1500-1570, 1600-1750, and 1870-1900. The CWT for tree-ring data exhibits also a significant (or near the confidence level) power peak in the 2-7 year band, appearing intermittently along all the time interval. This periodicity corresponds to the second harmonic (5.5 year) of the Schwabe cycle, and, possibly, is also related to the North Atlantic Oscillation impact (Velasco and Mendoza, 2008). Figure 7c shows strong coherences in the 8-13 year band in phase between 1715 and 1730, and in anti phase for the time intervals of 1770-1840 and 1880-1920 (see Fig. 7c). The wavelet coherence also shows a statistically significant high power in the 20-30 year band over a period of 1770-1850 and 1920-2005 with a non-stationary phase relationship, the ~ 100 year is practically outside of the COI (see Fig. 7c).
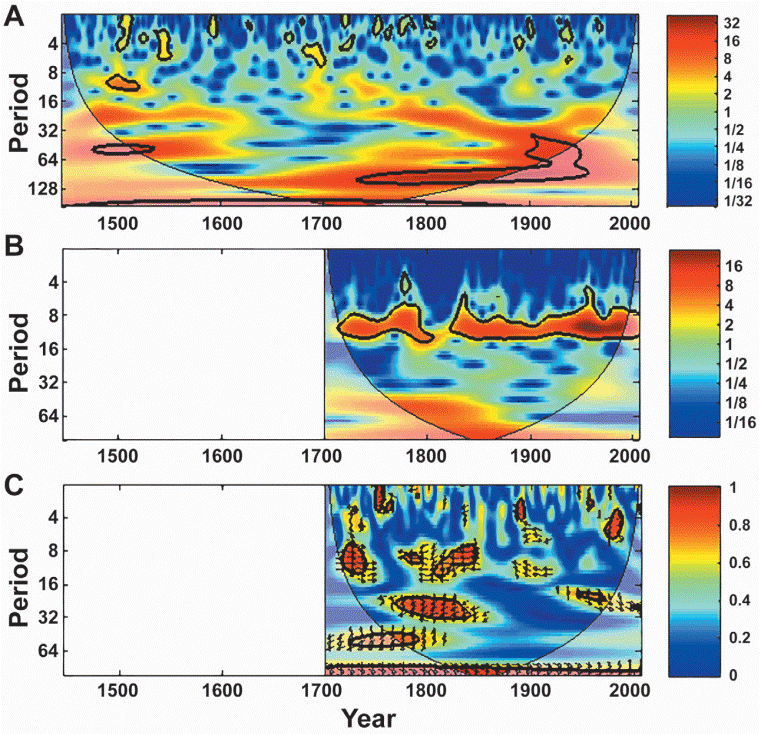
Figure 7 The continuous wavelet power spectrum of the standardized tree-ring index (A) and sunspot number (B) time series; (C) the wavelet coherency between tree-ring indices and sunspot numbers. The relative phase relationship is shown as arrows (with in-phase pointing right, anti-phase pointing left). The 5% significance level against red noise is shown as a thick contour.
In general, the wavelet coherence analysis between tree-ring data and sunspot numbers demonstrated a strong coherence in the 8-13 and 20-30 year bands indicating a possible link between solar activity and climate change on a regional scale. Earlier evidences of solar cycle signals were found in a lot of paleoclimatic proxy records from different sites (Baliunas et al., 1997; Kasatkina et al., 2007; Shumilov et al., 2007; Rigozo et al., 2002; Velasco and Mendoza, 2008; Wang and Zhang, 2011; Edvardsson et al., 2016; Sunkara and Tivari, 2016).
Conclusions
Our analysis of tree ring chronologies obtained for the Kola Peninsula and Finnish Lapland revealed the most significant (by 25% relative to the previous year) depression in tree growth after the 1600 eruption of Huaynaputina in Peru (VEI=6),which was the largest volcanic eruption in South America over the past 2000 years.
A superposed epoch analysis revealed a significant reduction in polar tree growth, which was observed for seven years after volcanic eruption with a subsequent recovery to its normal level.
The level of tree growth in polar region is affected by most powerful low-latitude volcanic eruptions. High-latitude Icelandic volcanoes have no significant impact on the climate of Kola Peninsula and Finnish Lapland.
The application of wavelet analysis for the Loparskaya tree ring chronology identified the existence of the main cycles of solar activity (11, 20-25, and ~ 100 years). The wavelet coherence analysis revealed a strong coherence in the 8-13 and 20-30 year bands indicating a possible link between solar activity and climate change on a regional scale.
Our results demonstrate the possibility of using polar tree-ring widths as indicators of solar and volcanic activity above the Arctic Circle.


 nueva página del texto (beta)


