Introduction
Popocatépetl volcano (19.02° N, 98.62° W, with an altitude of 5,452 m above sea level) is located just 70 km from downtown Mexico City within a densely populated region (~500,000 people living within 30 km from the crater, De la Cruz-Reyna and Tilling 2008). The ongoing eruptive activity of Popocatépetl volcano, which began in December 1994, has been characterized by a succession of emplacements and destruc tions of lava domes. Up to 2016, at least 38 episodes of lava dome formation and destruction by Vulcanian explosions have been identified (Gomez et al., 2016; Mendoza-Rosas et al., 2017). These explosions have resulted in 1) ash fall on the population around the volcano (up to and including Mexico City and Puebla); 2) volcanic ballistic projectiles, ejected at distances up to 4 km (Alatorre-Ibargüengoitia et al., 2012); and 3) pyroclastic flow deposits some of which have triggered lahars on the flanks of the volcano (Capra et al., 2004; Macías and Siebe, 2005; Julio-Miranda et al., 2005, 2008). This ongoing eruption has understandably generated great concern in the population surrounding the volcano and has attracted the attention of volcanologists worldwide (De la Cruz-Reyna et al., 2017).
A number of studies about Popocatépetl have been published including its past eruptive activity (e.g. Boudal and Robin, 1989; Siebe et al., 1996; Capra et al., 2004; Siebe and Macias, 2006; Mendoza-Rosas and De la Cruz-Reyna, 2008; Arana-Salinas et al., 2010; Sosa-Ceballos et al., 2012; Martin Del Pozzo et al., 2016; Siebe et al., 2017), the monitoring of the current eruption (e.g. Arciniega-Ceballos et al., 2000, 2008; Delgado-Granado et al., 2001; Martin Del Pozzo et al., 2008, 2012; Armienta et al., 2002, 2008, 2010; Wright et al., 2002; Espíndola et al., 2004; Cabral et al., 2008; Novelo-Casanova and Valdes-González, 2008; Arámbula-Mendoza et al., 2010), hazard maps (Macías et al., 1995; CENAPRED, 2012) and scientific and public responses to the ongoing volcanic crisis (e.g. De la Cruz-Reyna and Tilling, 2008; De la Cruz-Reyna et al., 2017).
A comprehensive understanding of pre-and syneruptive processes is, however, still required in order to interpret and evaluate adequately the data from volcanic monitoring. For this, we propose that the scientific investigation of volcanic eruptions no longer depends solely on field data, as direct field observations of eruptive processes are, and likely will always be, restricted in terms of accessibility and safety. Instead, laboratory experiments and theoretical models derived from them are essential assets for our understanding of volcanic processes (Kavanagh et al., 2018). For these reasons, laboratory experiments are becoming important in volcanic research and are increasingly used for the following primary purposes: 1) to explore novel or inaccessible phenomena; 2) to provide systematic observations of the dynamics of volcanic processes; 3) to determine the values of key input parameters for numerical models; and 4) to test hypothesis and validate theoretical and numerical models (Mader et al., 2004). For a better understanding of volcanic eruptions and their forecasting, such results of experimental studies must then be integrated into a complete analysis of information sources concerning the eruptive system including field observations, and eruptive models such that all available information is used.
Here, we performed experiments in a so-called "fragmentation bomb", a shock-tube apparatus originally designed by Alidibirov and Dingwell (1996a,b) and subsequently modified to investigate different aspects of magmatic fragmentation of natural samples upon rapid decompression under controlled conditions (e.g. Spieler et al., 2004; Mueller et al, 2005; Kueppers et al., 2006a; Scheu et al., 2006; Alatorre-Ibargüengoitia et al., 2011; Kremers et al, 2010; Richard et al, 2013; Cigala et al, 2017). This setup mimics Vulcanian eruptions and provides a unique opportunity for the investigation of the fragmentation process, its elasto-accoustic behavior and the dynamics of fragmentation process and the resulting pyroclasts. Below, we present fragmentation experiments using samples from Popocatépetl and provide quantitative data on fragmentation threshold, fragmentation and ejection speeds, and fragmentation efficiency. In addition, we analyze, in time and frequency domains, the microsignals associated with the elasto-acoustic response of the overall fragmentation processes. Thereby, this experimental approach contributes to the understanding of volcanic conduit conditions during fragmentation pro cess as well as the interpretation of field-based seismograms.
Method
Here, the rapid decompression experiments with samples from Popocatépetl were performed using a shock-tube apparatus consisting of two main parts (Figure 1): 1) an autoclave (corresponding to a volcanic conduit), into which cylindrical samples drilled from volcanic rocks were loaded; and 2) a large volume (collection) tank at atmospheric conditions, in which the fragmented sample was contained. Pressurization of the autoclave and subsequent depressurization was regulated by a system of up to three scored diaphragms that open at a precisely defined pressure differential. The sample and autoclave were slowly pressurized with argon gas to the desired experimental pressure. Depressurization of the autoclave is triggered by controlled failure of the uppermost diaphragm, followed by the immediate failure of the other diaphragms, which induces a rarefaction wave that travels through the sample. If the resulting pressure differential is sufficient, the sample fragments brittlely layer-by-layer (Alidibirov and Dingwell, 2000; Scheu et al., 2008; Fowler et al., 2010; Fowler and Scheu, 2016) and the particles are ejected into the collection tank. We performed fragmentation experiments both at magmatic temperature (heated with an external furnace up to 850 °C) and at room temperature (~ 22 °C) using different autoclaves and piezoelectric sensors to record the elastic response of the system, across the full range of experimental conditions (Figure 1). In order to prevent the sample from being ejected like a projectile, it was attached to a sample holder and tightly inserted in the autoclave.
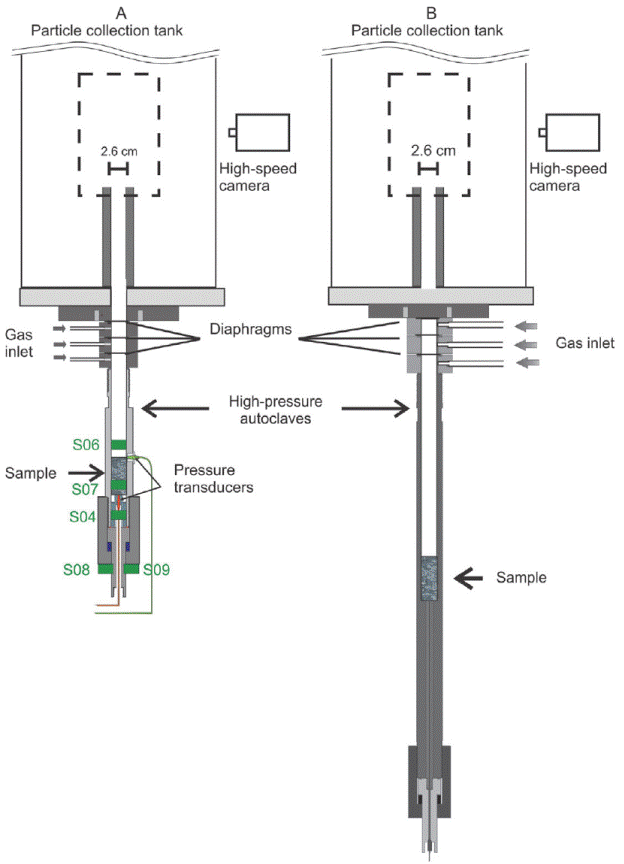
Figure 1 The experimental setup of the fragmentation apparatus. The sample (6 cm length, 2.5 cm diameter) is placed in the high-pressure autoclave. A set of diaphragms allows pressurization of the sample using argon gas. After the disruption of the diaphragms, the particles are ejected into the collection tank at atmospheric condi tions. The dashed box indicates the area observed with the high-speed camera (ca. 14 cm high). In the experi ments at room temperature (left) two dynamic pressure transducers located directly above and below the sample record the pressure drop during fragmentation. S05, S06 and S07 indicate the position of piezoelectric sensors. In the experiments at 850 °C the autoclave (right) is heated with an external furnace.
Where the applied pressure differential was not high enough to fragment the sample entirely, the experiment was successively repeated at a higher pressure using cylinders drilled from the same rock sample, until complete fragmentation was achieved. The minimum pressure differential leading to complete fragmentation is defined as the fragmentation threshold. This threshold was investigated for samples with different porosities (at 850 °C and 22 °C).
In order to investigate the fragmentation efficiency, we waited at least 2 hours after performing each experiment to allow fine ash particle settling according to Stokes' Law (Kueppers et al., 2006a). Then we rinsed the collection tank with desalinated water to recover the particles. Applying this technique, we were able to recover more than 99% of the initial sample mass. Dry sieving and weighing was performed at half-φ steps (φ =log2d, with d =particle diameter in mm).
A high-speed camera (Phantom V710 and Photron SA-5) at 10,000- 20,000 frames per second was used to film the process and measure the ejection velocities of the gas-particle mix ture. In experiments at room temperature, two dynamic pressure transducers (601H, Kistler Instrumente AG, Switzerland), located directly above and below the sample, were used to measure the speed of the fragmentation front traveling into the sample by comparing the corresponding pressure curves recorded during the fragmentation process (Scheu et al., 2006).
The elastic behavior related to the fragmen tation experiments was recorded using five high-dynamic piezoelectric sensors (Arciniega-Ceballos et al., 2014, 2015), coupled on the outer surface of the steel walls and bottom of the autoclave (Figure 1A). These sensors produce an output voltage proportional to the applied compressive or tensile stress or vibration induced by an excitation mechanism. In our experiments, decompression is the excitation mechanism and the sensors capture the direction of motion and the stresses exerted on the system during the fragmentation process. The sensors frequency response covers the entire frequency range of the apparatus at the pressure applied (Arciniega-Ceballos et al., 2014).
Samples
We collected several samples from explosive events of Popocatépetl during the 1994-present (2017) eruptive activity. In particular, we selected pumice fragments from the pyroclastic flow deposit produced on January 22, 2001 collected at 2.4-2.7 km from the crater (Smithsonian Institution, 2000) and dense ba llistic blocks from a crater dome, which were ejected ballistically during the explosive events of February 2003 that reached a maximum distance of 2.6 km from the crater (Smithsonian Institution, 2003). We measured the density and porosity of all the samples by helium pycnometry (Accupyc 1330, Micrometrics, USA). The porosity distributions of the collected pumice and ballistic blocks corresponding to these events are presented in Figure 2. The bulk rock composition measured by X-ray fluorescence spectroscopy of both kinds of samples, the 2001 pumice and 2003 ballistic blocks, ranges from andesite to dacite (SiO2 of 61-65%), similar to the compositions reported for other explosive events of Popocatépetl during the 1994-present eruption (Straub and Martin-Del Pozzo, 2001; Martín del Pozzo et al., 2003; Witter et al., 2005).
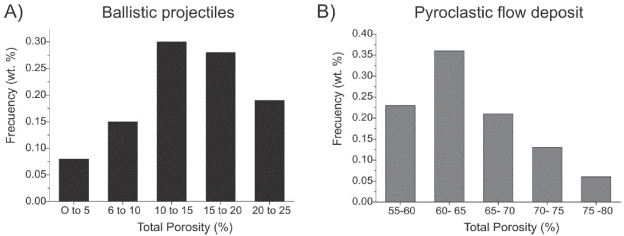
Figure 2 Porosity distribution of the collected samples corresponding to: A) volcanic dense blocks ejected as ballistic projectiles in February 2003; and B) pumice fragments in the pyroclastic flow deposit 2001.
Additionally, we also used samples consis ting of andesitic pink pumice fragments corres ponding to the Plinian eruption ca. 1200 yr. B.P. (Siebe and Macías, 2006) and dense andesitic samples from the Nealticán lava flow from a fissure eruption ca. 2100 yr. B.P. (Siebe and Macías, 2006). The characteristics of all the samples used in the fragmentation experiments are presented in Table 1. In general, phenocrysts are often in contact with the vesicles and neither phenocrysts nor microlites within the groundmass show a clear preferred orientation in the samples. Only the lava samples present relatively spherical vesicles. We did not ob serve a preferred orientation of bubbles in the others. Thin sections reveal textural differences in the groundmass of the dense ballistic blocks between the andesitic rocks with microcrystalline groundmass and the dacitic rocks with glassy groundmass (Figure 3).
Table 1 Characteristics of the rock samples considered in this study that where generated during different eruptive events of Popocatépetl and the experiments in which they were used.
| Name | DBm | DBg | Pu | La | PP |
|---|---|---|---|---|---|
| Rock type | Dense ballistic blocks | Dense ballistic blocks | Pumice | Lava | Pink Pumice |
| Eruption | February 2003 | February 2003 | January 22, 2001 | Nealticán lava flow ca. 2100 yr. B.P. | Plinian eruption ca. 1200 yr. B.P. |
| SiO2 (%) | 61-62 | 65 | 61-63 | 61- 62 | 61-62 |
| Connected porosity (%) | 3-21 | 14-15 | 56-73 | 14-18 | 42-64 |
| Isolated porosity (%) | 1.0-1.5 | 1.0-1.5 | 1.5-3.0 | 1.0 | 2.5-3.5 |
| Matrix density (kg/m3) | 2670-2680 | 2600 | 2400-2500 | 2700 | 2330-2490 |
| Phenocryst content (vol. %, vesicle-free basis) and size (mm) | 25-45 (<4 mm) | 20-40(<4 mm) | 30-50 (<4 mm) | 10-20 (< 3mm) | 20-30 (< 3mm) |
| Phenocrysts | Plagioclase, pyroxene, olivine, amphibole, Fe-Ti oxides | Plagioclase, pyroxene, amphibole, and Fe-Ti oxides | Plagioclase, pyroxene, olivine, Fe-Ti oxides | Plagioclase, pyroxene, and olivine | Plagioclase, pyroxene and Fe-Ti oxides |
| Groundmass | Microcrystalline | Glassy | Glassy | Glassy | Glassy |
| Experiments used | Threshold, Efficiency | Threshold, Efficiency | Threshold fragmentation and ejection speed | Threshold, fragmentation | Threshold, and ejection speed, Efficiency |
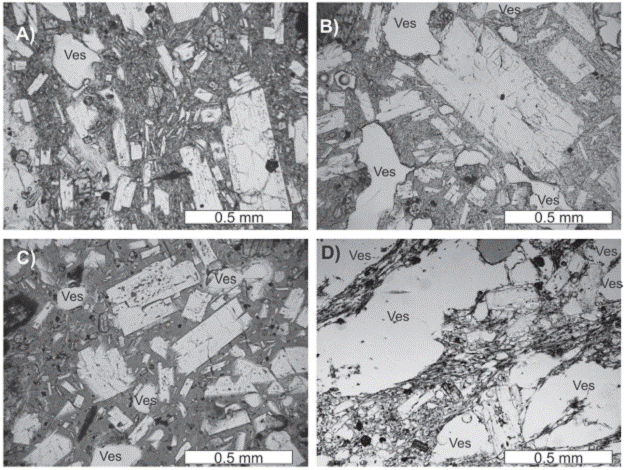
Figure 3 Photomicrographs of petrographic thin sections of Popocatépetl samples generated during the present eruptive period used in this study. A) and B) Dense andesite with microcrystalline groundmass (DBg) and connected porosity of 14% and 20%, respectively; C) Dense dacite with glassy groundmass (DBm) and connected porosity of 14%; D) Pumice fragment (Pu) with connected porosity of 60% corresponding to the 2001 pyroclastic flow deposit.
Experimental results and analysis
Fragmentation threshold
The measured fragmentation threshold corres ponding to all samples from Popocatépetl considered in this study is presented in Figure 4 including experiments at 850 °C and 22 °C. This Figure shows that the threshold values obtained for Popocatépetl follow a very similar trend as a function of the connected porosity as the values reported for samples corresponding to different volcanoes with a great range of chemical composition, crystallinity and bubble size distribution that were generated during different types of eruptions (Spieler et al., 2004). It is worth noting that isolated pores are not pressurized during the experiments, and therefore, their contribution to the energy from gas expansion is negligible.
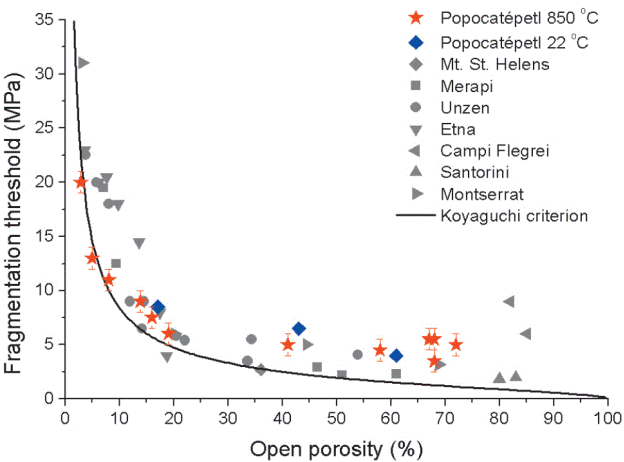
Figure 4 Fragmentation threshold measured for the different types of samples from Popocatépetl volcano at 850 °C and room temperature during rapid decompression experiments. The line corre sponds to the fragmentation criterion (Eq. 1) proposed by Koyaguchi et al. (2008), as suming that the effective ten sile strength of the material is 1.5 MPa. The data at 850 °C for DBm, DBg and Pu samples correspond to the data pre sented by Alatorre-Ibargüen-goitia et al. (2010). Experi mental data corresponding to samples from a variety of volcanoes from Spieler et al. (2004) are also shown.
A comparison of our threshold data mea sured at room temperature versus the thre shold values determined at 850 °C revealed that the fragmentation threshold at low and high temperature is similar. For this reason, the results are believed to be applicable to fragmentation over a wide range of tempera tures from room temperature up to eruptive temperature, as long as the fragmentation re mains in the brittle domain.
Our threshold data can be approximated with the theoretical fragmentation criterion of Koyaguchi et al. (2008) which can be expressed as follows:
where P th is the fragmentation threshold, φ the porosity and S 3 is the effective strength. We found that an effective tensile strength of S 3 = 1.5 MPa in Eq. (1) minimize the mean square error (0.89) for the data corresponding to Popocatépetl samples at 850°C (Figure 4). The higher porosity samples of Popocatépetl cannot be adequately fitted by this criterion probably because of their relatively high permeability which significantly reduces the pressure differential in and below a fragmentation layer as shown by Mueller et al. (2005, 2008). These authors found that the fragmentation behavior is influenced by permeability if this parameter lies above a critical value (~10-12 m2).
Fragmentation and ejection speeds
We performed experiments with three set of samples with different porosities (La with φ = 17%, PP with φ = 43 % and 61 %). In each experiment performed at room temperature, the fragmentation speed was calculated from the distance between the dynamic pressure transducers and the time delay between the pressure drops of the signals (Scheu et al., 2006). The results are presented in Figure 5A relative to the applied pressure (P o ). The relationship between the fragmentation speed and the applied pressure can be fitted empirically using a logarithmic expression (Scheu et al., 2006) that can be defined as follows (Alatorre-Ibargüengoitia et al., 2011):
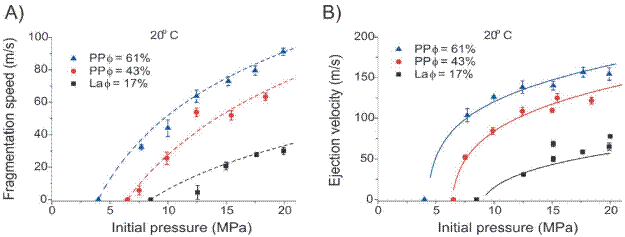
Figure 5 A) Fragmentation speed vs pressure at room temperature with Popocatépetl samples. Dashed lines represent the empirical fitting with Eq. (2) considering kp= 38.9 m/s, kp = 64.2 m/s and kp = 56.5 m/s for samples with 17%, 43% and 61% porosity, respectively. Error bars of U data indicate the uncertainties in the determination of the fragmentation onset at the pressure drop curves. B) Ejection velocity of the front of the gas-particle mixture, calculated as the average of the velocities of several particles traveling at the front. Error bars represent the standard deviations. The velocities at 0 m/s indicate the fragmentation threshold of the samples at room temperature. The data in both plots for samples with 17% and 61% porosity correspond to the data presented by Alatorre-Ibargüengoitia et al. (2011). Solid lines correspond to the theoretical calculations for vf using Eq. (3). For the calculations, we considered R =207.8 JKg-1K-1 and Cv =312 JKg-1K-1 for argon gas and Cs = 1400 JKg-1K-1 (calculated with CONFLOW, Mastin and Ghiorso, 2000 ). The final pressure (Pfi) was estimated in the experiments according to the method described by Alatorre-Ibargüengoitia et al. (2010).
where k p is a constant with velocity units that depends on the porosity of the sample. The fragmentation speed measured from Popocatépetl's samples are comparable with the values measured from samples of other volcanoes (Scheu et al., 2006; Richard et al.,2013).
The velocity of the front of the gas-particle mixture was measured via high-speed videography by considering the average of the velocities of several particles traveling at this front (Alatorre-Ibargüengoitia et al., 2011). We observed that the ejection velocity of the gas-particle mixture increases non-linearly with applied pressure and it is higher than the fragmentation speed, as can be observed in Figure 5B. This figure also illustrates that the measured ejection velocities of the front of the gas-particle mixture is consistent with the theoretical model proposed by Alatorre-Ibargüengoitia et al. (2011) based on a 1-D shock-tube theory considering the conservation laws across the fragmentation front.
That model states that the fragmentation speed determines the initial conditions for the expansion of the gas-particle mixture considering the following assumptions (Koyaguchi and Mitani, 2005; Koyaguchi et al., 2008): (1) mass, momentum and energy are conserved across the fragmentation front; (2) the fragmentation front propagates at a constant speed; (3) the dynamics of the gas-particle mixture is described by the shock-tube theory for inviscid flow; (4) the gas-particle mixture behaves as a "pseudo-gas"; and (5) only particles smaller than a certain size (depending on the expansion time) remain in thermal equilibrium with the gas (Woods, 1995). From these assumptions, the ejection velocity of the front of the gas-particle mixture (v f ) can be expressed as follows (Alatorre-Ibargüengoitia et al., 2011):
where the subscripts "o" and "_" refer to parameters at the initial conditions and at the gas-particle mixture region just after fragmentation, respectively. T is temperature, R is the specific gas constant, P is pressure, n is the mass fraction of gas, γ is the specific heat capacity ratio of the mixture considering only the fraction of particles in thermal equilibrium with gas, a_ is the sound speed in the mixture after fragmentation and P fi is the final pressure. These parameters can be calculated according to the following expressions (Alatorre-Ibargüengoitia et al., 2011):
where ρ and ρ_ are the density of the particles and the mixture after fragmentation, respectively, C v is the specific heat capacity of the gas at constant volume, c s is the magma specific heat capacity and f is the particles remain in thermal equilibrium with the gas during the expansion phase.
The time for thermal equilibrium between particles and gas scales as πd 2 /k d where d is the diameter of the particles and k d is the thermal diffusion coefficient, with typical value 10-6 m2/s for magma (Woods, 1995). In our experiments, the duration of fragmentation and ejection of the gas-particle mixture up to the position observed with the high-speed camera is in the order of 5 ms, 10 ms and 20 ms for the experiments with 61%, 43% and 17% porosity, respectively. Accordingly, the fraction f of particles in thermal equilibrium with the gas was estimated by the fraction of particles smaller than ~0.09 mm, ~0.125 mm and ~0.18 mm, respectively. By sieving the collected particles, we obtained the f values of 2 ± 0.5 %, 3 ± 0.5 % and 5 ± 0.5 % respectively.
Due to experimental constraints and the dynamic pressure transducer's temperature range, it is not possible to measure directly the fragmentation speed at magmatic tempe ratures using the same procedure as in the experiments up to moderate temperature. For this reason, the influence of the temperature on the fragmentation speed had not been investigated systematically. However, using the model of Alatorre-Ibargüengoitia et al. (2011) it is possible to estimate fragmentation speed values from the ejection velocity of the gas-particle mixture in experiments performed at magmatic temperatures. Figure 6a shows the measured ejection velocity of the front of the gas-particle mixture in experiments performed at 850°C with the same sets of samples as the experiments at room temperature (La with φ=16%, and PP with φ=41% and 58%). The corresponding fragmentation speed values estimated from the measured ejection velocities with the model of Alatorre-Ibargüengoitia et al. (2011) are presented in Figure 6b. There is also a logarithmic relationship between the estimated fragmentation speed and the applied pressure (Eq. 2). The values estimated for the PP samples with φ=41% and 58% are similar at 850°C and at room temperature, whereas the estimated values at 850°C corresponding to the La samples are considerable higher with respect to the measure data at room temperature (see Figure 5a).
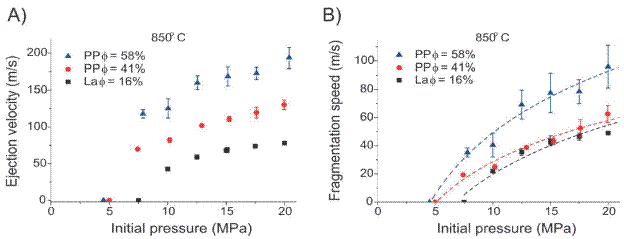
Figure 6 A) Ejection velocity of the front of the gas-particle mixture at 850°C, calculated as the average of the velocities of several particles traveling at the front. The error bars represent the standard deviations. The veloci ties at 0 m/s indicate the fragmentation threshold of the samples at 850°C. B) Fragmentation speed at 850°C estimated from the ejection velocity data using the model of Alatorre-Ibargüengoitia et al. (2011) considering the values mentioned in the caption of Figure 5. The error bars indicate the uncertainties in the determination of the fragmentation speed due to the uncertainties associated with the ejection velocities. Dashed lines represent the empirical fitting with Eq. (2) considering kp= 50.5 m/s, kp = 42.4 m/s and kp = 63.0 m/s for samples with 17%, 43% and 61% porosity, respectively.
It should be noted that the estimated values presented in Figure 6b depend on the fraction f of particles in thermal equilibrium with the gas. For the hot experiments, we made the same thermal consideration as for the cold experiments, and estimated f by the fraction of particles smaller than ~0.09 mm, ~0.125 mm and ~0.18 mm, respectively. By sieving the collected particles, we obtained that the corresponding f values are 1 ± 1 %, 1 ± 0.5 % and 5 ± 0.5 % for the experiments with 61%, 43% and 17% porosity, respectively. This topic, however, is still poorly understood. The estimated fragmentation speeds could change up to 30% depending on the considered value of f in Eq. (5). If a higher value of f is considered, the estimated fragmentation speed could be reduced and vice versa. Con sidering the limitations, the data presented in Figure 6b represent, to our knowledge, the first experimental estimation of fragmentation speed values at magmatic temperatures.
Fragmentation efficiency
We analyzed the grain size distribution of the particles produced in experiments at 850°C with four sets of samples with different porosities from Popocatépetl (DBm with φ=14% and 20%; DBg with φ=14%; and PP with φ=58%) and at different applied pressures. In general, we observed: 1) unimodal non-Gaussian parti cle size distribution; 2) decreasing grain-size with increasing applied pressure; and 3) finer particles in the experiments with more porous samples (Figure 7).
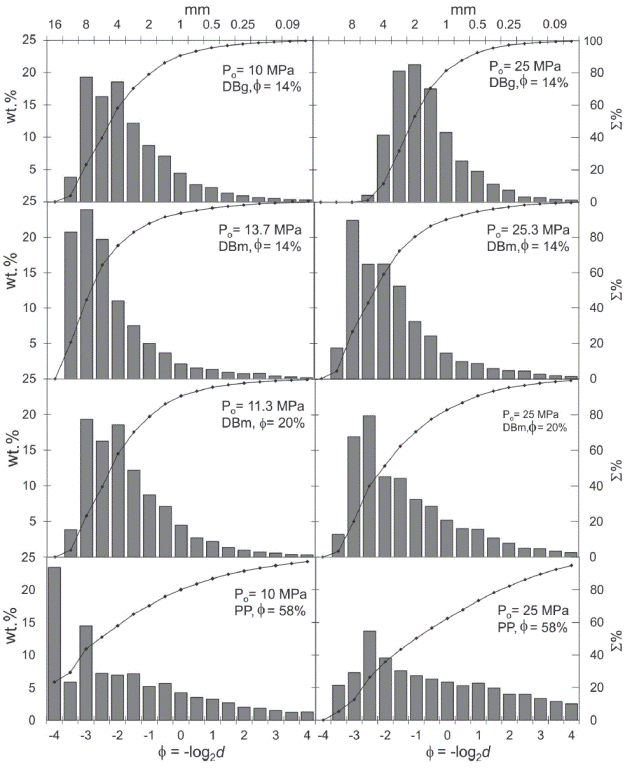
Figure 7 Examples of grain-size distribution plots showing the relation of wt.% and par ticle size of fragmentation experiments at 850 °C for the four different sets of samples (DBg with φ = 14%; DBm with φ = 14% and 20%; PP with φ = 58%) at two diffe rent pressures. The grain si ze decreases to the right in each plot. The solid line with points shows the cumulative curve of the weight fractions (right axis). The plots in the right column represent expe riments at higher pressures and clearly show a reduction of the grain-size of the parti cles with respect to the plots in the left column in all the cases.
Fractal fragmentation theory can be used to quantify the grain-size distribution of the experimentally generated particles (e.g. Korvin, 1992; Turcotte, 1997; Kueppers et al., 2006b; Perugini and Kueppers, 2012). According to this theory, the total number of particles with linear dimension greater than a given size d can be expressed as:
where D f is the fragmentation fractal dimension and C is a constant. A similar relationship relating mass measurements and sieve diame ters can be expressed as follows (Turcotte, 1997):
where M (<d s ) is the cumulative mass of particles smaller than the sieve size d s , M t is the total mass of particles and ν is a scaling exponent. It can be shown that (Turcotte, 1997):
This equation indicates that the fractal dimension of fragmentation (D f ) can be calculated using the exponent v from the mass-based approach, which is directly applicable to sieving data. Taking the logarithm of both sides of Eq. (8) and Eq. (10) yield linear rela tionships between Log [N (>d)] and Log (d), and between Log [M (<d s )] and Log (d s ), where Df and ν are the slopes of the respective plots. Figure 8 shows some representative examples that clearly display a power-law behavior indicated by a very good linear trend (R2> 0.99 for all cases) in the Log [M (<d s )] vs. Log (d s ) plots. These linear trends extend over more than one order of magnitude showing that the fragmentation process can be analyzed in terms of the fractal fragmentation theory. The scaling exponent ν was estimated for all the experiments from the slope of the linear fitting of these plots.
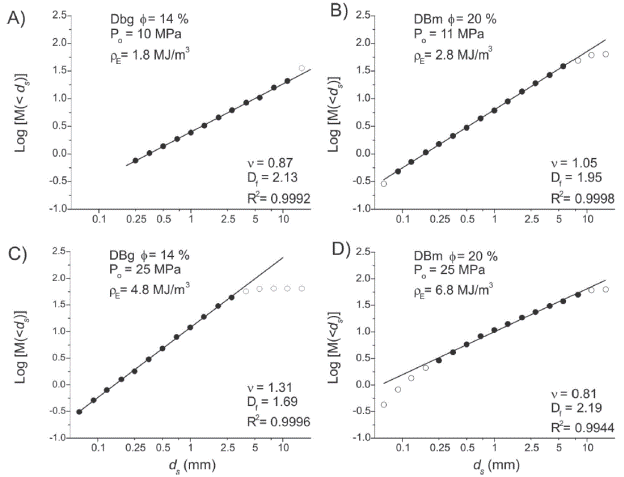
Figure 8 Representative log-log plots of particle size for Popocatépetl sample DBg with φ=14% (A-C, left column) and DBm with φ=20% (B-D, right column). Filled circles denote the data used for the linear fitting, whereas the open circles indicate the data that were not considered. The value of ν in each plot correspond to the slope of the linear fitting, whereas Df was calculated with Eq. (10). The experimental pressure (and the corresponding energy density) is higher in the plots at the bottom. Note logarithmic scale in the horizontal axis and that the scale is the same in all the plots.
The values of D f (and ν) depend on the energy of the compressed gas stored in the pores at the moment of fragmentation in a unit volume of the sample (ρ E ). This energy density corresponds to the adiabatic work that is done by the gas when the initial pressure P o decreases to the ambient pressure P a and it is given by (Alidibirov, 1994; Alatorre-Ibargüengoitia et al., 2010):
Figure 9 shows that the fractal dimension D f varies with the energy density ρ E in different ways depending on the rock sample: dense blocks DBm with φ=20% (Figure 3B) and pumice fragments PP with φ=58% (Figure 3D) show a linear increase of D f as a function of ρE. This trend was also observed by Perugini and Kueppers (2012) with Popocatépetl lava samples with φ=20%. In the experiments performed with dense blocks DBm with φ=14% and with a microcrystalline matrix (Figure 3A) a clear trend is not produced, whereas the samples with a glassy matrix DBg with φ=14% (Figure 3C) show that D f decreases linearly as ρ E increases. It is worth noting that in the four sets of samples the same trend showed in Figure 9 is observed if the fractal dimension is plotted against the PEF= PJ>V c l (here V cy¡ is the volume of the sample) as defined by Perugini and Kueppers (2012) instead of the energy density given by Eq. (11).
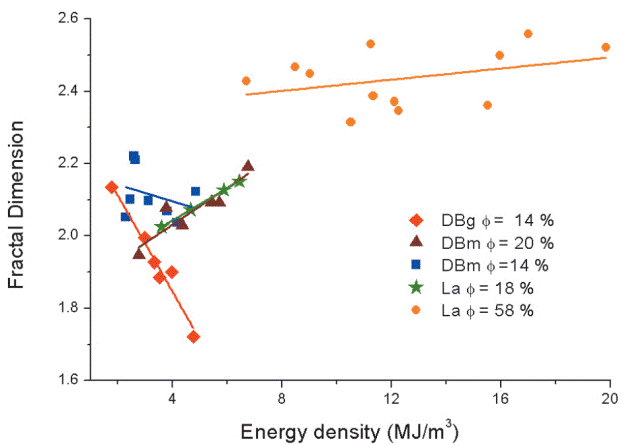
Figure 9 Fractal dimension as a function of energy density (Eq. 11) in fragmentation experiments with Popocatépetl samples. Some sets of samples show an increase in the fractal dimension with the energy density (DBm with φ = 20%, PP with φ=58% and lava samples with φ=18%), whereas DBm with φ = 14% show no clear trend and DBg with φ = 14% show that Df decreases linearly as ρE increases. Data corresponding to lava samples are from Perugini and Kueppers (2012).
The trend observed with the samples DBg with φ=14% is interesting. As observed in Figure 7, the grain size of the particles does decrease with increasing pressure, for instance the cumulative fraction of particles > 4 mm is significantly reduced at 25 MPa with respect to the experiment performed at 10 MPa. However, the range of sizes at which the fractal behavior applies decreases systematically: from d s < 11.2 mm in the experiment at 10 MPa, to only particles with d s < 2.8 mm in the experiment at 25 MPa (Figure 8). The difference between the trend observed for DBg and DBm samples can be related to the groundmass texture, which is glassy in the first case and microcrystalline in the second case. Further systematic experiments and analysis will be necessary to investigate the influence of both the groundmass texture and composition on the fractal behavior of the experimentally generated particles.
We further investigated the influence of secondary processes on the fractal dimension by using the products of the same sample at 850 °C in the following order: First, we performed fragmentation experiments with three cy lindrical core samples with different porosity. Second, we performed rapid decompression experiments on the collected particles of each sample from the fragmentation experiments (without mixing them). Third, we repeated the decompression experiments with the collected particles from the previous decompression step. We analyzed the resulting grain-size distribution after each experiment and observed than all the cases display a power-law behavior (i.e. a very good linear fit in the Log [M (< d s )] vs. Log(d s ) plot). Figure 10 shows that the fractal dimension D f increases systematic after each step for the three samples, which may reflect secondary fragmentation processes of the particles in the repeated experiments.
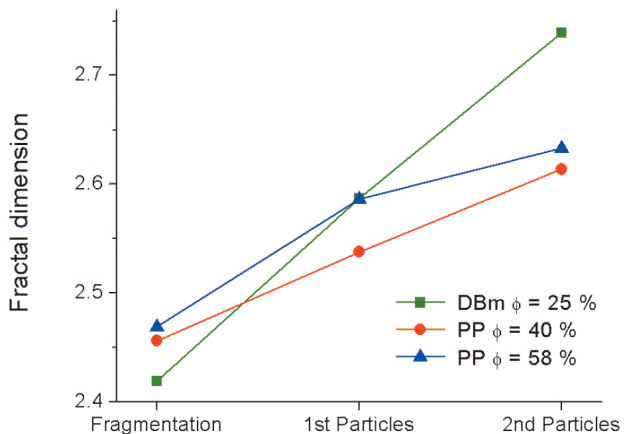
Figure 10 Fractal dimension of the grain-size distribution observed in the fragmentation of cylindrical core samples and rapid decompression experiments at 850 °C with the resulting particles with samples with three different porosities. The fractal dimension increase after a repeated experiment, reflecting possible secondary fragmentation of the particles after each experiment.
Microsignals
In this section, we analyze the microsignals resulting from the elastic energy released during decompression and fragmentation, which tra vels through the sample and throughout the steel autoclave. From these signals, some information of the medium and of the behavior of the system can be deduced considering the distinct phases of the experiments, including pressurization, decompression, fragmentation and ejection of the gas-particle mixture (Arciniega-Ceballos et al., 2014; 2015). In previous studies, we analyzed the resonance characteristics of the fragmentation bomb and we showed that the resonance modes of the collection tank do not affect the signals of the high pressure autoclave (Arciniega-Ceballos et al., 2014). The core samples used in these experiments were from La with φ=15 % and PP with φ between 40 and 51% (Table 1), all performed at room temperature and pressures between 8 and 13 MPa, using one and two diaphragms. The signals recorded with sensors named S4, S6 and S7 correspond with the radial component of motion: S7 coincides with the position of the sample in the autoclave, S4 is below the sample and S6 covers the cavity above the sample. The sensors S8 and S9 located at the bottom of the autoclave correspond to the vertical component of motion (Figure 1A).
Figures 11A and 11B show the superposition of raw signals recorded at sensors S8 and S7, respectively, for three experiments with only one diaphragm (which produces a simpler signal than with two diaphragms), pressures between 8 and 9 MPa and samples with porosities between 39 and 45%. Observe that the signals are coherent (marked with light blue in Figures 11A and 11B), especially at low frequencies and in the vertical component (Figure 11B). This is clearer comparing the amplitude spectra of different experiments (shown in Figures 12A and 12B). Note that the dominant frequencies are below 300 Hz; many spectral picks and maximum amplitudes coincide, even for experiments performed with two diaphragms. On the other hand, spectral pick coincidences for frequencies above 400 Hz are random (Figures 12A and 12B). These spectral amplitudes are at least one half smaller than the amplitudes of lower frequencies amplitudes. The similarities bet ween the signals and their spectra at low frequencies indicate that these experiments share a common mechanism, which indeed they do. Thereby, the processes triggered by decompression causing the fragmentation of the samples might be correlated with the high frequency content.
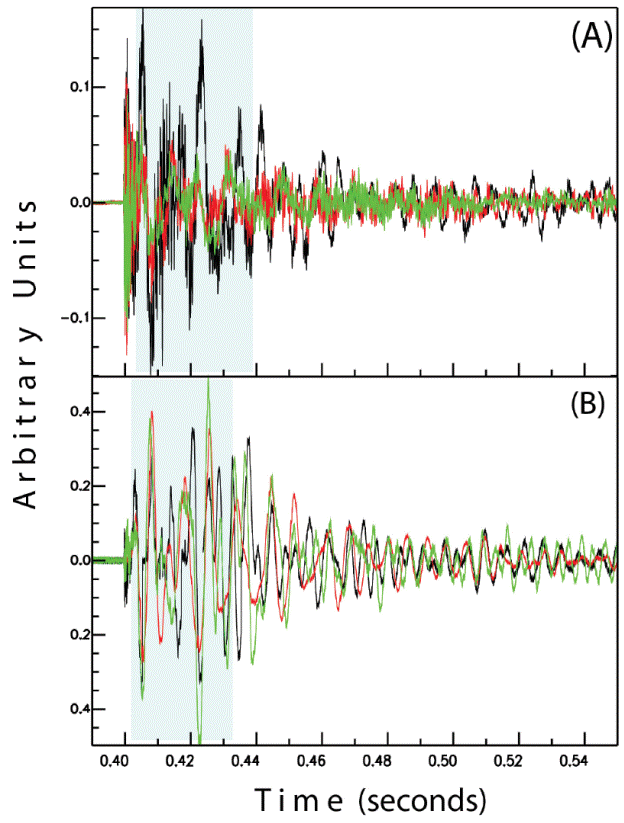
Figure 11 Superimposed time series of three different fragmentation experiments performed at 9, 8, and 8.2 MPa, indicated in black, red and green, respectively. A) Radial sensor S7. B) Vertical sensor S8. These experiments were performed using PP samples and only one diaphragm. Shad ow blue areas indicate sections with wave forms coincidence. For better comparison, plots are at their original scale; x-axis is in seconds and y-axis in arbitrary units.
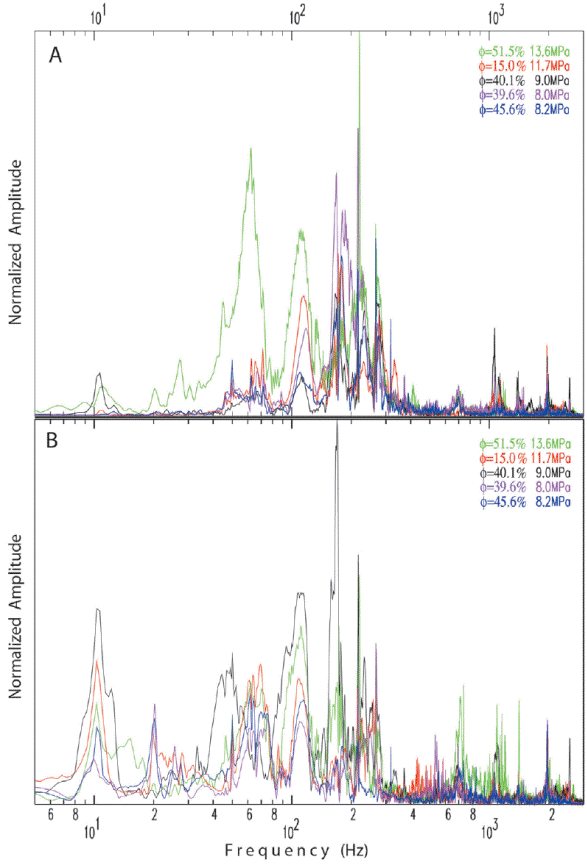
Figure 12 Amplitude spectra of five fragmentation experiments; (A) signals recorded at the bottom of the autoclave, sensor S8. B) Signals recorded at the wall of the autoclave, sensor S7. Porosity and pressure are indicated at the right upper corner of each panel with the same color as the corresponding spectrum. For comparison, each spectrum is normalized with respect to its maximum and plotted vs frequency in logarithm scale. Spectra in red and green correspond to experiments performed with two diaphragms, whereas the rest of the colors indicate only one diaphragm. For details about the samples see Table 1. Common picks at frequencies < 300 Hz reflect the common mechanism, while higher frequencies are associated with sample characteristics and fragmentation process.
To differentiate the distribution of the elastic energy, in frequency and time, and correlated it with the occurrence of the phy sical processes inside the autoclave, we filte red the records conserving their waveform characteristics (Figures 13A and 13B) and calculate spectrograms for different samples (Figures 14A and 14B). Figures 13A and 13B display vertical and radial signals filtered in three frequency bands: low frequencies (< 800 Hz), middle frequencies (between 800 and 2000 Hz) and high frequencies (> 2000 Hz). Different events might be extracted from each frequency band: diaphragm(s) aperture, gas expansion, layer by layer fragmentation of the sample, and ejecta of the gas-particles mixture, including particle interaction. However, in order to validate our interpretation we need to demonstrate it using transparent autoclaves.
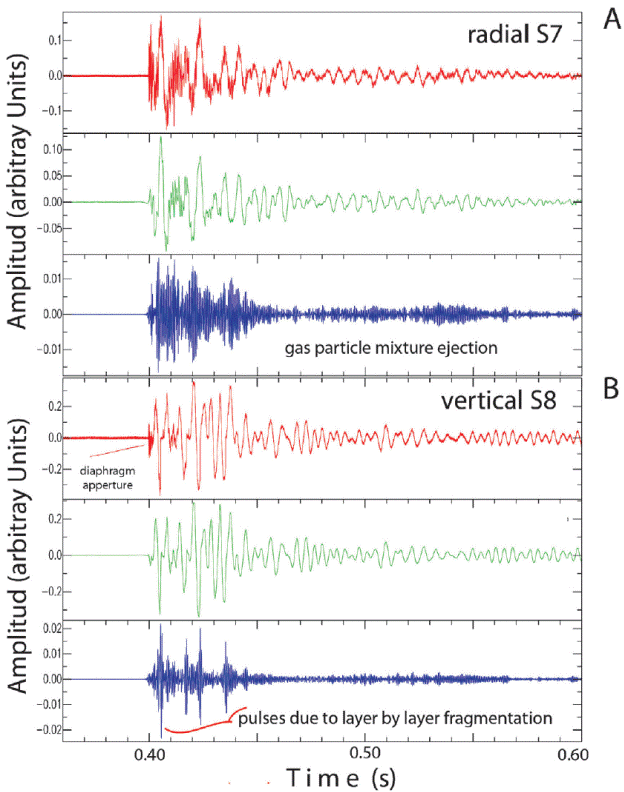
Figure 13 Waveform signals from: A) radial (S7); and B) vertical (S8) sensors. These signals were filtered in three frequencies bands: in red low frequencies < 800 Hz; in green frequencies between 800 and 2000 Hz; and in blue high frequencies > 2000 Hz. For better comparison, plots are at their original scale; x-axis is in seconds and y-axis in arbitrary units. Data are from an experiment at 9.0 MPa, using a PP sample with φ=40% and one dia phragm. For interpretation some events are indicated on the plots, see text for major details.
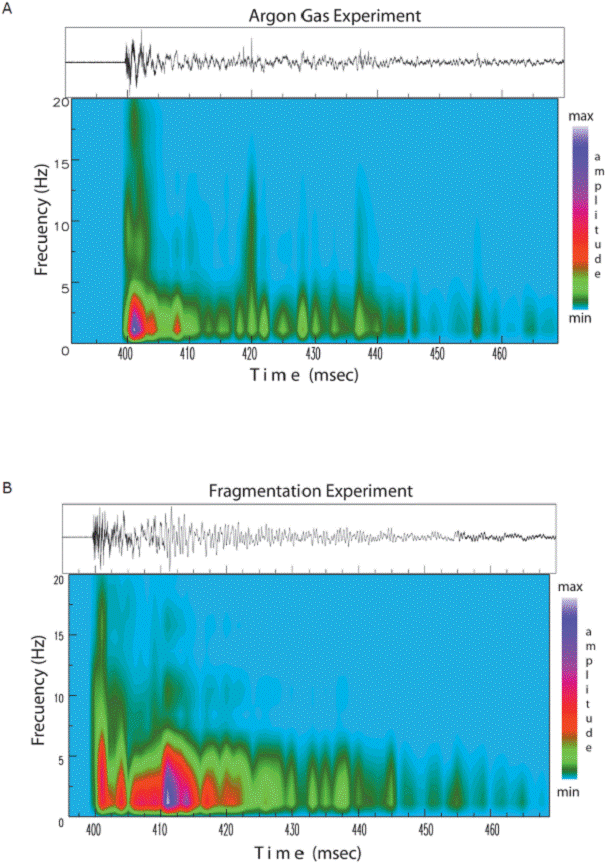
Figure 14 A) Spectrogram of the signal corresponding to the experiment performed at 8.1 MPa using only argon with one diaphragm. B) Spectrogram of the signal of the fragmentation experiment showed in Figure 13A. The top panel of each spectrogram shows the corresponding time series recorded at sensor S7. Color bar indicates amplitude intensity at relative scale in arbitrary units; x-axis is in milliseconds and y-axis is in Hz.
From the spectral characteristics, we can dis tinguish the response of the system comparing the spectrograms of two experiments: one performed only with gas at 8.1 MPa (no fragmentation) and the second corresponding to the fragmentation of a core sample at 8.9 MPa (Figures 14A and 14B). Note that both spectrograms present similar structures, with variations in the excitation modes along the spectrum and different breaking process of the diaphragm(s). The later can be identified at the beginning of the record due to their high frequency content (Figures 14A and 14B). These observations are in agreement with the distribution of the elastic energy in terms of frequency, waveform expressions and the occurrence of the physical processes inside the autoclave.
Maximum amplitudes were consistently recorded at the vertical component (e.g. Figures 13A and 13B). The sensor S8 captured the counterforce related to the decompression of the sample and the force at the base of the diaphragm at the time when it opens, as well as with the driving force associated with the ejection of the bulk mass. Comparing the amplitudes, we observe that the vertical component S8 is about twice the amplitudes in the radial sensor S7, which is in agreement with the cylindrical geometry (Arciniega-Ceballos et al., 2014; 2015). Although intuitively higher amplitudes at higher pressures are expected, the maximum amplitudes are, however, also a function of the porosity and permeability of the sample, and they depend also on the fragmentation dynamics (at the time of these experiments we could not see inside the autoclave to evaluate this effect). Even when it is difficult to deduce how the rock was fragmented, we observe that maximum amplitudes do not necessarily coincide with maximum pressure. We also calculate the vertical and radial forces associated with each sample following Arciniega-Ceballos et al. (2014). We found that there is a trend of the force with respect to the sample porosity (Figure 15A). Figure 15B shows that the forces are distributed along the autoclave increasing from top (sensor 6) to bottom (sensor 8). The sample and autoclave are subjected to the major stresses at the bottom. The trend indicates that porosity and density of the sample affect the maximum force involved in the fragmentation of the sample more than the applied pressure.
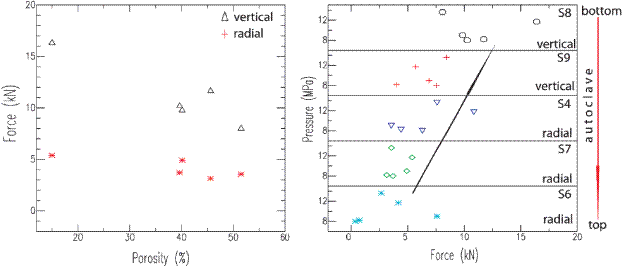
Figure 15 A) Vertical force from sensor S8 (black triangles) and radial force from sensor S7 (red asterisks) vs porosity. B) The force distribution along the mechanism of the autoclave is shown considering the sensors' location; from the top of the sample to the bottom of the autoclave (red arrow) (see Fig. 1). The forces of each experiment are plotted by sensor vs pressure; radial sensors S6, S7, S4, are in cyan, green and blue, respectively. Vertical sensors S8 and S9 are in black and red, respectively. Note in A) that the force decreases as porosity increases, whereas in B) the force increases from top to bottom (indicated by the black arrow). Vertical forces are about twice the radial forces as in Arciniega-Ceballos et al. (2015).
The observed characteristics in time and frequency indicate that more energy is released in the low frequency band (below 300 Hz) and the spectral similarities among different experiments confirm common mechanisms such as the gas expansion and the response of the autoclave. Higher frequencies might be associated with the particularities of each experiment, like the manner of how each sample is fragmented as well as the particle interaction involved (see Figures 13A and 13B). For future experiments, we shall consider the use of transparent autoclaves where the evolution of the fragmentation process inside the conduit can be filmed in order to correlate directly the processes that occur before and during the ejection with their associated elasto-acoustic signatures (Arciniega-Ceballos et al., 2015; 2016).
Discussion
The applicability of shock-tube experiments to volcanic eruptions has been discussed by Koyaguchi and Mitani (2005). They suggested that the results of shock-tube experiments can be applied to natural volcanic systems for magmas with viscosities higher than 107 Pa s, in which case bubble expansion is negligible and brittle fragmentation occurs. It is worth noting that our experiments correspond solely to magmatic fragmentation, i.e. that fragmentation does not occur as a result of the interaction of magma with external water.
Our results may have important implica tions for understanding the mechanism of initiation and cessation of volcanic eruptions at Popocatépetl. The threshold data can be used to estimate how much overpressure is required to initiate explosive fragmentation of magma with a given porosity (Spieler et al., 2004). The porosity of dense ballistic blocks collected in the field range from 3-25 % and their corresponding fragmentation threshold determined experimentally are between 20 and 6 MPa, respectively. Pumice fragments corresponding to the 2001 pyroclastic flow deposit have porosities between 55 and 80 %, and their corresponding fragmentation threshold is between 3.5 and 5.5 MPa. Overall, the fragmentation threshold measured for the different types of samples from Popocatépetl is inversely related to the porosity and can be modeled with the fragmentation criterion proposed by Koyaguchi et al. (2008), with an effective tensile strength of 1.5 MPa. Considering Vulcanian eruptions, our threshold data can be used to estimate the amount of decompression needed to trigger magma fragmentation and produce an explosive eruption.
Moreover, the fragmentation threshold data can be used to estimate the energy consumed by the fragmentation process and calculate the effective pressure available to eject the ballistic projectiles (Alatorre-Ibargüengoitia et al., 2010). This pressure serves as an in put parameter for eruptive models, which in concert with ballistic models, can correlate the ballistic range with gas content and initial gas pressure. With this approach, the probability that certain areas can be affected by volcanic ballistic projectiles during Vulcanian eruptions will be linked with data from volcano monitoring, providing the basis for short-term hazard assessment (Alatorre-Ibargüengoitia et al., 2012).
The fragmentation speed is also a controlling factor for explosive scenarios. If the fragmentation speed is comparable to the ascent rate of the magma, a stable fragmentation front may be established leading to sustained Plinian eruption. However, if the fragmentation front travels through magma with decreasing porosity, the fragmentation speed will diminish and the fragmentation level will rise (Scheu et al., 2006). The magma will cease to erupt if the pressure differential falls below the fragmentation threshold, either because the fragmentation front reaches low porosity magma, or the pressure differential decreases during the eruption (Spieler et al., 2004). Furthermore, Alatorre-Ibargüengoitia et al. (2011) proposed that the fragmentation speed determines the initial conditions of the expansion of the gas-particle mixture and it is a controlling factor on the velocity, density and mass discharge rate of the gas-particle mixture. All these factors can affect the eruption dynamics significantly. The data presented here represent, to our knowledge, the first experimental estimates of the fragmentation speed at magmatic temperatures (850 °C) and can be used as input parameters for eruptive models.
Fractal fragmentation theory provides the basis for comparing the grain-size distribution generated in the fragmentation experiments with the grain-size distribution of natural deposits. Linares (2001) collected a total of sixty ash fall samples corresponding to several eruptive events of Popocatépetl between 1995 and 1998 in areas of 1 m2 at several locations at distances between 1 and 56.6 km from the crater. He analyzed by sieving the grain-size distribution of each sample with sizes between 0.063 mm and 1 mm. Notably, we found that most of the collected samples follow a fractal distribution (Figure 16). The fragmentation fractal dimension (D f ) for each sample was calculated with Eq. (10) from the slope of the linear fitting ν in each plot. Figure 17A shows the histogram of the D f corresponding to the ash fall deposits, which ranges from 1.4 to 3.0, with mode 2.7 and median 2.4. There is no correlation between the fragmentation fractal dimension with crater distance in the analyzed events (Figure 17B).
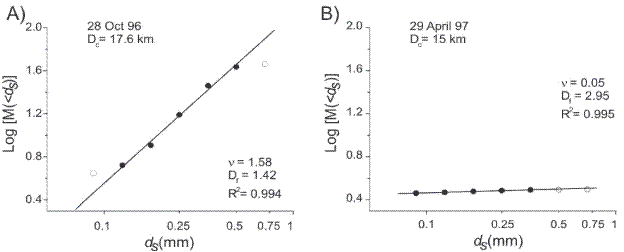
Figure 16 Representative log-log plots of particle size for ash samples ejected during two different events of Popocatépetl. Note logarithmic scale in the horizontal axis and that the scale is the same in both the plots. Dc represents the distance to the crater of the sampling site. Filled circles denote the data used for the linear fitting, whereas the open circles indicate the data that were not considered. The value of ν in each plot correspond to the slope of the linear fitting, whereas Df was calculated with Eq. (10).
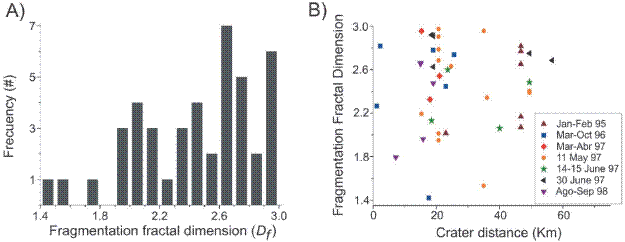
Figure 17 A) Histogram of the fragmentation fractal dimension (Df) corresponding to 60 ash fall deposits from several eruptive events of Popocatépetl between 1995 and 1998. B) Df from these ash fall deposits as a function of crater distance.
In our fragmentation experiments, the fractal distribution ranges between 1.7 and 2.5 at pressures up to 20 MPa and the observed trends suggest that very high pressures would be required to produce fractal dimensions higher than 2.6. Therefore, it is likely that the higher fractal dimensions observed for some of the ash samples may reflect selective secondary fragmentation processes that tend to reduce the grain-size of the pyroclasts and increase the fractal dimension. In fact, our decompression experiments with fragmented particles show that the fractal dimension increases after each new experiment. Kaminski and Jaupart (1998) showed that, at fragmentation, the amount of continuous gas phase is an increasing function of the D f value because the smaller the particles, more bubbles are disrupted and therefore the gas release is enhanced. This effect can considerably influence eruptive behavior above the vent.
The experiments of rock fragmentation provide a unique approach to distinguish the processes involved in the generation of seismic signals. The experiments performed at con trolled conditions in the shock-tube apparatus with a well-known geometry provide information about the distribution of energy during fast decompression. Important information about the processes involved are retrieved from the distinct waveform signals of the time series recorded with the set of piezoelectric sensors (Arciniega et al., 2015). Our experiments show that there are important differences in the spectral characteristics between the decompression of just pressurized gas with respect to the fragmentation of the samples. We noticed that the fragmentation process controls the frequency content of the records. The sample porosity affects the maximum amplitudes of the recorded signals and the maximum force involved in the fragmentation of the sample more than the applied pressure. The coherence observed in the elasto-acoustic signals at lower frequencies suggests bulk mass motion due to the gas expansion, the fragmentation of the sample and the ejection of the particles. The frequency and time characteristics observed in the elasto-acoustic signals associated with the different processes of the experimental explosions may contribute to the interpretation of seismograms related to Vulcanian eruptions (Arciniega-Ceballos et al., 2014; 2015). Future investigations would benefit from an increased coupling of experimental results with geophysical data (seismic, infrasound and ground deformation), Doppler radar measurements during Vulcanian eruptions (e.g. Scharff et al., 2015), high speed observations (e.g. Taddeucci et al., 2017) and with numerical simulations considering unsteady vent conditions (e.g. Ogden, 2011; Carcano et al., 2013; Clarke, 2013; Chojnicki et al., 2015).
Summary and conclusions
This study comprises experimental data of several parameters (threshold, fragmentation speed, efficiency, elastic signals) associated with the fragmentation behavior of different sets of samples from Popocatépetl, Mexico. Our results show a strong influence of the connected porosity of the rock and the applied pressure on the fragmentation process. The measured data of the fragmentation threshold are important because they provide a quantitative constraint on the overpressure required to generate an explosive event.
We also investigated quantitatively the fragmentation speed corresponding to the different sets of samples. We present the first experimental estimate of the fragmentation speed at magmatic temperatures (850 °C) calculated from the ejection velocities of the front of the gas-particle mixture after fragmentation using the model of Alatorre-Ibargüengoitia et al. (2011). According to this model, the fragmentation speed determines the initial conditions for the expansion of the gas-particle mixture, which in turn controls the velocity, density and mass discharge rate of the gas-particle mixture. These factors can affect the eruption dynamics significantly.
We observed that the grain-size distribution of experimentally generated pyroclasts is con sistent with fractal fragmentation theory. We found that the fractal dimension of fragmentation shows a positive linear correlation with the energy (applied pressure) for two sets of samples, no clear trend in one different set of sample and a negative correlation in another set of samples with different groundmass texture. These results indicate that not only the rock porosity and the applied pressure control the fractal dimension, but also the groundmass texture and composition may play an important role in the grain-size distribution. Ash samples collected for several Vulcanian eruptions of Popocatépetl also present a fractal behavior, but in general with higher D values, which suggest the occurrence of secondary fragmentation processes that increase the fractal dimension.
Our results shown that the waveforms and the spectral characteristics depend on the experiment type (decompression of pure gas vs fragmentation of a rock sample) revealing the influence of the fragmentation processes. In fact, our experiments suggest that the fragmentation process affects the frequency content. We also observed that the sample porosity has an effect on the maximum amplitudes of the signals and their associated maximum force. The experimental data and observations presented here contribute to a better understanding of magmatic fragmentation of rocks from Popocatépetl and thereby improve the interpretation of monitoring data and calibration of eruptive models for Vulcanian eruptions at intermediate composition volcanoes.


 nueva página del texto (beta)


