Introduction
Mexican National Seismological Service (SSN, by its Spanish acronym) is the agency responsible to provide information about the earthquakes which occur in Mexico. The parameters routinely reported are magnitude, hypocentral location, and origin time. However, presently, seismic moment tensor is not routinely reported. Seismic moment tensor includes useful information about the focal mechanism and magnitude of the earthquake which are critical in understanding geological processes, seismotectonics, and seismic hazard.
Seismic Moment Tensor Solutions (MTS) for earthquakes worldwide, including Mexico, are systematically computed by the Global Centroid Moment Tensor Project (GCMT) (Dziewonski and Woodhouse, 1983; Ekström et al., 2012; http://www.globalcmt.org/), and by the National Earthquake Information Center (NEIC) (http://neic.usgs.gov). In both cases, body and surface waves, recorded at teleseismic distances, are inverted to obtain the MTS.
The GCMT catalog includes seismic moment tensor for most of the global earthquakes with Mw ≥ 5 (http://www.globalcmt.org/), and, typically, quick solutions are published from some tenths of minutes to a few hours after the earthquake. The GCMT uses a method developed by Dziewonsky et al. (1981) to invert long-period body and mantle waves. Seismic data used is provided by stations of the Global Seismic Network (GSN) and of the Incorporated Research Institutions for Seismology (IRIS). On the other hand, NEIC follows the method developed by Sipkin (1982), which uses long-period data from the vertical component (IRIS and GSN networks) to invert body-waves. This approach is focused on the USA and adjacent areas. For Mexico it includes most of the Mw ≥ 6 events (http://earthquake.usgs.gov/earthquakes/eqarchives/sopar/). Additionally, NEIC computes W-phase Moment Tensor (Kanamori and Rivera, 2008; Hayes et al, 2009) for significant worldwide earthquakes.
Due to the interest in (a) getting focal parameters of earthquakes in near real time, and (b) to complete the catalogs for earthquakes with Mw < 5.0, systems based on regional data have emerged in the last years. Since the early 90's, the Berkeley Seismological Laboratory developed an automatic system that allows to compute the MTS few minutes after the occurrence of an earthquake in California (Romanovicz et al, 1993; NCDEC, 2014). This methodology has been used in several other regional systems.
The National Research Institute for Earth Science and Disaster Resilience computes most M > 4.0 earthquakes and some M > 3.5 earthquakes for Japan (Fukuyama et al, 1999). In Italy, the Mediterranean Very Broadband Seismographic Network implemented an automatic moment tensor computation for earthquakes with M > 3.5 (Pondrelli et al, 2003; Pondrelli et al, 2015). In Spain, the National Geographic Institute implemented a near real time moment tensor computation using data of a broadband network, which triggers with M > 3.5 earthquakes (Rueda and Mezcua, 2005).
In the case of Mexico, there are some papers in which MTS has been computed with regional and/or local Mexican data for earthquakes with Mw < 5; however, the scope of these works is for specific areas (e.g. Zúñiga et al, 2003; Pacheco and Singh, 2010).
In this work we present the first Moment Tensor catalog, on a regional scale, for earthquakes recorded by the SSN.
Mexico is located in a tectonically active setting. Most of the recorded seismicity is due to the interaction between five major tectonic plates (Figure 1), namely: North American, Pacific, Cocos, Rivera and Caribbean. This tectonic context represents a challenge for improving strategies to monitor seismic activity and to get more information about the recorded events.
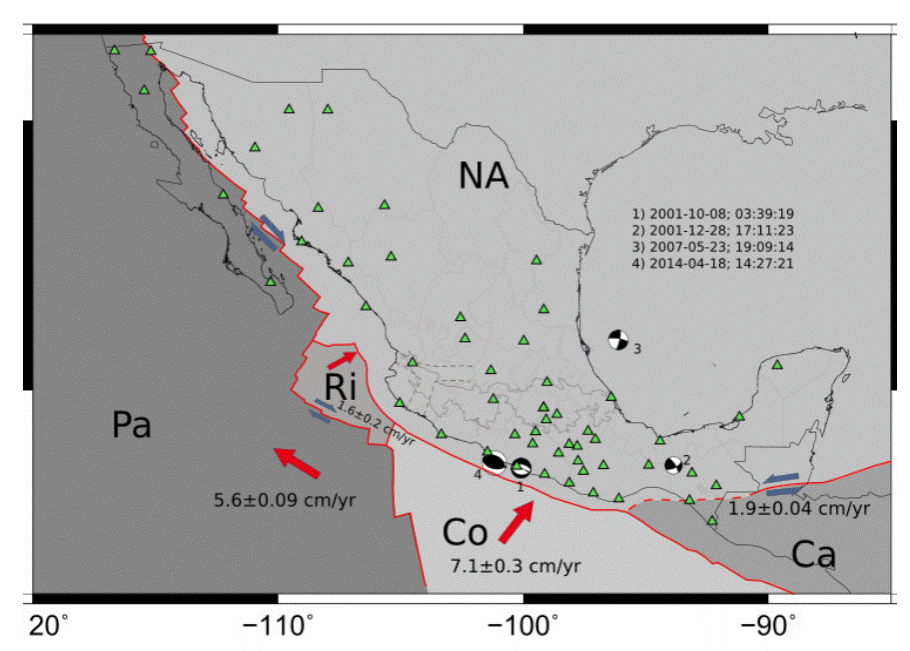
Figure 1 Mexico's tectonic setting. NA: North America plate, Pa: Pacific plate, Ri: Rivera plate, Co: Cocos plate, Ca: Caribbean plate. The arrows show relative motion between plates. The velocities are relative to NA and were taken from MORVEL (DeMets et al., 2010). The triangles show the SSN broadband stations in 2018. The "beach balls" are the MTS solutions for 4 events taken from the database; more details about these events are given in the text. Number of the event is keyed to Table 3
In the last two decades, the SSN has experienced a significant expansion in the broadband station network. At present, the SSN operates a seismic network of ~60 broadband seismic stations (Figure 1). Earthquake locations and magnitudes are obtained and reported routinely (available in http://www.ssn.unam.mx/).
The broadband seismic stations operated by SSN are equipped with broadband triaxial seismometers. A 100 sps real time velocity stream is sent to the central facilities. In the early 21st century only small segments of data containing regional earthquakes were stored. Nowadays, data is stored in 1-day mseed file continuous stream. Using a web search over the SSN's catalog (http://www2.ssn.unam.mx:8080/catalogo/), we found 22,024 earthquakes with M ≥ 4 in the period January 2000 - December 2018. In this paper, we use a systematic and automatic procedure to compute MTS for these events.
Method
The method used in this work was proposed by Fukuyama et al (1999) and adapted to the SSN database by Franco et al (2002) and Iglesias et al (2008). As described later, the algorithm requires a minimum data record length. The algorithm searches the segment containing the record of the earthquake in 1-day mseed file or in the segment stored in the case of the early years.
We present a brief description of the method used to determine the moment tensor (further details can be found in Fukuyama et al., 1999). The computation procedure is based on the Time Domain Moment Tensor inversion method developed at the Berkeley Seismological Laboratory (Dreger and Helmberger, 1993; Pasyanos et al., 1996).
For a point source, the observed displacement ds(t) at a seismic station located on
Earth's surface can be computed as the convolution of the seismic moment tensor (
Kıkuchı and Kanamon (1991) proposed to
decompose the
The "beach ball" scheme corresponding to each of the previous mechanisms are:
Using this representation, any moment tensor can be expressed as a Hnear combination of these elementary faults:
Kıkuchı and Kanamon (1991) show that the
moment tensor (Mij) can be expressed as a function of
Since in this work we focus on tectonic earthquakes, and to reduce the non-uniqueness problem, we assume the isotropic component equal to 2ero; thus, previous equation is reduced to:
Equation 1, using the moment tensor described above, is linearly inverted for the entire three-component broadband displacement waveforms (Dreger and Helmberger, 1993) to obtain Mij.
1 Green's functions
The Green's functions were precomputed for each event-station combination in a discrete mesh using the frequency wavenumber method (Saikia, 1994), assuming a layered half space model without lateral velocity variations (Fukuyama et aL, 1999). are calculated every 5 km for a horizontal mesh from a distance of 5 to 1500 km. In depth direction, the mesh spacing is 2 km in a range of 2 to100 km; for deeper locations, the mesh spacing is every 5 km until 200 km depth (see Figure 2 for a sketch). Velocity model proposed by Campillo, et al. (1996) (Table 1) is used in computing.
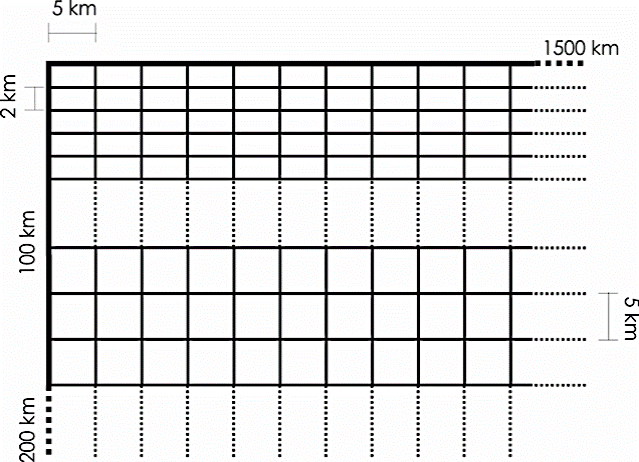
Figure 2 Sketch of the mesh used to compute Green's function. Each Green's function has been calculated in the intersection point of the mesh, both horizontally and in depth. Notice, that the step is 5 km apart at depth > 100km.
Table 1: Velocity model used for the computation of Green's Functions (Campillo et al., 1996). Layer
| Layer | Thickness, km | α , km/s | β, km/s | ρ, gr/cm3 |
|---|---|---|---|---|
| 1 | 5.0 | 5.36 | 3.10 | 4.45 |
| 2 | 12.0 | 5.72 | 3.30 | 4.72 |
| 3 | 28.0 | 6.50 | 3.75 | 5.33 |
| Half Space | ∞ | 8.23 | 4.50 | 6.66 |
As discussed in the next section, in order to minimize finite source effects, among other considerations, we filtered data in 3 different frequency bands related to the initial magnitude (see Table 2; Fukuyama et al., 1999; Fukuyama and Dreger, 2000). Therefore, all Green's function calculated for each pair of horizontal distance and depth are also filtered in same specific bands. The pre-computed Green's function library consists of more than 60,000 files.
Table 2: Minimum and maximum epicentral distance, filter bandwidth and data length as a function of initial magnitude reported by SSN.
| Magnitud range | Epicentral distance range (km) | Frecuency range (Hz) | Data lenght from initial time (seconds) |
|---|---|---|---|
| 4.0≤M<5.0 | 30-450 | 0.02-0.10 | 150 |
| 5.0≤M<6.5 | 100-600 | 0.01-0.05 | 180 |
| 6.5≤M<7.5 | 400-995 | 0.005-0.02 | 240 |
| M≥7.5 | 500-1500 | 0.005-0.02 | 360 |
2 Selection of stations, filter band and data length
As mentioned before, we analyzed a large database of regional earthquakes, which requires an automatic procedure based on specific criteria to select records for inversion. The selection criteria are a combination of rules based on the following:
Data integrity: An automatic procedure checks the integrity of the data in these aspects:
a) Use of records from stations included in a list of valid stations (i.e. those that meet the conditions described in Table 2)
b) Sufficient data length for inversion of the three components (N-S, E-W, Z).
c) Pole-zero file valid for the date and time of the earthquake.
Point source approximation: In order to avoid finite source effects, we apply the following criteria based on the magnitude reported by SSN:
a) From the list of stations available, we choose stations sufficiently far to approximate the event as a point source (Table 2).
b) To pre-process observed data, we apply a specific filter related with magnitude and, therefore, related to epicentral distance. It is important to emphasize that the filter bands are the same used in the pre-calculated Green's function library of synthetic seismograms. The filter bands have been taken from Fukuyama et al. (1999).
c) Signal/noise ratio: This ratio decreases with distance and depends on the magnitude of the event. We do not choose the records of stations located too far from the event location, based on magnitude.
Taking into account above considerations, we choose, as a function of the initial magnitude, a combination of parameters to compute MTS: (a) minimum and maximum epicentral distance, (b) filter bandwidth, and (c) record length. In Table 2 we summarize the values of parameters.
The schematic representation of Table 2 corresponds to Figure 3. This figure shows a set of doughnuts whose center coincides to the epicentral location. The shaded area is the zone fulfilling parameters described in Table 2. The stations located inside this region will be the subset of valid stations.
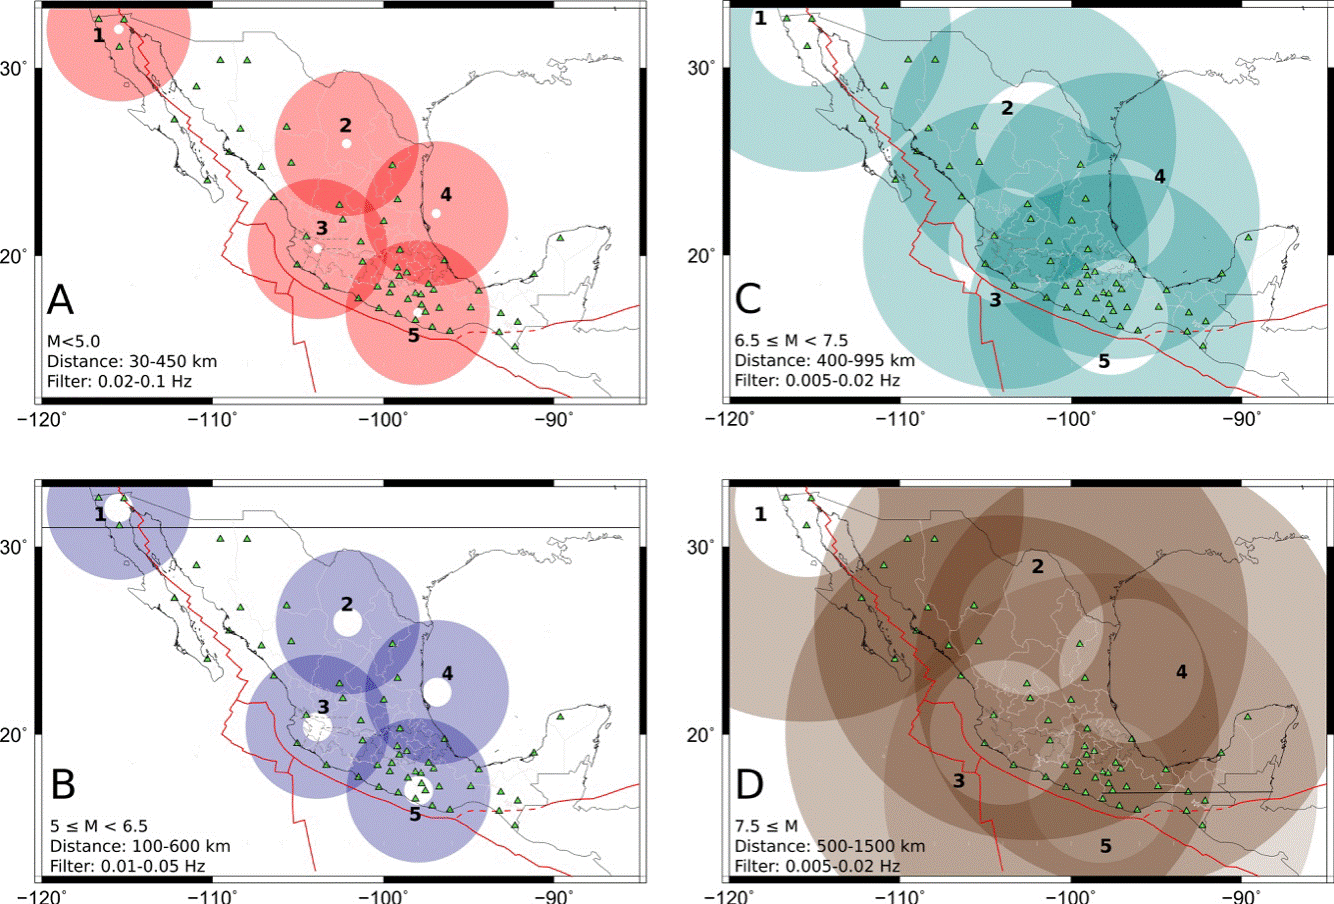
Figure 3 Schematic representation of parameters used to choose valid stations (for 5 arbitrary locations) and filter bandwidths to pre-process data and compute Green's functions
The stations located inside the doughnuts holes are discarded. Inner and outer radii are determined by a specific magnitude range, and observed data and synthetics are bandpass filtered in the corresponding interval.
In Figure 3, we plot doughnuts for 5 arbitrary locations. Even in places where the density of stations is poor (doughnut number 2 of Figure 3), the algorithm should be able to find solutions for small events (M < 5.0). For this configuration, MTS for large events could be computed for any epicentral location. On the other hand, an example of a coverage problem is shown in Figure 3B. For events with magnitude 5.0 ≤ M < 6.5, located in the northern zone of Baja California peninsula (doughnut No. 1), the availability of valid stations to compute MTS depends strongly on the epicentral location.
3 Automatic process
Since we had to run the same procedure for more than 20,000 events, we developed a set of computational programs to automate the analysis of each event of the catalog. For further reference to the procedure described here we use the acronym AMTP (Automatic Moment Tensor Procedure).
The entire AMTP is summarized in Figure 4 by means of a flowchart. In this figure, we present 2 flowcharts, the main process (Figure 4 A) and the sub-process of station selection (Figure 4 B).
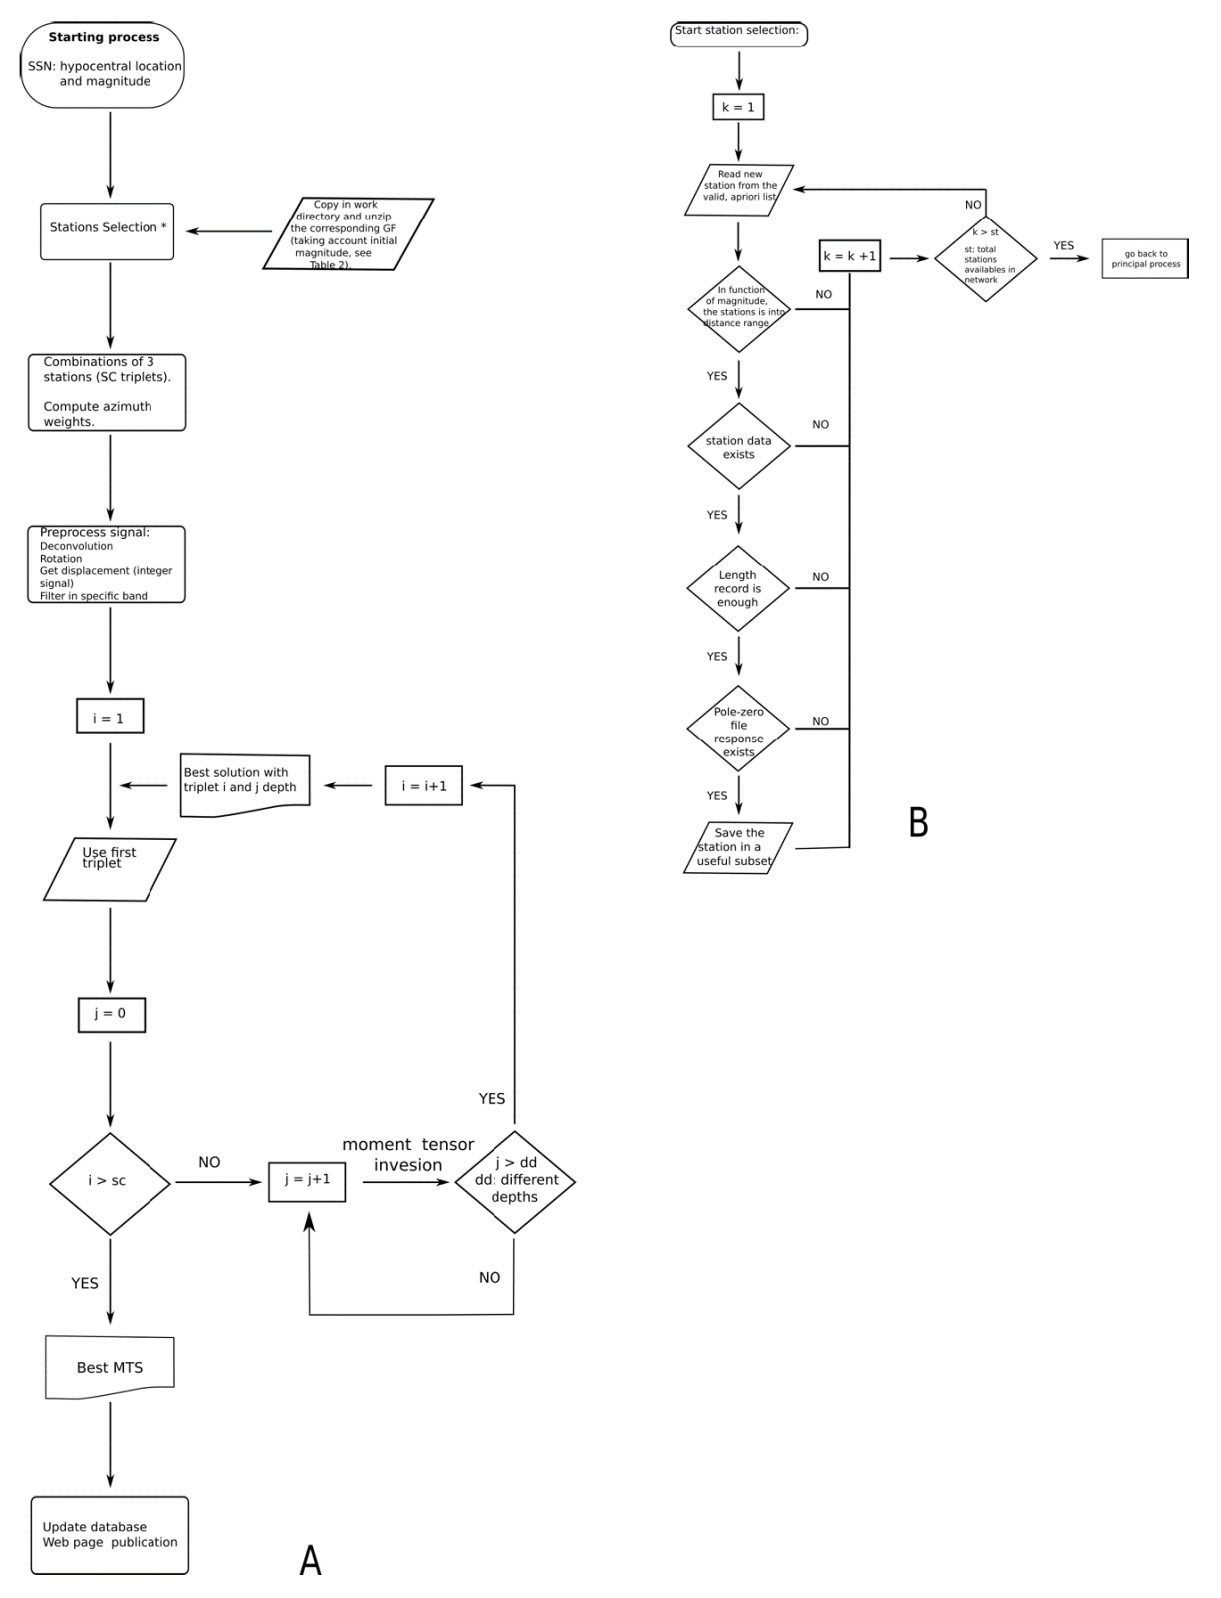
Figure 4 Flow chart of the entire AMTP. A) General flow chart. The process starts with the SSN information of hypocenter, magnitude and origin time. The flow chart shows the iterative loop in triplet station combinations, and for each one trying different depths (± 30km; read detail in text). B) Flow chart to show the procedure to select station combination, taking azimuthal coverage into account.
If data records are not available for any valid station and/or data are incomplete or corrupted in one of the three components, the event is discarded from the inversion.
After several tests, we choose to perform inversion with combinations of three stations at each time. Using fewer stations reduce the reliability of the solution, and use of more stations increase the computing time of procedure and reduces the possibility of finding a well fitted solution.
If records from more than 3 valid stations are available, then the strategy proposed by Fukuyama et al. (1999) and Kubo et al. (2002) for the inversion consists of selecting the closest stations falling in the epicentral range, according to the criteria listed in Table 2.
An important disadvantage of this strategy is that selected stations could be geographically concentrated in a narrow segment. Solutions obtained for this kind of configuration could be biased, even when data and synthetics are well matched at the three stations. A good azimuthal distribution reduces non-uniqueness problems and increases the reliability of the solution, but the fit between the data and synthetics could be poor. We propose to use a hybrid strategy, which, although implies a larger computational cost, increases the possibility to find a solution with a good azimuthal coverage and small misfit.
From the list of valid stations, we compute all the possible combinations without repetition of three stations. For each combination a grid search in depth is performed. The algorithm computes the MTS inversion for different depths (±30 km, according to Figure 4 a). For each combination, the algorithm store only the solution with the largest variance reduction (VR) defined as:
where si(t) and oi(t) are the synthetic and observed waveforms, respectively, and wi is a weighting function proportional to the epicentral distance (Fukuyama et al., 1999).
Finally, to choose the selected combination, we weight VR with a function which
depends on azimuthal coverage of the combination. For a three station scenario,
the ideal azimuthal coverage (minimum gap) has stations 120° from each other;
this implies that the absolute value of the azimuth differences between each
station
We choose a linear function between 0.5 and 1 for 0°
≤
Our selected combination is one that maximizes the product: VR*W.
The scalar seismic moment, double-couple orientation components (DC) and the percentage of the compensated linear vector dipole (CLVD) are obtained from the tensor; the isotropic component of moment tensor is constrained to be zero.
Results
The AMTP yields a database of 8,081 MTS which represents 36.7% of the total of the input catalog. Many events were discarded in the seismic record selection since their length did not fit Table 2 criteria. As mentioned before, the procedure starts with events reported with magnitude M ≥ 4.0, but the AMTP computes more than 1,000 events with Mw < 4.0.
All the MTS are stored into a directory structure. For each MTS there is one directory. The convention to name directories is: yyyy_mo_dd_hh_mm: where yyyy are four digits for year; mo, two digits for month; dd, two digits for day: hh, two digits for hour; and, mm, two digits for minutes.
The MTS directory consists of a set of files, which are: (1) plot of the best MTS; (2) ascii file with all the parameters estimated for MTS (e.g. the best depth, each element of moment tensor, fault plane solution, VR value, Mw, scalar seismic moment, among others); (3) list of available stations, following the doughnut criteria; (4) list of triplets of station combinations.
In Table 3, we list four events which we use to provide examples of the results obtained by AMTP. In this table are included the number of available stations, the Mw from AMTP, and Mw reported by GCMT, VR and CLVD values are also reported. We also list the parameters reported by the SSN. The geographic location of each event, listed in Table 3, is shown in Figure 1. Figure 6 shows typical output information from AMTP.
Table 3: Events used to provide example about the information generated by AMTP (Figure 6). These events are representative for the possible solution obtained by AMTP. The events are sorted by date.
| Еvent number | Date yyyy_mm_dd | Origin time hh:mm:ss | Hipocentral location | Depth AMTP. km | Depth GCMT km | M SSN | Mw AMTP | Mw GCMT | AMTP | Number of available station | |||
| Latitutde °N | Longitude °E | Depth SSN km | CLVD % | VR% | |||||||||
| 1 | 2001-10-08 | 3:39:19 | 16.94 | -100.14 | 4 | 8 | 15 | 6.1 | 5.8 | 5.8 | 21 | 73.37 | 9 |
| 2 | 2001-12-28 | 17:11:23 | 17.09 | -93.89 | 202 | 180 | N/A | 4.3 | 5 | N/A | 59 | 8.3 | 4 |
| 3 | 2007-05-23 | 19:09:14 | 21.93 | -96.14 | 16 | 44 | 24 | 5.5 | 5.7 | 5.6 | 76 | 54.22 | 8 |
| 4 | 2014-04-18 | 14:27:21 | 17.011 | -101.46 | 18 | 18 | 18.9 | 7.2 | 7.1 | 7.3 | 25 | 88.76 | 17 |
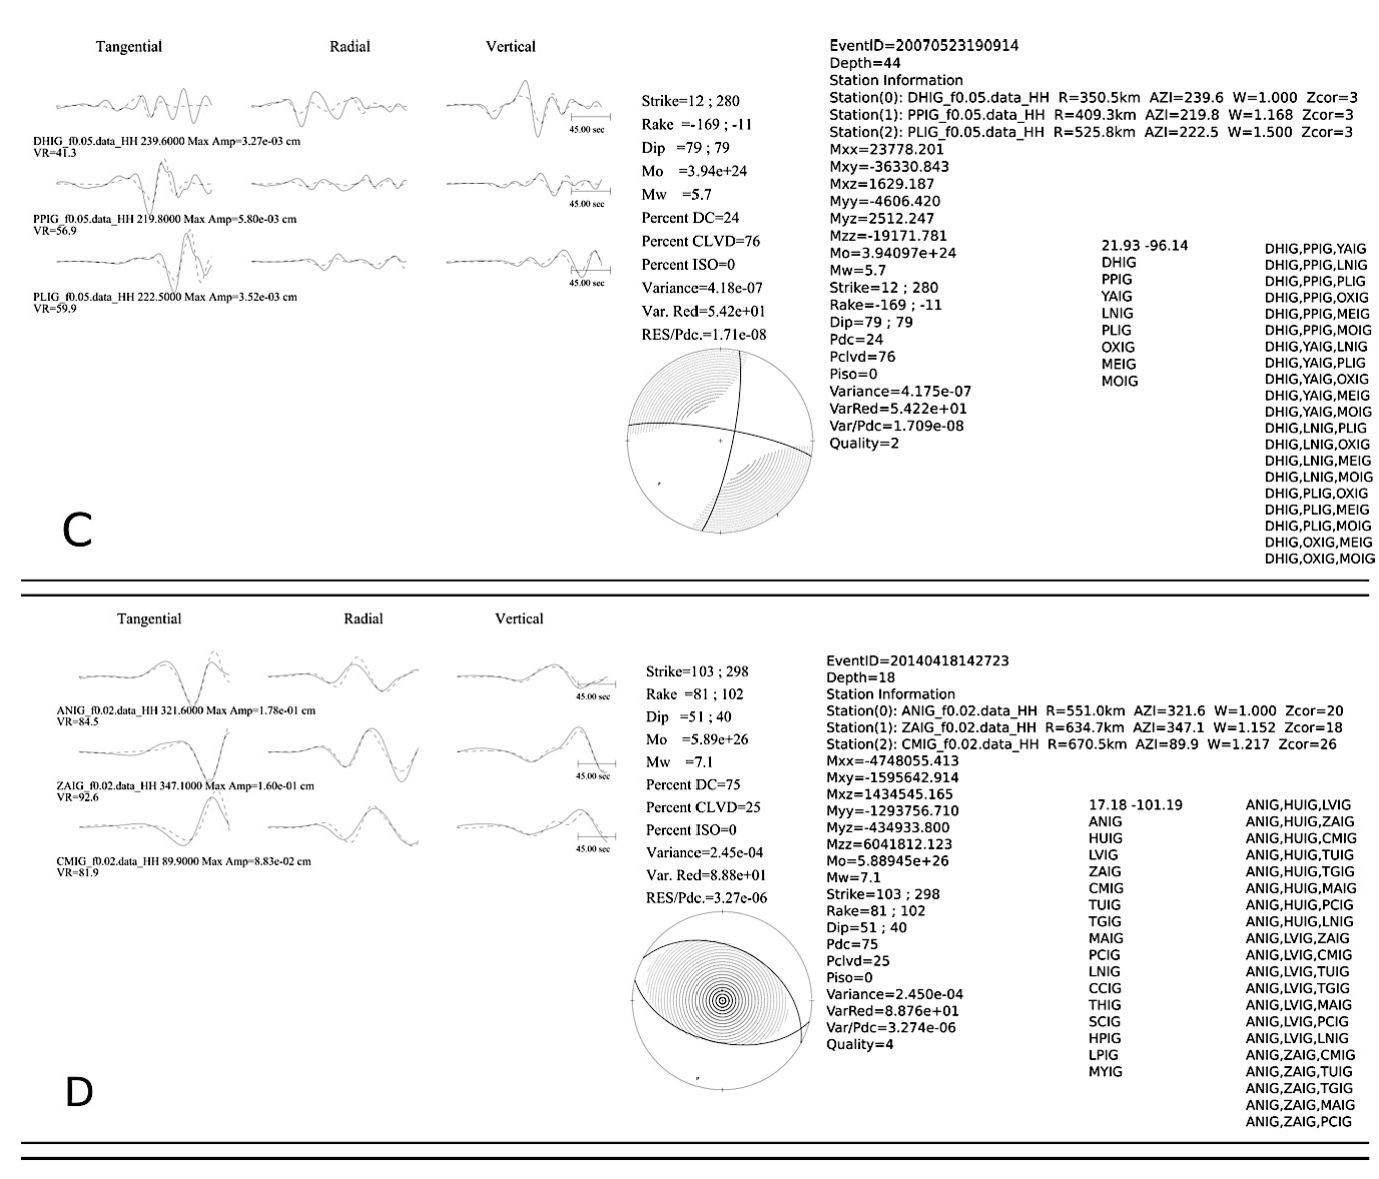
Figure 6 Output examples from the AMTP. For each event the figure shows: i) Typical output plot. ii) The ascii file with all the parameters obtained in the inversion. iii) Available stations list. iv) Maximum triplet station combinations. (A) The event corresponds to event 1 of Table 3. This event represents a small shallow earthquake located in a very densely instrumented zone. (B) Example of solution of a small, deep earthquake located in a zone with sparse station distribution, few available stations, poor VR values (event 2 of Table 3).

Cont. Figure 6 (C) Event located in a very unusual location (event 3 in Table 3). This event presented a high CLVD but an acceptable VR value. (D) An example for a very high VR value (89%). It is a large event (Mw = 7.1) with many available stations (event 4 in table 3).
Discussion
The MTS gives relevant additional information about earthquake source parameters. Nevertheless, if the MTS has a poor-quality resolution (low VR values), the information may not be reliable.
With the aim of evaluating the quality of the MTS database, we carried out a statistical comparison between the input magnitude and the magnitude reported by AMTP. Also, we analyzed the source parameters reported in the AMTP catalog with GCMT solutions.
1 Comparison between SSN and AMTP catalogs
Figure 7 shows a plot of the output magnitude (Mw) versus input magnitude (M) as reported by SSN. VR of the events are represented by the color of the symbol. This figure reveals a large disparity for some input magnitudes and the Mw obtained, especially for lower magnitudes. This disparity decreases if we consider a subset of events with VR ≥ 50% (Figure 7, middle). However, for higher VR (e.g. VR ≥ 70%) the correlation does not improve significantly. So, VR ≥ 50% provides a quality control to accept (or reject) MTS. Although the number of solutions decreases considerably, such VR criterion gives reliability to the final catalog. Figure 7 (right) shows the magnitude distribution for MTS for VR ≥ 50%.

Figure 7 Left: Input magnitude (M as reported by SSN) vs. output magnitude (Mw) and its VR obtained for the Automatic Process. Center: Same as the left, but for events with VR ≥ 50%. The color of the symbol, in left and center frames, is related to the VR value. Right: Magnitude distribution of MTS with VR ≥ 50%.
For further analysis, we considered only the 1,521 events in which VR ≥ 50%. Here, we will refer these solutions as RMMT (Regional Mexican Moment Tensor).
To analyze a possible temporal evolution of the quality of solutions, in Figure 8 we show 1x1° regions with colors indicating percentage of solutions found in each square with VR ≥ 50%. We also include the location of stations (green triangles) operating at the end of each epoch. It is important to mention that solutions are cumulative. This figure shows that, at the beginning of the catalog (2000-2003), only some specific regions of the Pacific coast and the Tehuantepec Isthmus had reliable solutions. The map corresponding to 2000-2009 shows a remarkable change with respect to the previous one, especially in reliable solutions obtained for the Gulf of California and Central Mexico. The last frame shows the situation of the entire catalog (2000-2018) where we obtained reliable solutions for South and Central Mexico and the Gulf of California. In the supplementary material (appendix Figure S-1) we include a similar figure, but colors representing the quantity of solutions instead of quality for the RMMT catalog.
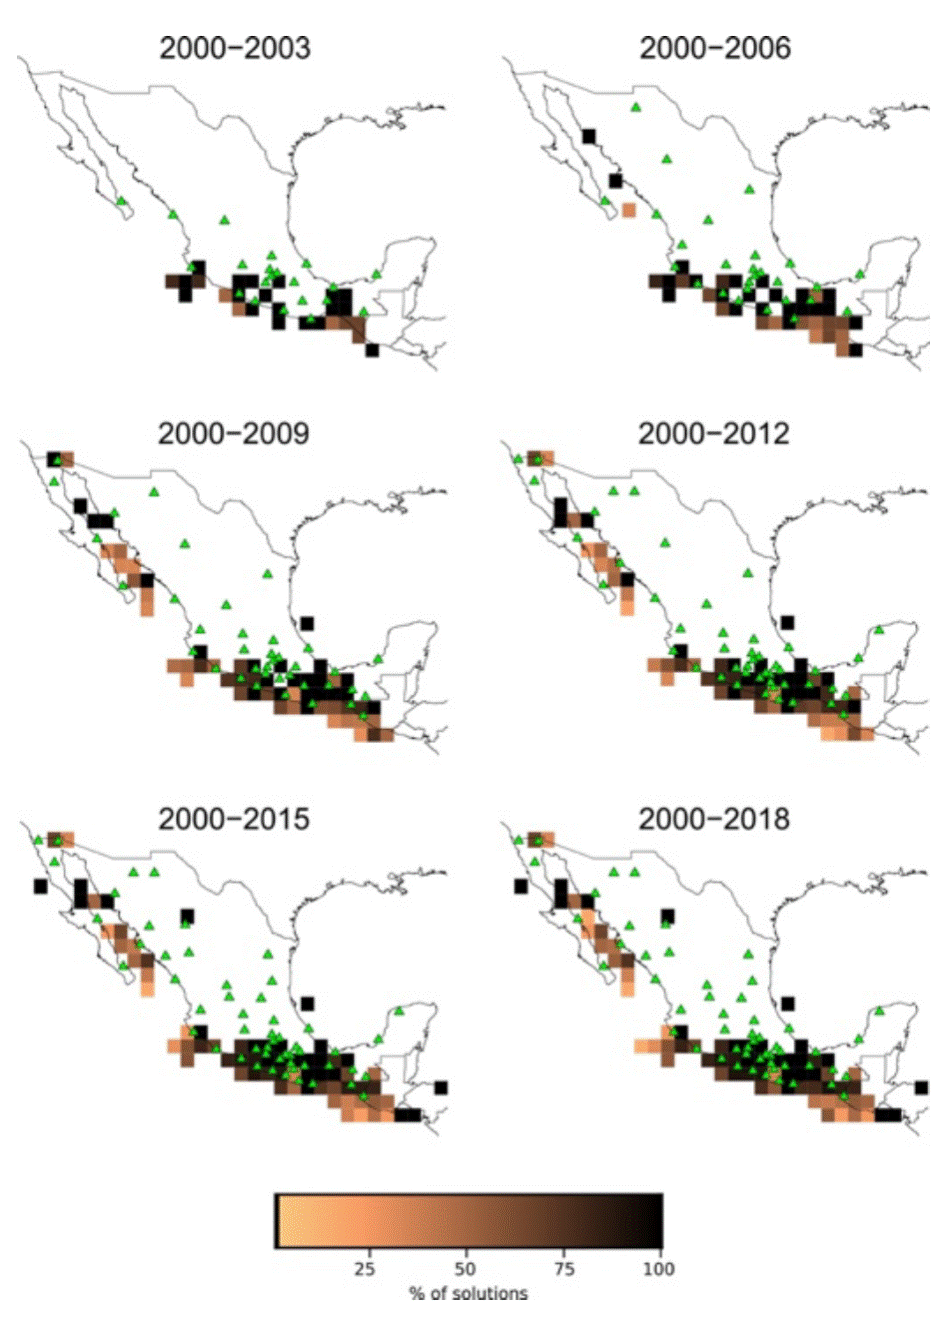
Figure 8 1x1° regions with colors indicating percentage of solutions found in each square with VR ≥ 50%. Green triangles show the location of SSN stations. The figure shows a significant improvement in the reliable solutions.
Since hypocentral depth has larger uncertainty compared to epicentral location, the moment tensor inversion procedure includes a grid search around the reported depth by SSN (section 2.3). The best solution, after grid search, do not show a specific relation with input depth, except for the constraints imposed by the ± 30 km interval in the grid search (Figure 9). Although uncertainty in depth reported by SSN may be large, it is not possible to conclude whether the depth obtained by the procedure is better determined.
2 Comparison between GCMT and RMMT catalogs
Of the 1,521 events of the RMMT catalog, 658 solutions are in common with the GCMT catalog (~43%).
The linear least squares fit between the datasets has a high correlation coefficient R2 of 0.92 (Figure 10). Although the R2 is good, the slope (1.044) and intercept (-0.38) of the equation suggests that there is a systematic underestimation of magnitude with respect to that reported by GCMT (Figure 11). We note that the disparity increases for magnitudes Mw ≤ 6.5. These differences have also been observed for smaller regional catalogs (e.g. Gasperini, et al., 2012, Pondrelli et al., 2016). There is not enough evidence to discriminate if the magnitudes of GCMT are overestimated or our determination of Mw is underestimated. A further analysis of Mw with independent data and/or other method could help solve this issue.
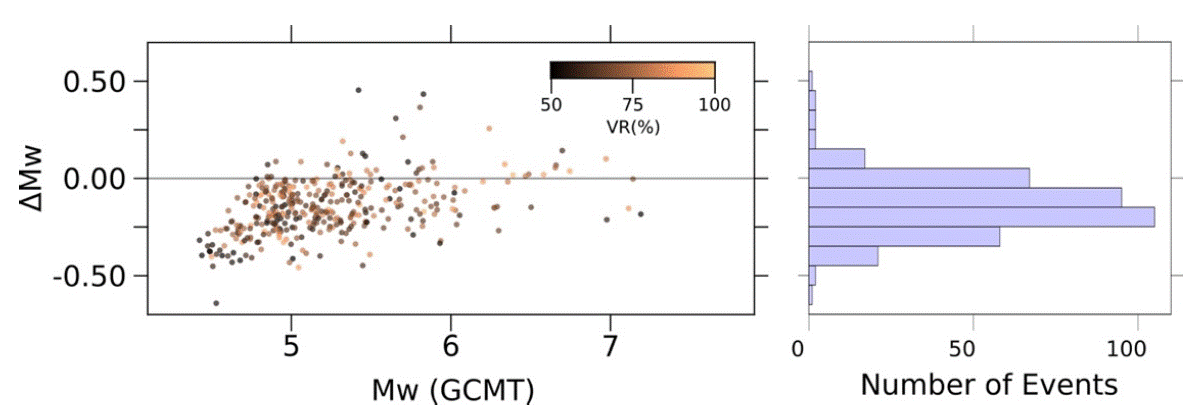
Figure 11 ΔMw vs Mw(GCMT) (left) and the histogram distribution of ΔMw (right). Most events in the RMMT catalog, seem to be underestimate by ~0.25. In the histogram, we can observe a normal distribution of ΔMw, with the mean value shifted ~0.25 from zero.
The magnitude of events is only one of various parameters that we can get from MTS, and, as stated before, the correlation of magnitude between catalogs are acceptable. However, the aim is to get more source parameter information. In this sense, it is important to compare the entire moment tensor. To do this, we computed the Kagan angle, K (Kagan, 2007), which is the minimum 3D angle required to rotate the principal axes of one moment tensor onto other. In this case, K=0 would mean that the nodal plane reported by GCMT and in this study match exactly.
Figure 12 A shows the geographical distribution of K value. Plots in Figures 12 B and 12C (VR vs. K and Mw vs. K) show that there is no evident correlation between K and VR, or K and Mw.
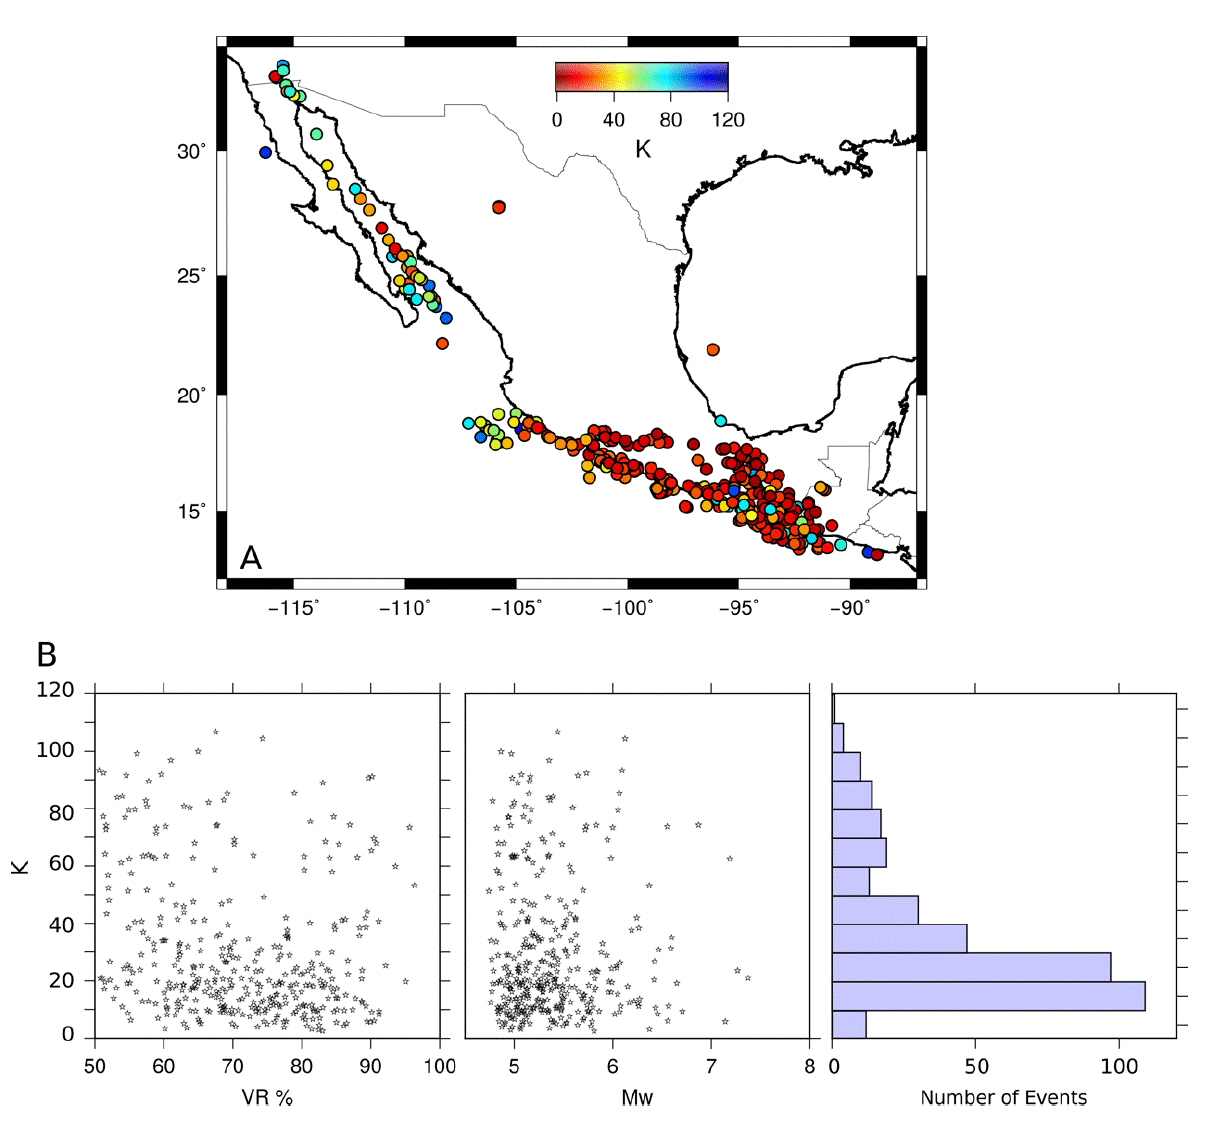
Figure 12 A) Geographical distribution of Kagan angle, K estimated for each event in the RMMT. The red color shows the best agreement (minimum K value). B) Left and center show relationship between K value and VR and Mw, respectively. B) Right shows distribution of K.
As seen in Figure 12 B (right), K is small for many events; 67% of the events have K ≤ 30°. The geographical distribution of events and K values show that the events with small K are located in central and southern Mexico, where the coverage of stations is better.
A comparison between the six independent components of the elements of the moment tensor was also carried out, and the corresponding figure can be found in the Appendix (S-2).
3 Tectonic Interpretation
Although the number of events in our RMMT catalog is only 8.6% of the total, it is still a useful tool to get a general picture of the different tectonic provinces of Mexico.
Figure 13 shows all the focal mechanism reported in the RMMT database. In this figure it is possible to distinguish different tectonic environments described briefly below.
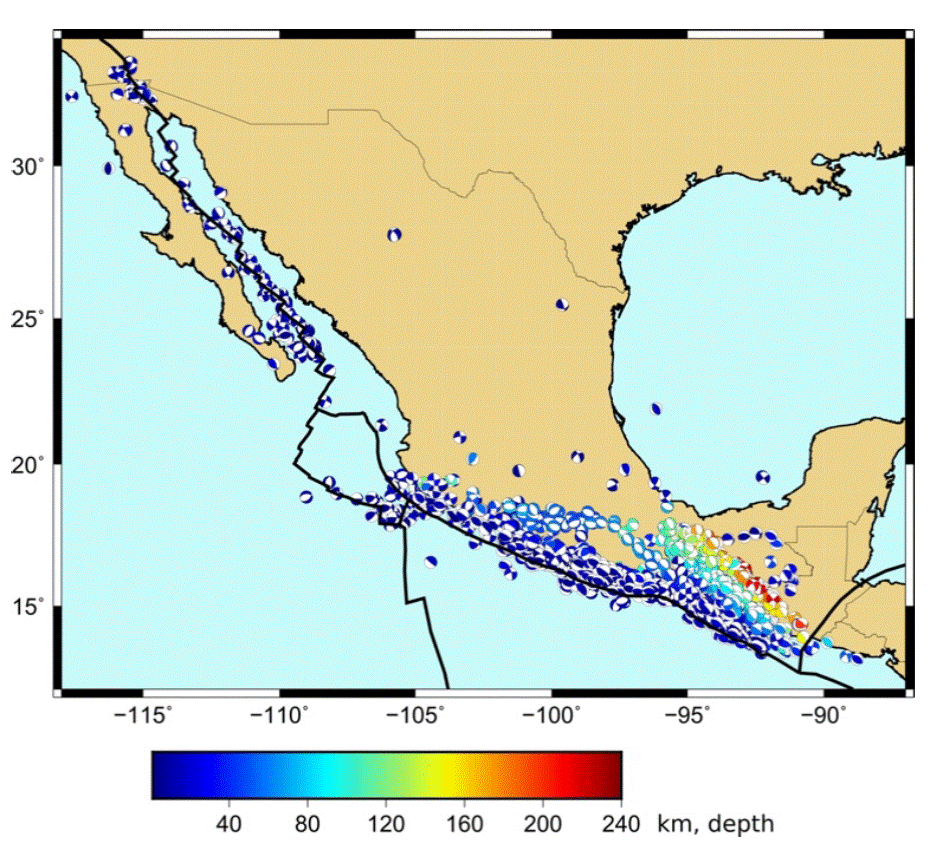
Figure 13 Focal mechanisms reported in the RMMT database. The color of beach balls is keyed to the depth obtained from grid search procedure.
3.1 Pacific-North America boundary
The northwestern part of Mexico (Gulf of California) is characterized by a divergent-transcurrent tectonic regime. This type of plate boundary is mainly distinguished by shallow, normal and strike-slip faults. Most of the seismicity contained in our database for the Gulf of California and the Peninsula of Baja California shows shallow-strike slip and shallow-normal faults and a combination of both. However, in Figure 13 it is possible recognize some reverse faults suggesting a complex tectonic setting (e.g. Wong and Munguia, 2006; Mungía et al., 2006).
3.2 Rivera-Cocos- North America tectonic contact
The Gordo Graben subduction under North America, a triple junction zone (Chapala, Colima and Tepic-Zacoalco rifts) and the Jalisco Block on the continental plate, together with the pure subduction of the Rivera plate, implies a very complex tectonic setting, which is in agreement with the focal mechanisms. It is possible to distinguish normal, strike-slip and thrust faults. The sparse station distribution in this area does not permit to obtain many MTS for medium or small earthquakes. The presence of many shallow earthquakes along the Rivera-Cocos limit is remarkable, indicating a large stress concentration. Another important feature is the intermediate-depth seismic activity (~100 km) very close to the coast. The occurrence of this type or earthquakes is in agreement with the geometry described by Pardo and Suárez (1995) and Manea et al. (2013).
3.2 Cocos-North America boundary
Seismicity at the boundary between Cocos and North America plates (offshore) shows predominance of thrust faults, but vertical and normal faults also occur. An example of this type of seismicity is the event number 1 in Table 3. Inland seismicity, in central and southern Mexico, is characterized by intermediate-depth normal faults occurring in the subducted Cocos plate. A sharp change in seismicity depths occurs to the east of 96° W, where earthquakes become deeper, indicating an abrupt change in the geometry of the subducted Cocos plate. An evident lack of seismicity is observed in a wide region between ~100-97° W and ~16-17° N where it is possible to distinguish two different bands of seismicity. In this region, thrust shallow and steeply dipping thrust events are located close to the coast, and normal and deepest focal mechanism can be found in the second band of seismicity. The same observation was made by Pacheco and Singh (2010) from a very careful analysis of seismicity of this zone.
3.3 North America stable zone
Of special interest in the estimation of the probabilistic seismic hazard analysis (PSHA) are the non-clustered events in the Gulf of Mexico and northern Mexico. In this case, it is possible to distinguish shallow faults of different mechanisms.
Even if only the solutions for VR ≥ 60%, 70% and 80% are considered (appendix section, Figure S-3), the tectonic features observed remain the same.
Database description and webpage
All the MTS that were calculated and yielded solution, independent of VR values, are saved in a database (mysql). In order to make this information accessible to public, we have developed a set of php scripts and a website: http://132.248.6.13/cmt. However, we consider important that the public database be only the RMMT catalog.
Inspired on the GCMT catalog, we offer four different format outputs:
Conclusions
The main contribution of this work is the RMMT database, with more than 1,500 solutions for local events. For many of these events it is the only source of information. The criterion proposed to include the MTS in the RMMT gives reliability to the catalog, even when Mw estimated here is, on average, underestimated with respect to that reported by the GCMT.
The number and quality of MTS have been increased through time, in concordance with the SSN network development.
The number of solutions is significantly less than the number of events reported by SSN; the reason is that the records used for inversion have to fulfil several strict criteria. For example the length of the record: for the moment tensor inversion, we need at least 120 s; in contrast, for location estimation 30 s or one minute is enough.
In the geographical zones with a dense station coverage, there are more solutions and, proportionally, a better quality of resolution. In some areas, such as the Guerrero coast, there are many MTS with magnitude smaller than 4.0.
The events located in central-south Mexico show small K value between GCMT vs. RMMT.
The different tectonic environments of Mexico are well represented by the solutions reported in the RMMT. This permits identification of anomalous seismicity, that is, earthquakes that are not expected in the tectonic regime, for example the shallow, normal fault earthquake of October 8th, 2001 (Mw=5.8), or the event recorded at the Gulf of Mexico (May 23th 2007, Mw=5.7).
Database and free access via website could give an opportunity to get MTS of small to medium local earthquakes, useful information that is not available from international agencies.
The AMTP is a very useful tool to be continuously fed with new events and increase the RMMT catalog.


 nueva página del texto (beta)


