


 nueva página del texto (beta)
 Inglés (pdf)
 Artículo en XML
 Referencias del artículo
 Enviar artículo por email
 Citado por SciELO
  Similares en
SciELO
Similares en
SciELO 
 Permalink
INTRODUCTION
Lung cancer (LC), a malignant tumor originating from the bronchial mucosa or glands in the lungs, is one of the major malignancies posing a significant threat to human health and life1. Conventionally, small-cell LC (SCLC) and non-SCLC (NSCLC) are two major types of LC, with approximately 85% of LC cases being NSCLC2. Among the various subtypes, lung squamous cell carcinoma (LUSC) is one of the most prevalent subtypes, accounting for approximately 30% of all NSCLC patients3. Smoking is the primary risk factor, as chemical substances in tobacco smoke can induce and accelerate the malignant transformation of lung cells4. Other factors include long-term exposure to air pollution, occupational exposure to asbestos, radioactive materials, or certain chemicals, as well as a family history of LC. Treatment options for LUSC include surgical resection, chemotherapy, immunotherapy, and targeted therapy5. The prognosis for LUSC is generally poor, as the majority of patients are diagnosed at an advanced stage, and currently, there are no specific targeted drugs available for this disease, which limits treatment options to some extent6. Early prediction can help physicians identify potential risks or disease progression trends that patients may face, enabling the formulation of earlier preventive strategies. Therefore, exploring prognostic markers with higher sensitivity and accuracy so as to improve the prognosis of LUSC patients is of great necessity.
Accounting for 40-70% of all human white blood cells, neutrophils (NE) are the most abundant type of granulocyte and the first line of defense in the innate branch of the immune system7. The abundance of NE in tumor tissue has connections with poor prognosis8, suggesting that high levels of NE may be related to tumor progression and malignancy. Research by Zhou et al.9 demonstrated that the direct interaction between NE and tumor cells leads to the release of inflammatory mediators, which may promote tumor growth in NSCLC. Tsukioka et al.10 pointed out that an increased ratio of NE to lymphocytes is an independent adverse prognostic factor for LUSC patients undergoing surgical resection, with considerably elevated disease recurrence rates and poorer outcomes. NE are also associated with immunotherapy in cancer patients. Soda et al.11 observed a negative correlation between the drug response and the NE-related index after nivolumab treatment for NSCLC patients. Therefore, NE-related genes may be prognostic features for LUSC patients.
The purpose of our study was to construct a prognostic risk model to predict the survival rate of LUSC patients. We identified 12 NE-related genes through statistical and bioinformatics methods based on the cancer genome atlas (TCGA) dataset, constructed a prognostic model, and validated it using the gene expression omnibus (GEO) dataset. Subsequently, we investigated the correlation of the model with immune cell infiltration and the prediction of immunotherapy response in LUSC patients. It is expected that our findings from this study may provide valuable assistance in LUSC prognosis and treatment.
METHODS
Data source and preprocessing
The messenger RNA (mRNA) expression data of LUSC patients, with 51 normal samples and 501 tumor samples, were successfully obtained from the TCGA database (https://portal.gdc.cancer.gov/). The standardization of TCGA mRNA expression and clinical data involves the following steps: (1) mapping mRNA expression data to human genome annotation files, replacing Ensemble IDs with gene names, and deleting genes that were not successfully mapped; (2) standardizing mRNA expression data; and (3) extracting clinical information using Perl language scripts, including sample ID, overall survival (OS) in days, survival status, age, as well as grading and staging (T, M, and N staging). As an independent validation set, the GSE74777 microarray data were obtained from the GEO database (https://www.ncbi.nlm.nih.gov/geo/). The gene annotation platform is GPL17586, from where gene expression data and clinical information were extracted for subsequent analysis. The previous studies12-16 were reviewed, and after removing duplicates, 198 NE-related genes were obtained (Table S1).
Subtype identification
The "edgeR" package17 was employed to perform differential expression analysis on both cancer samples and LUSC samples (FDR < 0.05 and |log(FC)|>1). The intersection of NE-related genes and LUSC differentially expressed genes (DEGs) yielded NE-related DEGs. The K-means algorithm was utilized to classify LUSC tumor samples based on the expression profile matrix of NE-related DEGs. Based on the NE-related differential gene expression profile matrix, we used the R software package "ConsensusClusterPlus" (https://www.bioconductor.org/packages/release/bioc/html/ConsensusClusterPlus.html) to perform K-means consistency clustering analysis on LUSC samples and create clustering result graphs for each K value (integer K, 2≤K≤10) separately. Unsupervised clustering is defined as follows: Clustering algorithm (clusterAlg = “km”), maximum number of clusters (max K = 10), number of resamples (reps = 1000), sampling rate (pItem = 0.8), feature sampling rate (pFeature =1 ), and clustering distance (distance = “Euclidean”). Subsequently, PCA clustering analysis was performed on LUSC. We utilized “survival” package (https://www.bioconductor.org/packages/devel/bioc/vignettes/survtype/inst/doc/survtype.html#clinical-data-alone) to do survival analysis so as to assess the survival differences among the identified subclasses.
Construction of the prognostic model
Differential analysis was conducted pairwise between clustered samples (|logFC|>1.0, FDR<0.05), and the resulted DEGs between clusters were intersected and used for subsequent analysis. Clinical data of patients were merged with the expression levels of the intersected DEGs, and LUSC patient samples with a survival time of more than 30 days were selected. Subsequently, the “survival” package was employed to perform univariate Cox regression analysis on the intersected DEGs. Genes associated with survival were selected based on a p < 0.05. To prevent overfitting, the “glmnet” package (https://mirrors.tuna.tsinghua.edu.cn/CRAN/web/packages/glmnet/index.html) was applied to accomplish LASSO analysis. We employed cross-validation to select an appropriate penalty parameter lambda. This step helped eliminate genes highly correlated with other candidate genes, reducing model complexity and improving its generalizability. Finally, we employed the “survival” package to perform multivariate Cox regression analysis on the candidate genes selected by LASSO, thus constructing a comprehensive prognostic model. Riskscore model was built using the following formula:
The n represents the total number of genes, Χi represents gene expression FPKM value, and βi represents the multivariate Cox regression coefficient.
Performance evaluation of the model
According to the expression levels of each gene and its corresponding risk coefficient, we calculated the risk score of each patient in the TCGA and GEO datasets and grouped the samples into high-risk (HR) and low-risk (LR) groups with the median risk score as a threshold. We employed the “Survival” and “survminer” (https://mirrors.tuna.tsinghua.edu.cn/CRAN/web/packages/survminer/index.html) packages to draw risk score distribution plots, survival status distribution plots, and survival curves for the HR and LR groups. A heatmap was created to visually display the expression differences of each prognostic gene in the two groups. The “timeROC” (https://mirrors.tuna.tsinghua.edu.cn/CRAN/web/packages/timeROC/index.html) package was applied to plot receiver operating characteristic (ROC) curves for the risk scores and calculate the area under the curve (AUC) values at 1 year, 3 years, and 5 years. These values could provide us with an assessment of the model´s predictive accuracy at different time points. With the use of the “pheatmap” package, we plotted a heatmap that visually displays the expression differences of each prognostic gene between high- and LR groups. The same steps were performed on the GEO validation set to understand the effectiveness of the model in different datasets.
Independent prognostic analysis
Combining clinical information with the prognostic model risk scores, univariate and multivariate regression analyses were performed on the samples to evaluate whether the model maintained its predictive ability when considering other clinical features. Corresponding forest plots, derived from the results of regression analyses, were generated to present the impact and significance of each factor. We created a nomogram using the “rms” package (https://cran.r-project.org/web/packages/rms/index.html). Calibration curves were used to depict the predicted survival rates at 1 year, 3 years, and 5 years for the patients to investigate the predictive performance of the nomogram.
Immune analysis
The single sample gene set enrichment analysis (ssGSEA) is a commonly used method for immune cell infiltration analysis, which estimates the relative enrichment of each gene set in the sample by comparing the gene expression data of each sample with the immune cell gene set18. The “GSVA” package (https://www.bioconductor.org/packages/release/bioc/html/GSVA.html) was utilized for ssGSEA analysis to plot heatmaps of immune cell infiltration and immune functional scores for the HR and LR groups. CIBERSORT is an algorithm used to estimate the relative abundance of different cell types in complex mixed tissues. Based on known cell type gene expression matrices and sample gene expression data, it calculates the relative proportion of each cell type in the sample through methods such as non-negative matrix factorization19. We used the CIBERSORT algorithm to evaluate the proportion of 22 immune cell subtypes at HR and LR, and box plots were generated. The “ESTIMATE” package (https://bioinformatics.mdanderson.org/estimate/rpackage.html) algorithm was applied to evaluate the ESTIMATE score, immune score, stromal score, and tumor purity. Wilcoxon test was performed, and violin plots of HR and LR groups were created.
Prediction of immunotherapy response
We employed the Wilcoxon test to statistically analyze expression levels of immune checkpoint genes in HR and LR groups and presented results with box plots. We downloaded the tumor immune dysfunction and exclusion (TIDE) scores of TCGA-LUSC patients from the TIDE database (http://tide.dfci.harvard.edu/), performed Wilcoxon tests on the TIDE scores of HR and LR groups, and plotted violin plots. From the cancer immunohistochemical atlas database (https://tcia.at), the IPS scores of TCGA-LUSC patients were downloaded. The Wilcoxon test was performed on the IPS scores of high- and LR groups, with violin charts generated.
Drug prediction
CellMiner (https://discover.nci.nih.gov/cellminer/) is a database used for cancer cell line research, aiming to provide molecular characteristics, drug responses, and gene expression information of cancer cell lines20. We obtained RNA expression data (RNA: RNA seq) and drug data (Compound activity: DTP NCI-60) from the CellMiner database. R language was used to calculate the Pearson correlation coefficient between the expression of each prognostic gene and different drugs. After the screening, the final results were visualized using the “ggplot2” package (https://mirrors.tuna.tsinghua.edu.cn/CRAN/web/packages/ggplot2/index.html.
Statistical analysis
All statistical analyses in this study were conducted using R 4.2.3 (https://www.r-project.org/). The Wilcoxon test was applied to analyze variables that did not follow a normal distribution. The correlation between two continuous variables was examined through Spearman´s correlation analysis. The statistical significance is set to p < 0.05.
Results
Identification of subtypes in TCGA-LUSC patients
Differential analysis was performed on the gene expression profile data of TCGA-LUSC patients (|logFC|>1, FDR <0.05), resulting in 7194 DEGs in LUSC (Table S2). The intersection of LUSC DEGs with NE-related genes yielded 121 NE-related LUSC DEGs (Fig. 1A). Based on NE-related LUSC DEGs, K-means consistency clustering was performed on LUSC tumor samples. The results uncovered that when K=3, the sample clustering was optimal, and the sample clustered into three clusters (Fig. 1B and C). To validate the K-means results, we conducted PCA clustering, finding that the samples were clustered into three clusters. We conducted a survival analysis on these three clusters, revealing that among the three clusters, the survival rate of cluster-2 was considerably higher, while the survival rate of cluster-3 was considerably lower (p < 0.05) (Fig. 1E).
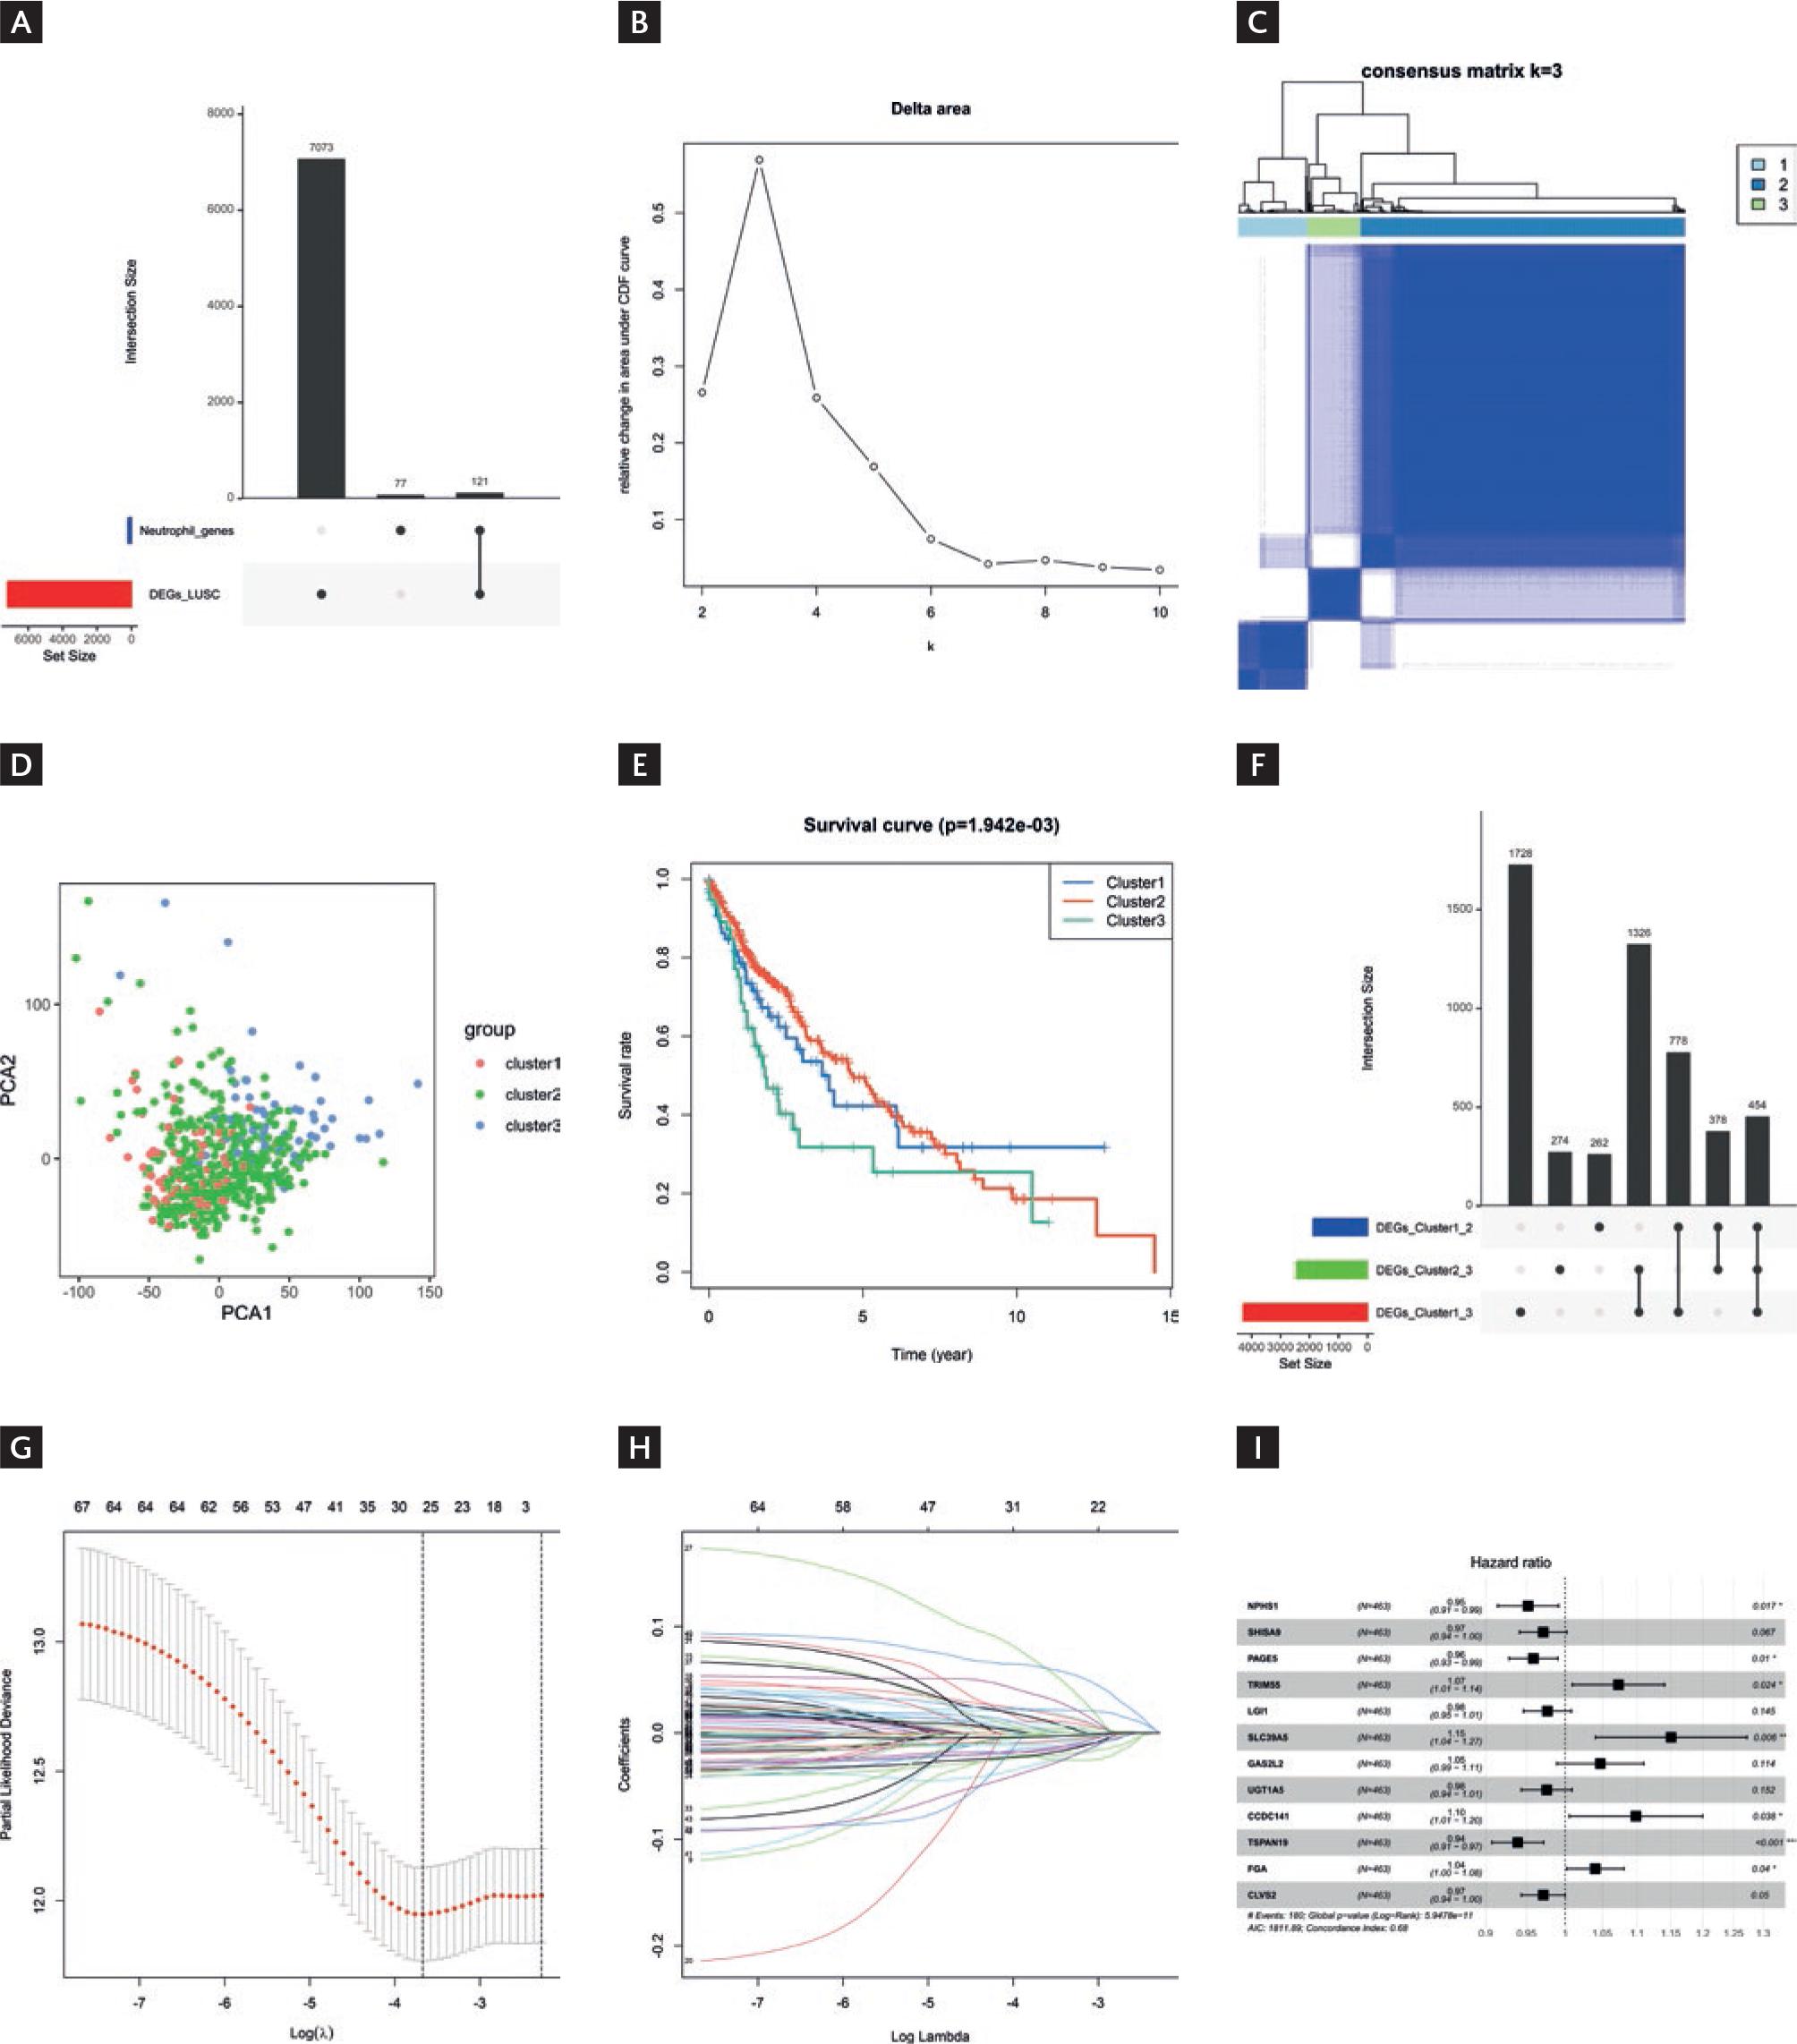
Figure 1 K-means clustering of LUSC patients and construction of the prognostic model. A: intersection of LUSC differentially expressed genes with neutrophils-related genes. B: relative changes in the area under the cumulative distribution function curve. When K=3, the relative change in area is small, indicating that the clustering results are relatively stable under this number of clusters. Therefore, K=3 is chosen as the optimal number of clusters. C: a consensus clustering matrix with K=3, where different colors represent different clusters. D: PCA analysis of three clusters. E: survival differences between clusters. F: UPset plot demonstrated the cluster-intersecting genes. G: coefficient distribution generated for the logarithmic (λ) sequence in the LASSO model. The image is displayed in the Log (λ) = At 26 o´clock, the coefficient distribution of the model demonstrated the best feature selection effect. H: LASSO coefficient spectrum for LASSO analysis. Different colored lines represent different genes. I: Forest plot of the multivariate Cox analysis.
Construction of the prognostic model
We conducted detailed differential analysis for different clusters, including cluster-1 versus cluster-2, cluster-1 versus cluster-3, and cluster-2 versus cluster-3. The intersection of these three sets of DEGs resulted in a total of 454 cluster-intersecting genes (Fig. 1F). We associated the gene expression with patient survival and identified 68 candidate genes closely linked to patient survival (p < 0.05) (Table S3). Afterward, LASSO analysis was conducted on the candidate genes, resulting in the selection of 26 genes (Fig. 1G and H). Subsequently, we carried out a multivariate Cox regression analysis on the LASSO-selected genes, leading to the final selection of 12 prognostic genes for constructing the prognostic model:
Riskscore = −0.0491*NPHS1 −0.0292*SHISA9 −0.0422*PAGE5 + 0.0706*TRIM55 −0.0236*LGI1 + 0.1405*SLC39A5 + 0.0465*GAS2L2 −0.0246*UGT1A5 + 0.0937*CCDC141 −0.0629*TSPAN19 + 0.0398*FGA −0.0291*CLVS2 (Fig. 1I).
Validation of the prognostic model
We classified patients into HR and LR groups with a threshold of median risk score (Fig. 2A). Further analysis of survival status distribution and Kaplan-Meier analysis demonstrated remarkably shorter survival time and higher risk of death in the HR group (Fig. 2B and C). ROC curves were generated, and the AUC at different time points (1 year, 3 years, and 5 years) was calculated. The model achieved AUC values of 0.7, 0.73, and 0.75, respectively (Fig. 2D), indicating good predictive ability for survival. The heatmap of gene expression levels revealed that CCDC141, FGA, TRIM55, GAS2L2, and SLC39A5 exhibited relatively higher expression in the HR group, whereas SHISA9, UGT1A5, TSPAN19, PAGE5, LGI1, NPHS1, and CLVS2 exhibited relatively higher expression in the LR group (Fig. 2E). In summary, our model had a certain degree of reliability and stability.
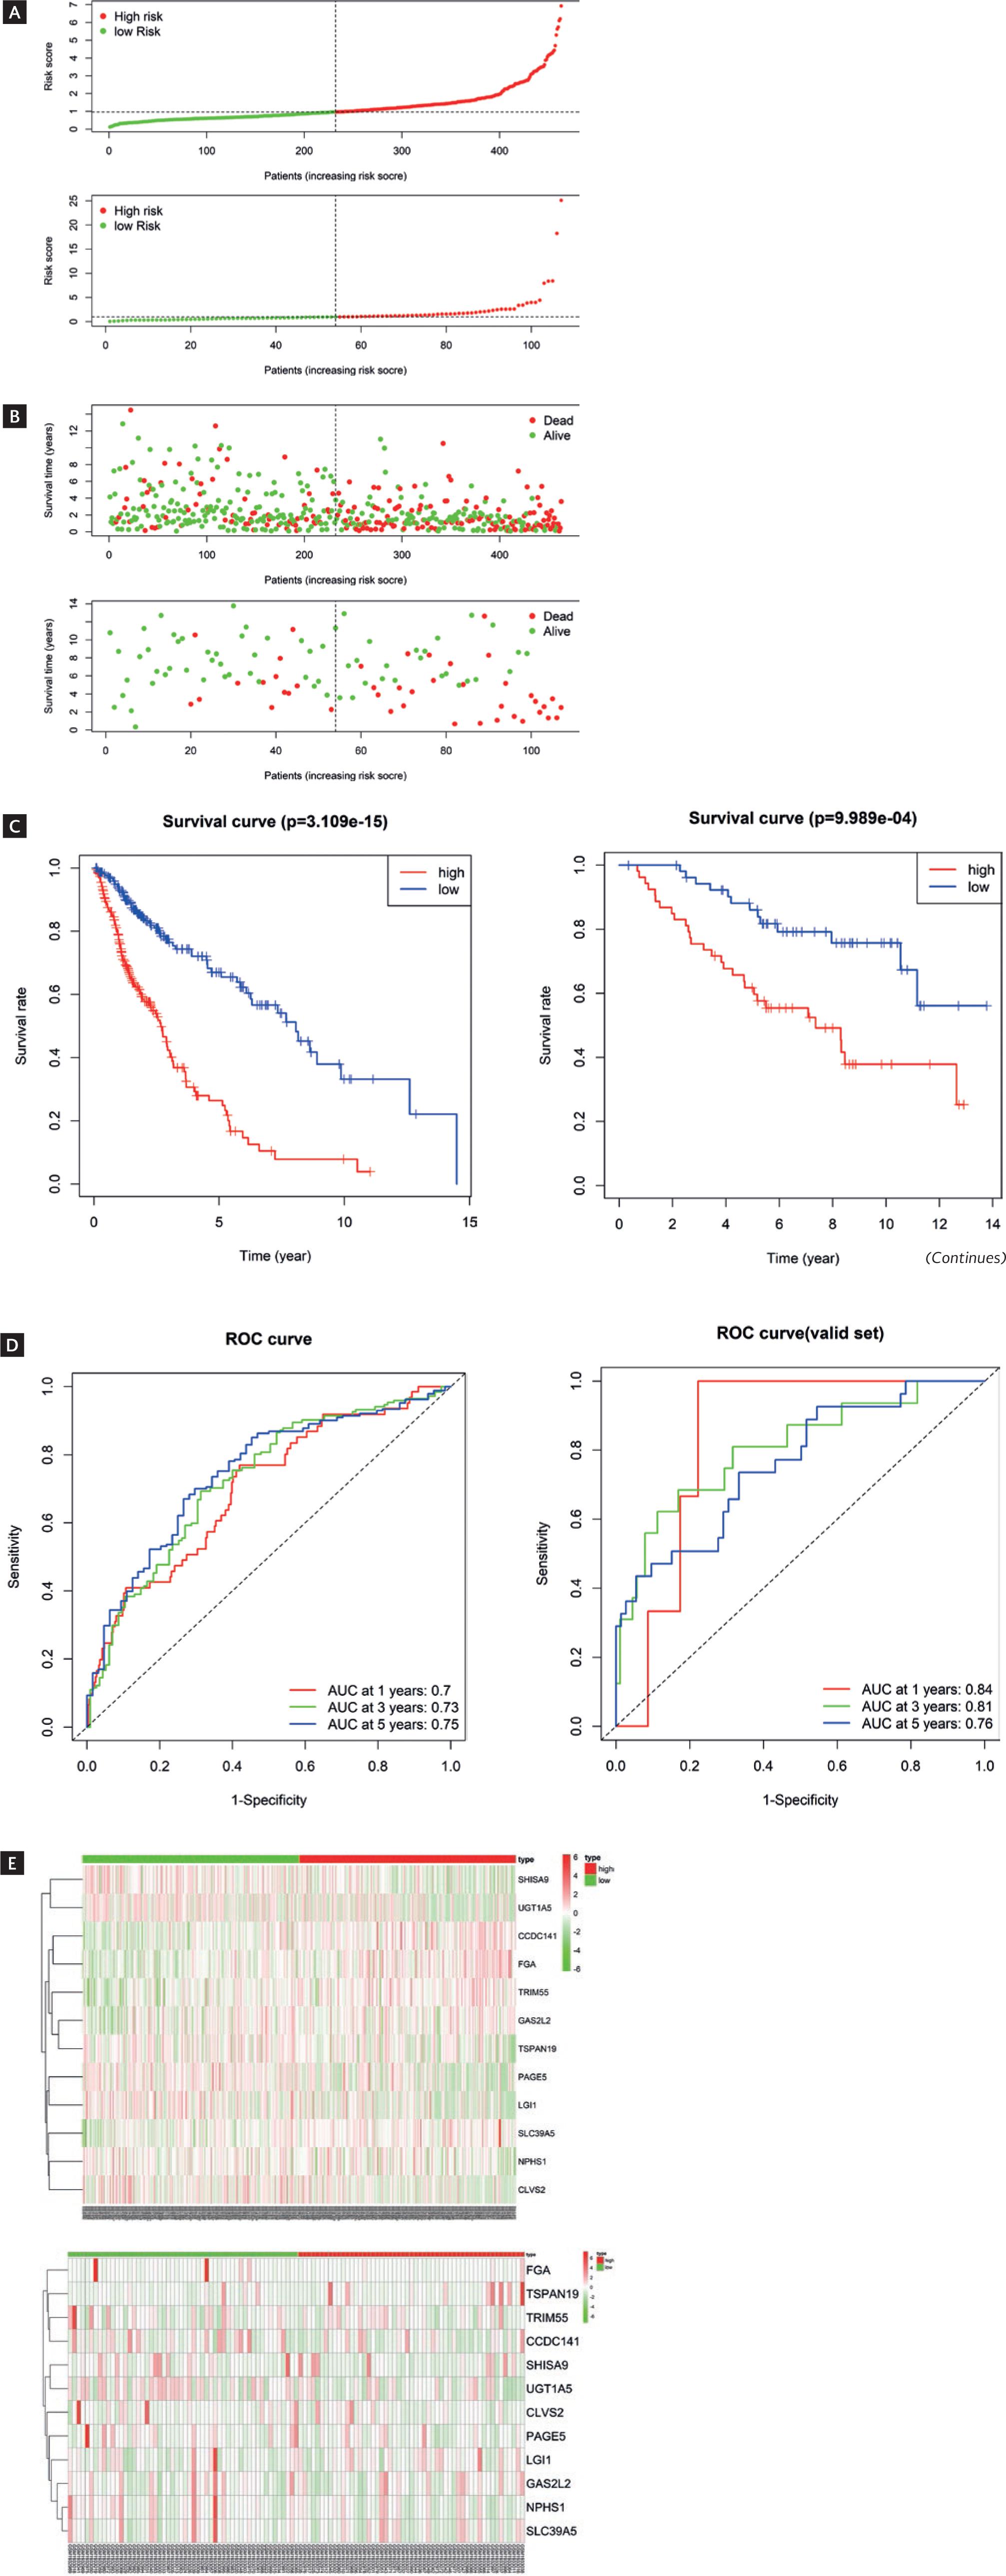
Figure 2 Construction of validation of the prognostic model. A: distribution of risk scores and survival status (B) for HR and LR patients. C: Kaplan-Meier curves for HR and LR patients. D: heatmap displayed the expression levels of 12 prognostic genes in LUSC. E: ROC curves based on TCGA dataset. (Continues)
Clinical significance and nomogram of prognostic features
Based on the clinical information of LUSC patients (age, gender, stage, T stage, N stage, M stage, and riskScore), a univariate Cox regression analysis was conducted on the risk score and clinical information. It was found that stage, T stage, and riskScore were statistically significant (p < 0.05) (Fig. 3A). Subsequently, multiple factor Cox regression analysis was conducted, finding that the risk score was considerably significant (p < 0.05) (Fig. 3B). These results indicated that risk score could independently predict the survival outcomes of LUSC patients, even after considering other factors. Nomograms combining clinical features and risk scores were generated to predict patient survival rates (Fig. 3C). Further, analysis revealed a close agreement between the predicted survival rates of the model and the observed survival rates at the adjusted 1-year, 3-year, and 5-year time points, as evidenced by the calibration curves (Fig. 3D-F). Overall, based on this set of nomograms incorporating 12 feature genes, our model exhibited a good ability to predict patient prognosis.
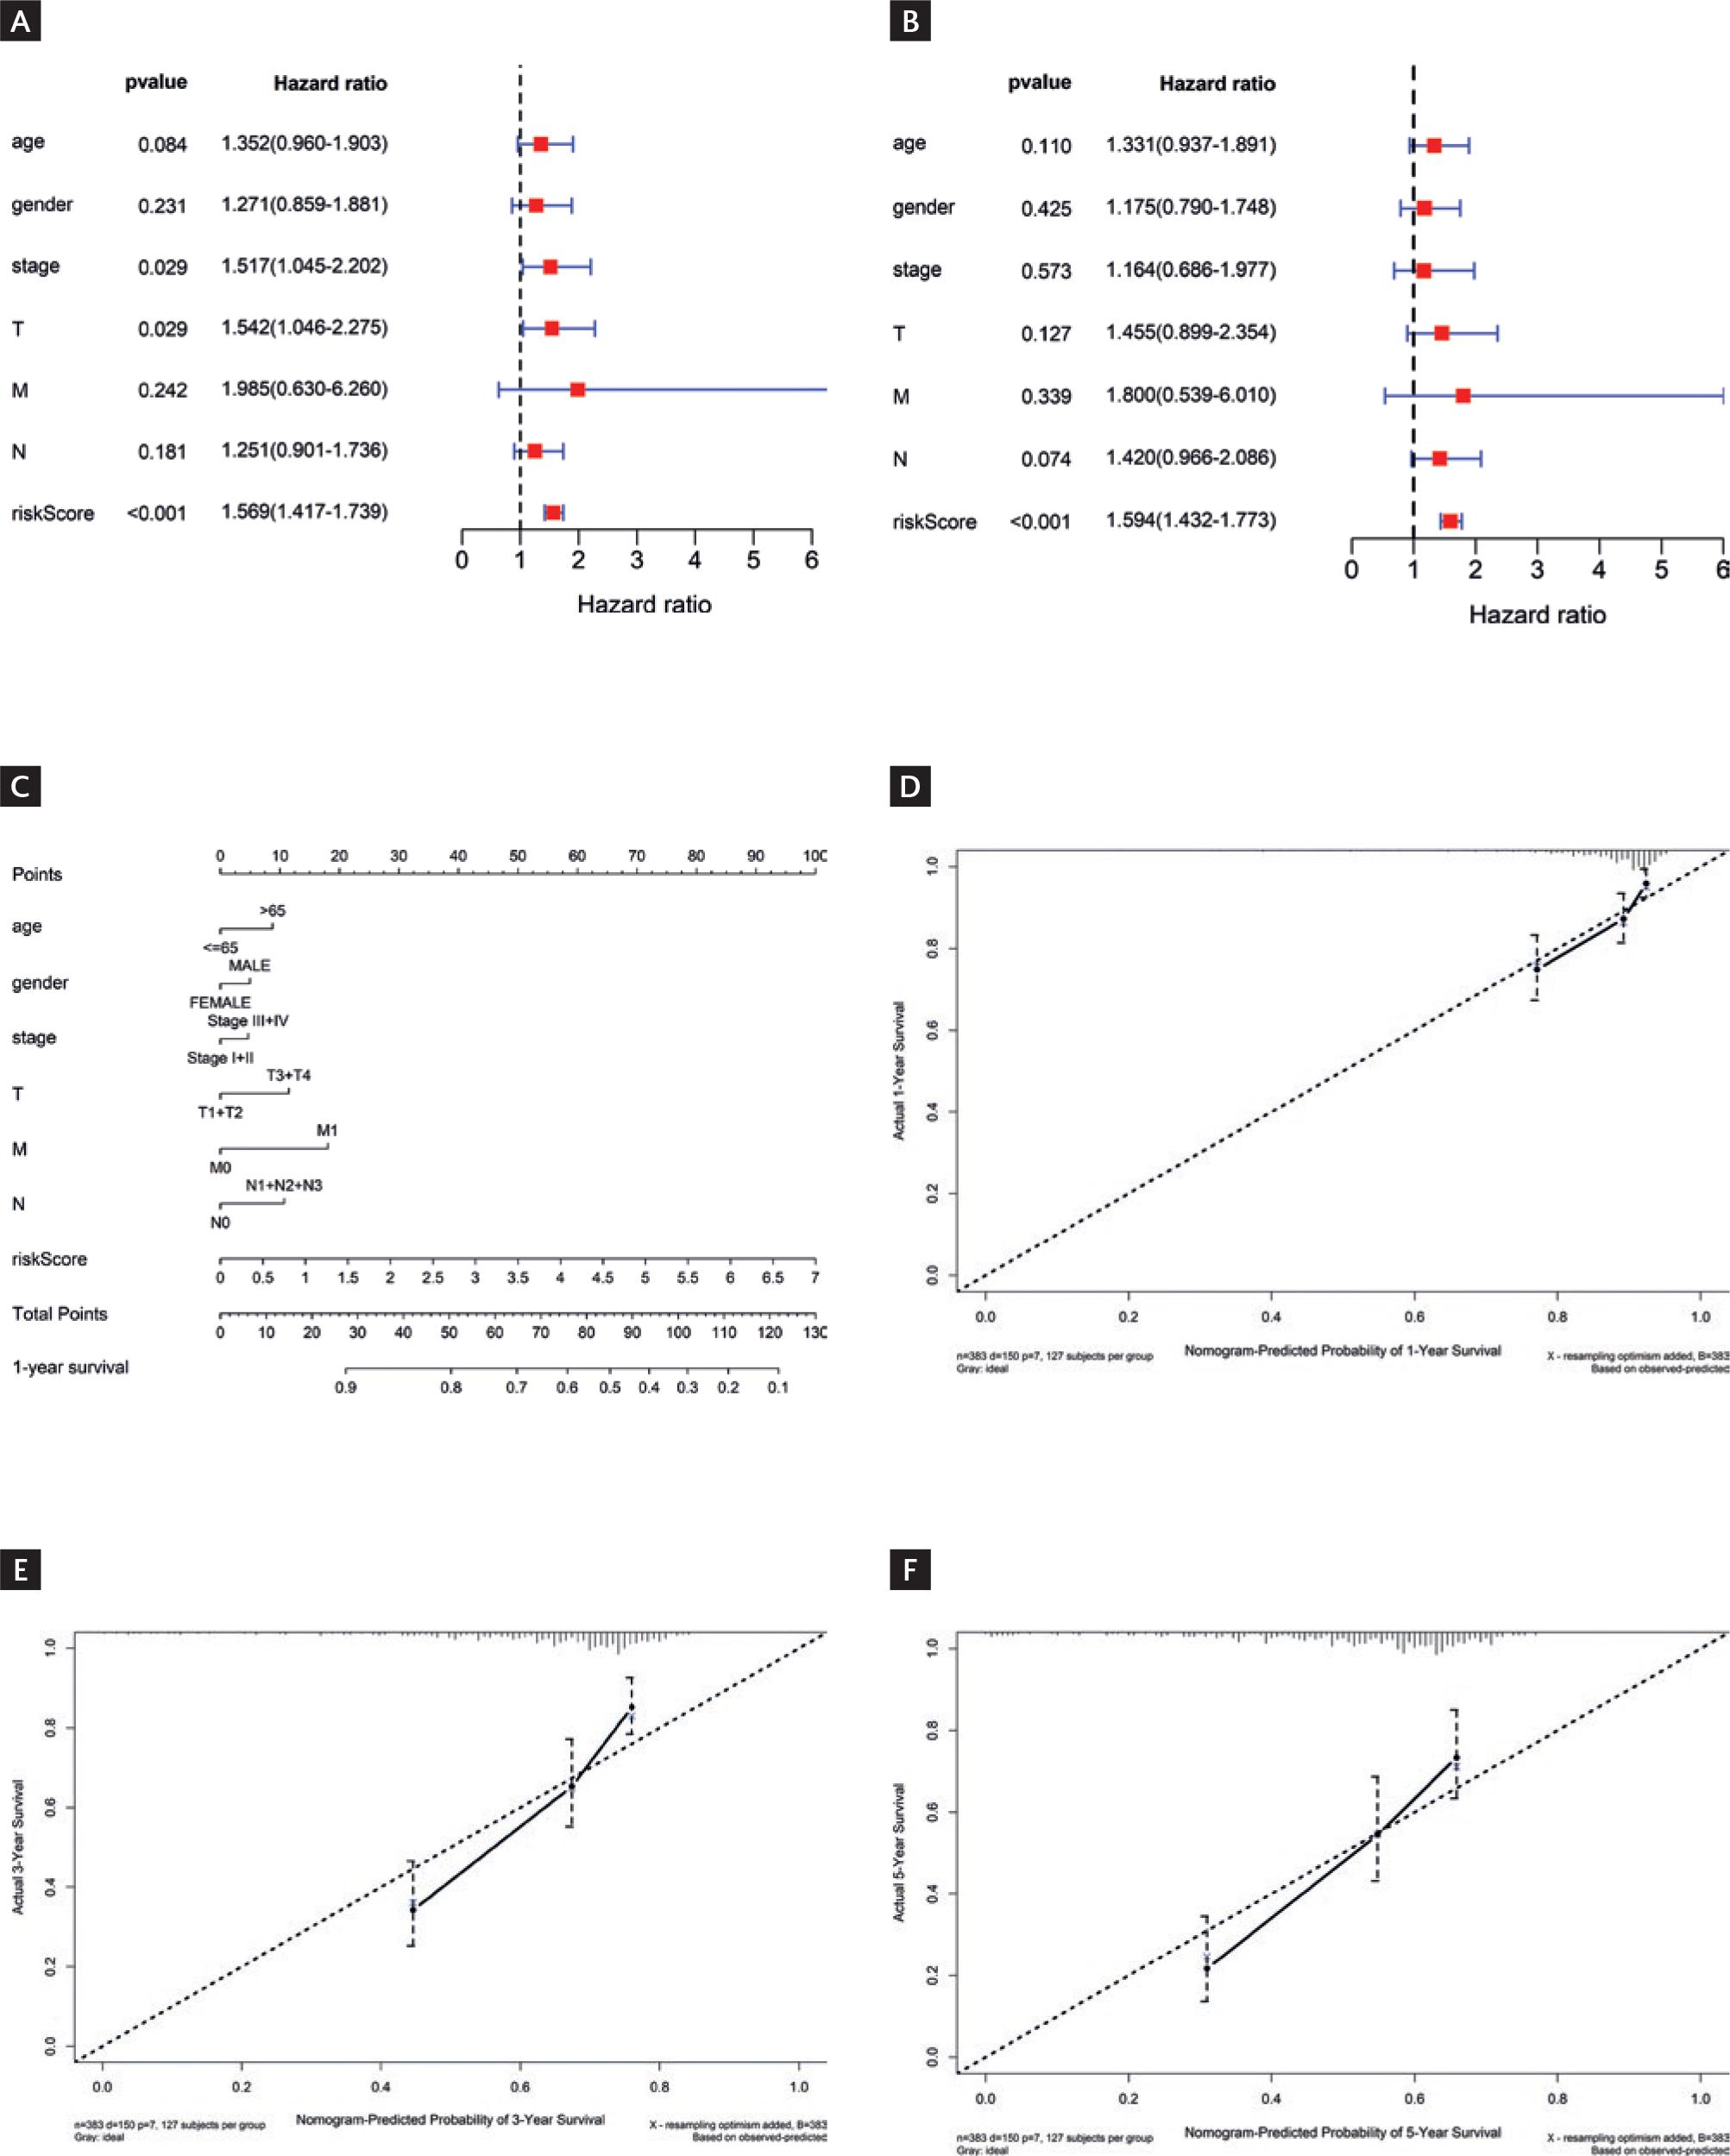
Figure 3 Independent prognostic analysis and Immune landscape analysisysis. A-B: univariate (A) and multivariate (B) Cox regression analyses results for different feature. C: nomogram combining prognostic model score and clinical information. D-F: calibration curves for risk prediction at 1 year (D), 3-year (E), and 5-year (F) time points.
Immune landscape analysis
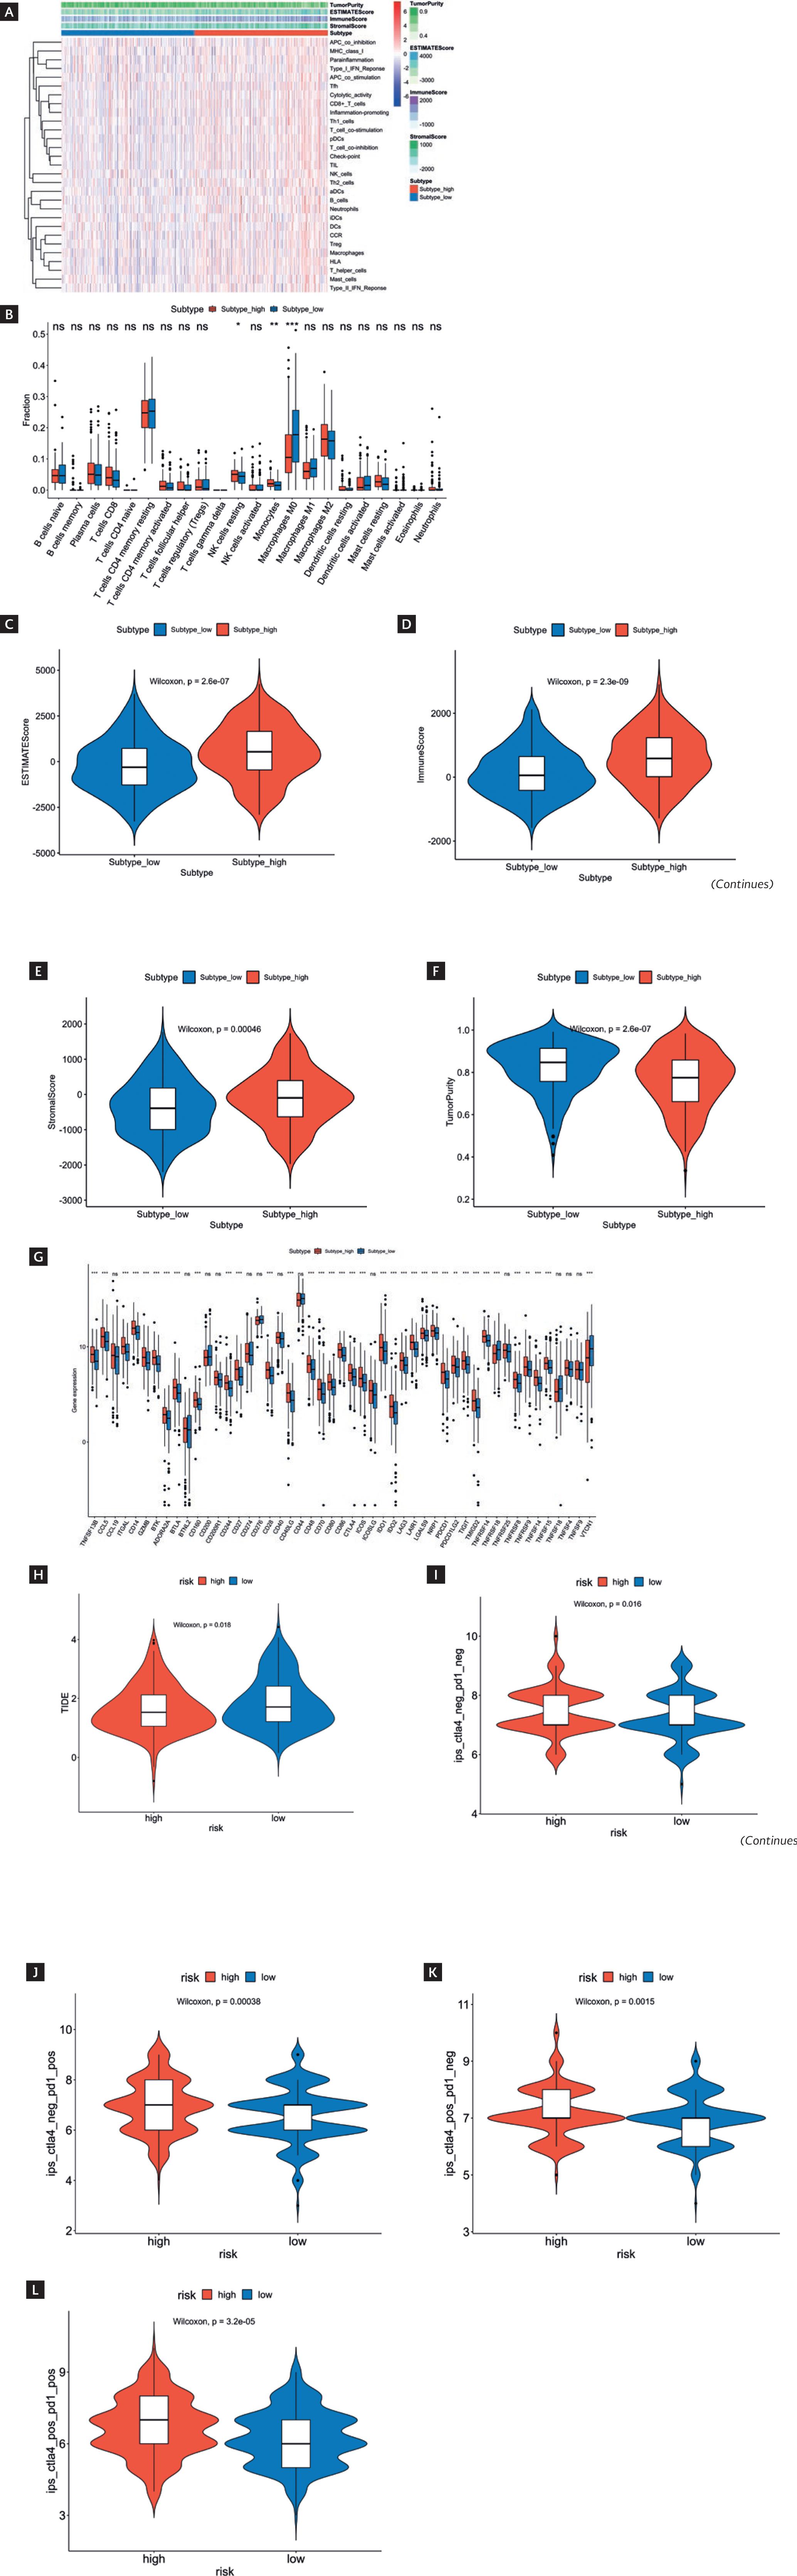
The ssGSEA algorithm was applied to calculate immune cell and immune functional scores. The heatmap results displayed that the degrees of immune cell infiltration and immune functional score were relatively elevated in the HR group while relatively low in the LR group (Fig. 4A). CIBERSORT analysis was conducted for more detailed information. The results revealed that compared to the LR group, the HR group had considerably higher infiltration levels of natural killer (NK) cells resting and monocytes while a remarkable decrease in Macrophages M0 (p < 0.05) (Fig. 4B). We applied the ESTIMATE algorithm to score the HR and LR groups, finding that compared to the LR group, the HR group exhibited greatly higher ESTIMATE scores, immune scores, and stromal scores while considerably lower tumor purity (p < 0.05) (Fig. 4C-F). These results further elucidated features of the immune system in patients belonging to different risk groups.
* Indicated p < 0.05.
** Indicated p < 0.01.
*** Indicated p < 0.001.
Figure 4 Immune landscape and immune checkpoints analysis as well as prediction of immunotherapy response in HR and LR groups. A: heatmap displayed immune cell infiltration levels and immune functional scores in HR and LR groups based on ssGSEA analysis. B: CIBERSORT algorithm analysis revealed differences in immune cells between HR and LR groups. C-F: analysis of differences in ESTIMATE scores (C), immune scores (D), stromal scores (E), and tumor purity scores (F). G: differential expression of immune checkpoint genes in HR and LR groups. H-L: difference in TIDE scores (H) and IPS (I-L) between HR and LR groups. ns indicated no significant difference. (continued)
Prediction of immunotherapy response
In the analysis of immune checkpoints, the expression levels of several immune checkpoint genes in the HR group, such as ITGAL, cytotoxic T-lymphocyte-associated antigen 4 (CTLA4), LAG3, and programmed cell death protein 1 (PDCD1), were considerably higher than LR group (p < 0.05) (Fig. 4G). Subsequently, we calculated the TIDE score and IPS, finding that the TIDE score was remarkably lower in the HR group than in the LR group (p < 0.05) (Fig. 4H), while the IPS was greatly higher in the HR group compared to the LR group (p < 0.05) (Fig. 4I-L). TIDE score is an indicator used to evaluate immunotherapy response, and a lower TIDE score indicates a lower potential for immunotherapy21. IPS is a comprehensive indicator for evaluating immune status, and a higher IPS indicates that the immune system is active22. Therefore, the decrease in TIDE score and increase in IPS in HR group patients may reflect their relative resistance to immunotherapy and overactivation of the immune system.
Drug prediction
The CellMiner database was utilized to predict the relationship between feature genes and drug sensitivity, uncovering an extremely significant negative correlation between the expression of TRIM55 and the IC50 values of Vinorelbine, PKI-587, Paclitaxel, and Vinblastine (Cor<−0.5, p < 0.001). The expression of SHISA9 had a negative correlation with the IC50 value of Vinorelbine. The expression of CCDC141 showed an extremely significant positive correlation with the IC50 value of PX-316 (Cor <−0.5, p < 0.001) (Fig. 5). Taken together, these drugs may be beneficial for the treatment of LUSC patients with different prognoses.
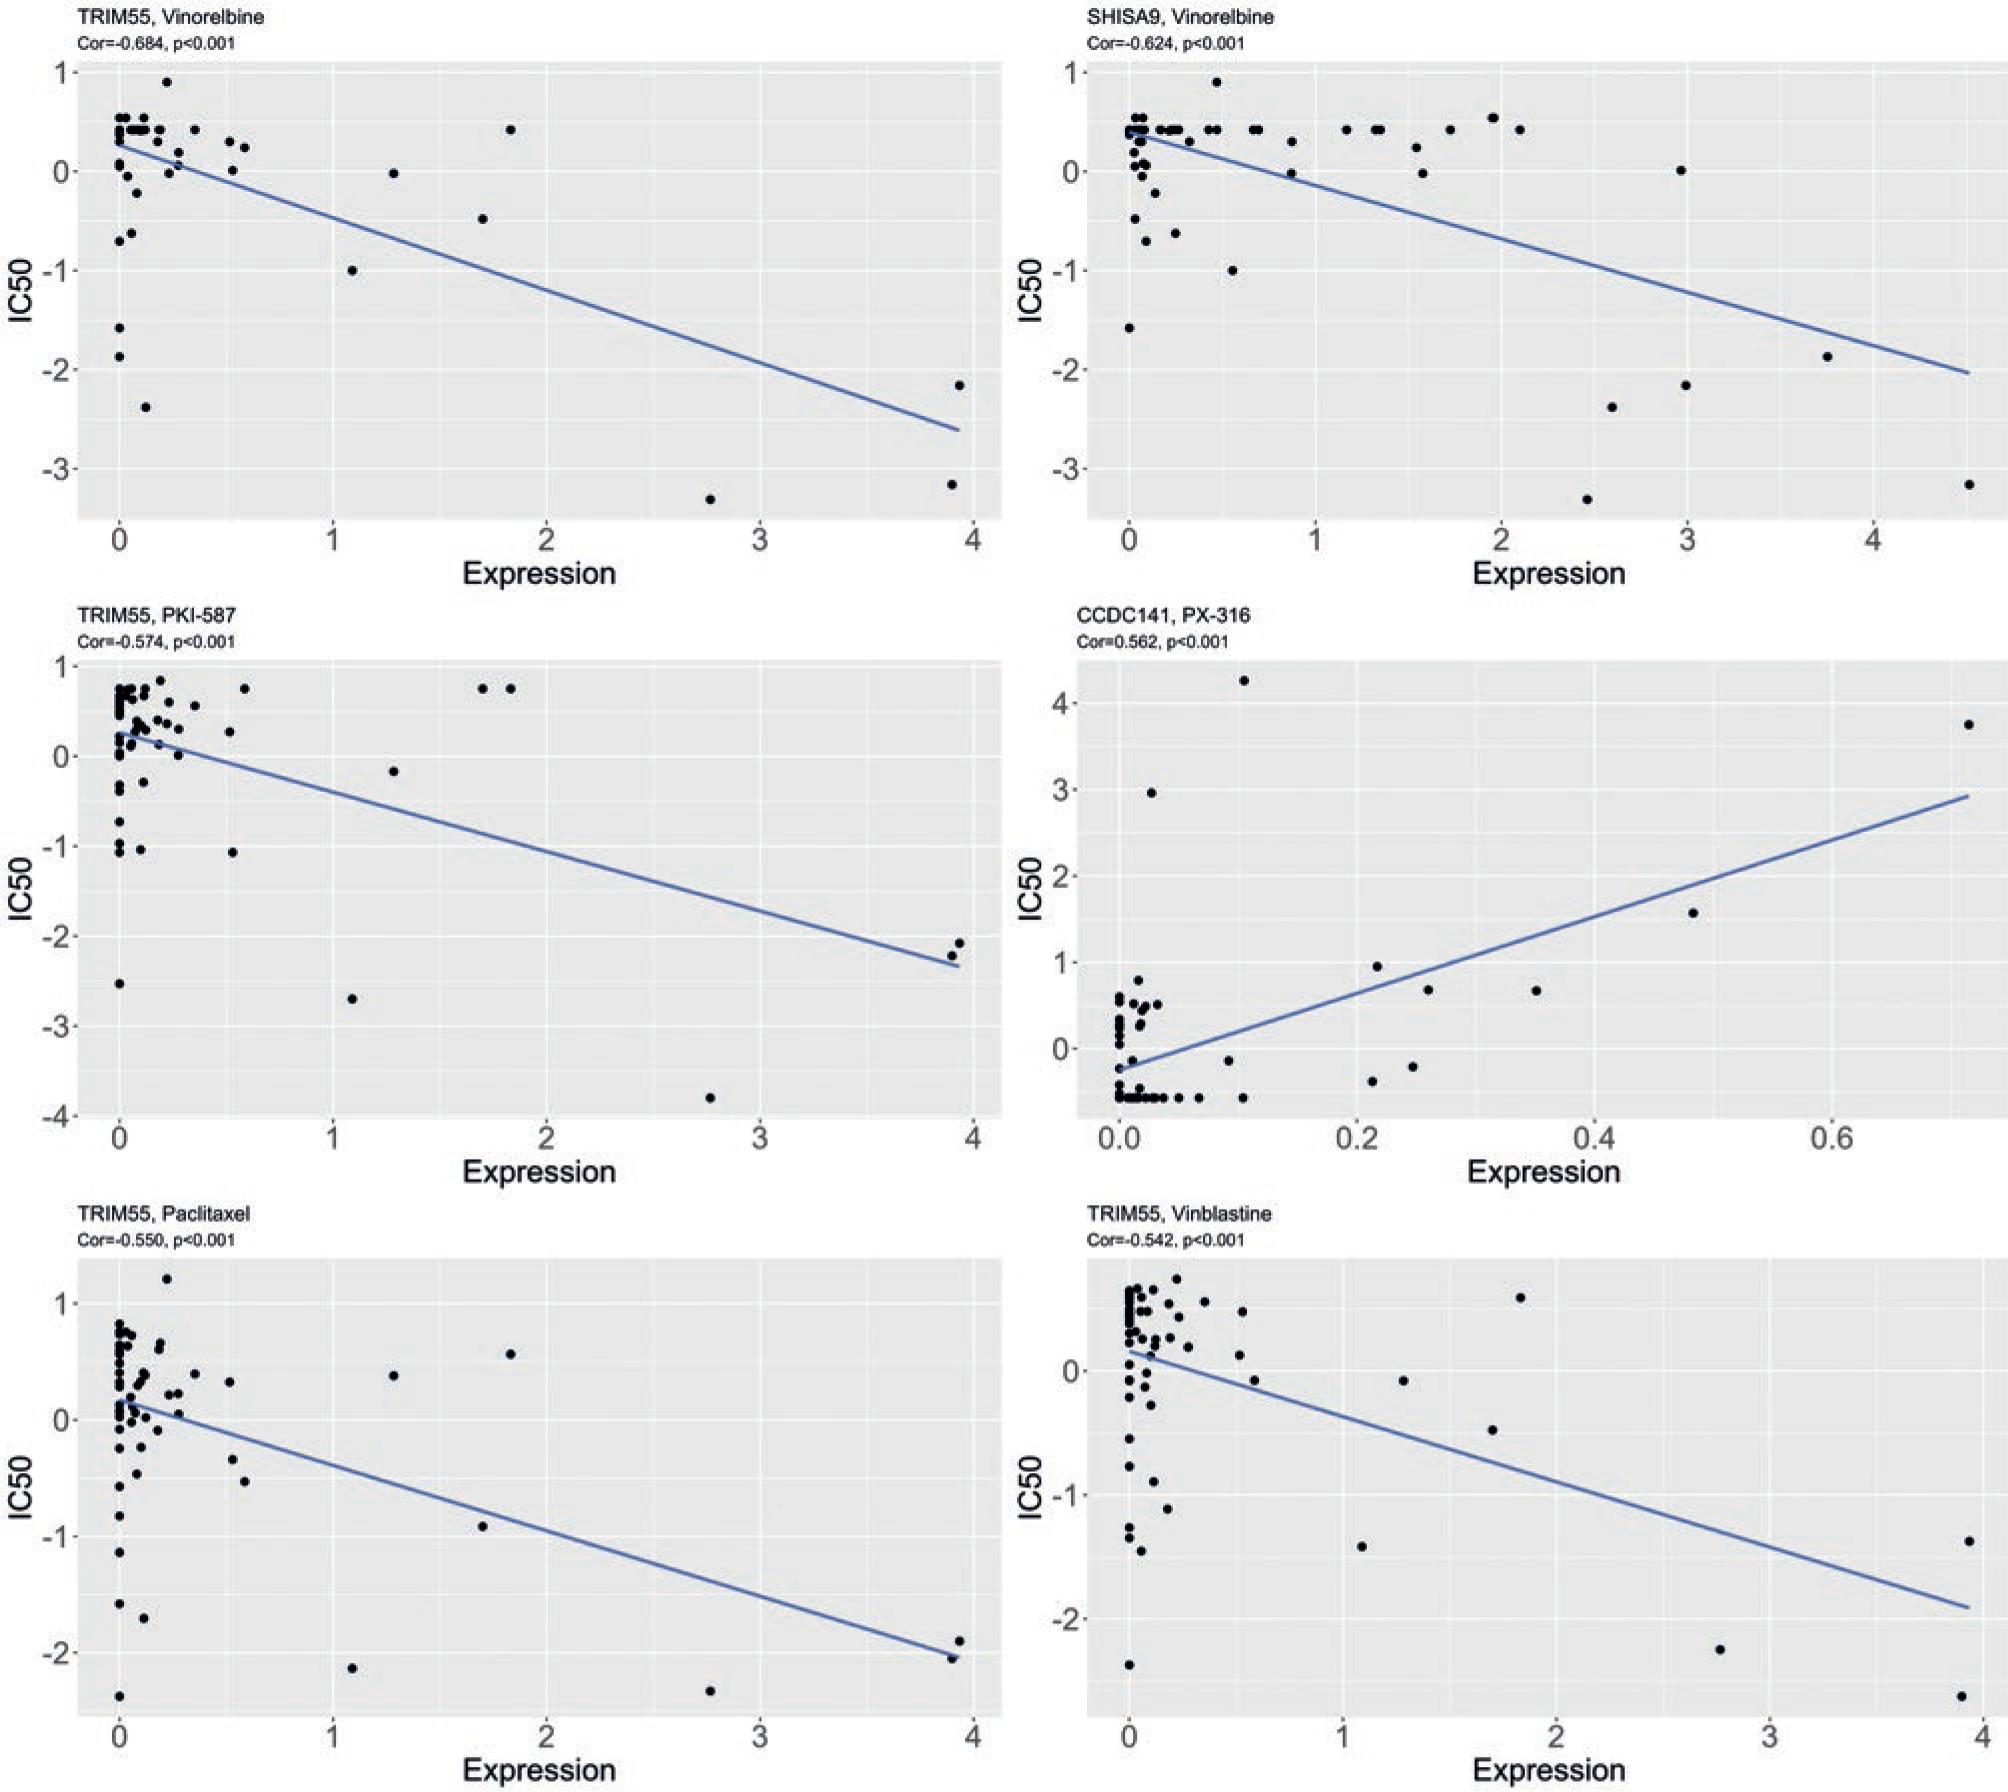
Figure 5 Correlation plot of drug sensitivity prediction using CellMiner. IC50 refers to the drug concentration required to reduce the number of surviving cells by half after medication. The lower the IC50, the more sensitive it is to the drug, and the stronger its inhibitory effect on tumor cells. The correlation coefficient Cor is between 0.1 and 0.3, indicating weak correlation; 0.3 to 0.5, indicating moderate correlation; 0.5 to 1.0, indicating strong correlation.
DISCUSSION
Despite numerous studies on LUSC, the OS rate of patients with LUSC remains low23. NE not only are attributed with the formation and maintenance of the tumor inflammatory microenvironment but also takes an extensive part in various tumor pathological processes9. In this study, by integrating TCGA LUSC data and NE-related genes and employing methods such as the K-means algorithm and univariate/multivariate Cox regression analysis, 12 genes were determined as prognostic indicators for LUSC. This model effectively distinguished patients with different prognoses and provided valuable insights into predicting patient response to immunotherapy. We conducted the first in-depth study on the prognostic role of NE in LUSC, thereby offering novel biological markers and potential therapeutic targets for the clinical prognosis of LUSC patients.
Our prognostic model comprised 12 genes: CCDC141, FGA, TRIM55, GAS2L2, SLC39A5, SHISA9, UGT1A5, TSPAN19, PAGE5, LGI1, NPHS1, and CLVS2. FGA is an extracellular matrix protein that influences blood clot formation24 and participates in tumor angiogenesis and development25. Li et al.26 put forward that FGA is upregulated in the serum of stage I LUSC patients, suggesting its potential as an early diagnostic and prognostic biomarker for LUSC. TRIM55 is an E3 ubiquitin ligase specific to the myocardium and skeleton muscle and maintains muscle development and cardiac function27. Guo et al.28 demonstrated that silencing TRIM55 facilitates the mesenchymal phenotype transition of LC cells, thereby promoting their migration and invasion. SLC39A5, a member of the zinc transporter protein family, facilitates the transportation of zinc ions from the extracellular space or organelles into the cytoplasm, thus maintaining cellular zinc homeostasis29. Liu et al.30 revealed the significant function of SLC39A5 in lung adenocarcinoma, as it participates in the carcinogenesis process by activating the PI3K/AKT signaling pathway. SHISA9 is closely linked with poor prognosis in LUSC patients31. UGT is an essential phase II metabolic enzyme in humans, taking a crucial part in the metabolism processes of drugs and endogenous substances32. Bao et al.33 found that UGT1A5 is specifically upregulated in LC. LGI1 is a secreted protein found in the central nervous system, involved in the modulation of voltage-gated potassium channel activity, neuronal growth, and cell survival34. Virupakshaiah et al.35 discovered a close association between LGI1 autoimmune encephalitis and the occurrence of LUSC. In summary, the prognostic genes mentioned above take a regulatory part in the emergence and progression of LUSC. Some genes in the model, such as CCDC141, GAS2L2, TSPAN19, PAGE5, NPHS1, and CLVS2, have not been extensively studied for their roles in LUSC. Given that the study was based on bioinformatics data prediction, deep investigation was needed to explore the prognostic effects of these genes in LUSC.
Tumor progression and immunotherapy response depend on the types and functions of tumor immune cells36. HR patients exhibited distinct patterns of tumor immune cell infiltration compared to LR patients. Specifically, NK cells resting and monocytes exhibited remarkably elevated levels of infiltration in the HR group, while macrophages displayed considerably lower levels in the HR group. By activating, expanding, and genetically modifying NK cells, their anti-tumor activity can be greatly improved and the drug resistance of tumors can be overcome37. Villegas et al.38 pointed out that the CD57 subset of NK cells is a favorable prognostic factor for survival in LUSC patients. During cancer, different subsets of monocytes perform functions that contribute to tumor promotion and anti-tumor immunity, exhibiting distinct roles at different stages of tumor growth and progression39. Hai et al.40 put forward that an early postoperative increased peripheral monocyte count is an independent prognostic factor for poor prognosis and worse clinicopathological characteristics in LUSC patients undergoing pulmonary lobectomy. The high infiltration of NK cells and monocytes at a resting state observed in this study was a characteristic feature of poor prognosis in LUSC patients and may play a key part in cancer development. Macrophages are key factors in the complex interaction between the tumors and the immune system, functioning as important targets for tumor prognosis and treatment41. In this study, macrophages exhibited high infiltration in LUSC patients with a favorable prognosis. Therefore, macrophages might take a pivotal part in tumor suppression.
Immunotherapy is a promising cancer treatment strategy, and many immune checkpoint inhibitors targeting immunological checkpoints have been approved by regulatory authorities for the treatment of various cancers42. Despite these significant advancements, only a subset of patients respond to immunotherapy, hindering the prediction of patient responses43.
PD-1 and CTLA-4 are the most studied and effective T-cell immune checkpoint molecules. The PD-1 protein is encoded by the PDCD1 gene, and tumor cells can inhibit the normal immune activity of T-cells by interacting with PD-1 on the T-cell surface through an abundant expression of PD-L144. Therefore, blocking the interaction between PD-1 and PD-L1 can relieve tumor cell immune suppression on T-cells and restore the normal anti-tumor function of T-cells. Another immune checkpoint, CTLA-4, is a coinhibitory molecule that modulates the activity of T-cells. The interaction between CTLA-4 and its ligands (CD80 and CD86) can suppress T-cell activity and promote tumor progression45. When the interplay between CTLA-4 and these ligands is blocked, tumor cells can be identified and killed. In our analysis, we found remarkably higher expression levels of immune checkpoint genes, including PDCD1 and CTLA4, in the HR group of patients compared to the LR group.
Subsequently, immunotherapy prediction revealed that patients of the HR group may be more sensitive to immunotherapy. These findings suggested that our risk scoring model can be used to predict immunotherapy responses in patients.
There are extensive inter-individual differences among cancer patients, including genetic backgrounds, lifestyles, and disease stages, which may have a considerable impact on prognosis. However, our current prognostic models often struggle to adequately consider these complex individual differences, limiting their accuracy and applicability. Finally, when using the TCGA database for cancer prognosis research, we had to recognize the limitations of sample size, which may influence the reliability of the results. In vitro and in vivo studies are required in the future to develop a deeper understanding of the function of prognostic-related genes in the molecular mechanisms of LUSC.

