1. Introduction
Retention of gases on solid surfaces has been the subject of study for several years. In particular, due to the industrial implications, sorption of carbon dioxide (CO2) on different substrates has been investigated using theory and experimental approaches. Moreover, new materials with good sorption properties such as lithium ceramics have been tested to retain CO21-5. In fact, absorption of CO2 can be obtained by the chemical reaction Li2 O + CO2 = CO2 + Li2 O = Li2 CO3 (lithium oxide) is highly reactive with CO2 to form Li2 CO2 (lithium carbonate). Therefore, few experiments have been conducted to study such reaction and a schematic view of how CO2 is chemisorbed in Li2. From the theoretical point of view sorption has been studied with density functional theories6 8 and molecular simulations9-13. One of the classical approaches to study chemical reactions has been the Reactive Monte Carlo (RxMC) method. In fact, by using this methodology a model based on a solid of Einstein model for the surface was proposed by our group to understand the physics behind the reaction Li2 O + CO2 = Li2 CO314. The computational model agreed with the experimental assumption given by previous authors1, i.e. during the reaction a Li2 CO3 shell is formed on the Li2 O surface. Then, at high temperatures that shell is cracked and free paths might be created allowing diffusion of CO2 into the ceramic increasing its absorption in the solid.
In this paper we continue our studies of CO 2 sorption in solid surfaces given by the Li 2 O + CO 2 ⇌ Li 2 CO 3 reaction. In particular, in the present work, studies of how sorption is modified by different solid surfaces is investigated. The crystal structure of the Li 2 O ceramic is reported as a cubic array, therefore in the previous simulations14 a simple cubic surface was used to start the sorption studies of this system. However, since the actual Li 2 O crystal structure is a face centered cubic (FCC) in this work we conducted simulations using a solid surface with that particular structure. In this way we can compare absorption on surfaces with cubic crystal structures. We also want to investigate if disorganized structures have better absorption properties compared with crystal structures, then a third surface was tested and a disordered surface was constructed. Then simulations were conducted and comparison among the three surfaces were carried out.
2. Computational Method and Model
Simulations were conducted in a similar way as described in a previous work14. A gas with low density was put inside two parallel walls separated by a distance H. The walls were constructed using an atomistic model with a FCC or a disorder structure. For the FCC walls a lattice cell of 1.1054 𝜎 was used whereas for the disordered walls random particles were located in the solid. Moreover, two models were simulated for both solid walls; in the first one the atoms in the solid were considered as rigid sites whereas in the second model they were allowed to vibrate around their equilibrium positions, i.e. a solid of Einstein model was constructed.
For the real chemical reaction (Li 2 O + CO 2 ⇌ Li 2 CO 3 ) a simple model, A + B ⇌ C, was used where species “A”, “B” and “C” were modeled as spherical particles interacting with a Lennard Jones potential (LJ). “A” represents the gas, “B” the Li 2 O and “C” the Li 2 CO 3 . The Lennard Jones parameters for each specie were taken from reference .
The main Monte Carlo (RxMC) steps are (details can be found in reference15),
1) A particle “A” is chosen at random and a change in position with the standard MC probability is attempted16.
2) Forward reaction. A particle “B” is chosen at random and it is changed to particle “C”. At the same time a particle “A” is removed from the system. Then, the move is accepted with probability of min[1,P 𝑟→𝑠 + ]
3) Reverse reaction. A particle “C” is chosen at random and it is changed to particle “B”. At the same time a particle “A” is randomly created in the gas phase. Then, the move is accepted with probability of min[1, P 𝑠→𝑟 − ].
The transition probability 𝑟→𝑠 is given by,
From the chemical equilibrium condition equation (1) is written as
and the reverse reaction,
In the last equations, 𝑞 𝐴 , 𝑞 𝐵 and 𝑞 𝐶 are the individual partition functions which have the contributions of all degrees of freedom, 𝑞 𝐴 = 𝑞 𝑡 𝐴 𝑞 𝑣 𝐴 𝑞 𝑟 𝐴 with 𝑞 𝑡 𝐴 the translational contribution, 𝑞 𝑣 𝐴 the vibrational contribution and 𝑞 𝑟 𝐴 includes the rotational, electrical and nuclear contributions. In all simulations 𝑞 𝑟 𝑖 was considered as unity and since only particles of type “A” are allowed to translate, then
with 𝑉 the volume, ℎ the constant of Planck and 𝑚 the mass. As it is common in computer simulations we used reduced units (with the first specie “A”), then the probabilities can be written as,
where the usual reduced units were used, i.e. 𝑉 ∗ =𝑉/ 𝜎 𝐴 3 , 𝑇 ∗ =𝐾𝑇/ 𝜖 𝐴 , 𝑈 ∗ =𝑈/ 𝜖 𝐴 and with 𝛬=(2𝜋 𝑚 𝐴 𝜖 𝐴 𝜎 𝐴 2 / ℎ 2 ) 3/2 .
Equation (5) and (6) with 𝑞 𝑣 𝐴 = 𝑞 𝑣 𝐵 = 1 are used to simulate the rigid model14.
For the second model the vibrate partition function, of particles “B” and “C”, was written as 𝑞 𝑣 = 𝑛 𝑒 −𝛽 𝐸 𝑛 with 𝐸 𝑛 =ℏ𝜔(𝑛+1/2) where ℏ=ℎ/2𝜋 and 𝜔 the particle frequency17. With the approximation 𝐾𝑇≫ℏ𝜔, the partition functions can be written as 𝑞 𝑣𝐵 ≈𝐾𝑇/ℏ 𝜔 𝐵 and 𝑞 𝑣𝐶 ≈𝐾𝑇/ℏ 𝜔 𝐶 . By using the relation 𝜔 𝑖 = 𝑘 𝑖 / 𝑚 𝑖 ( 𝑘 𝑖 , the spring constant) Eqs. (5) and (6) can be rewritten as14,
It is important to note that Eqs. (7) and (8) cannot be used for zero spring constants since they will be undefined.
All simulations were conducted in the NVT ensemble. For the disordered walls the box dimension were 𝑋=𝑌=9.0281 and 𝑍=600 and they started with 1200 particles of type “A” and 1452 particles of type “B”. For the FCC walls, 𝑋=𝑌=9.2115 and 𝑍=577 and the simulations started with 1200 and 1440 particles of species “A” and “B”, respectively. Periodic boundary conditions were used in the X - Y directions only and it was used a cutoff radius of 4.0 𝜎 𝐴 . In order to keep the solid layer structure the particles in the walls were allowed to move in X-Y directions only. Typical simulations considered runs of 10000 MC steps for equilibration and another 40000 MC steps for data production. Configurational energy was monitored during the simulations to determine when the systems reached equilibrium (when energy did not have significant variations). All simulations were
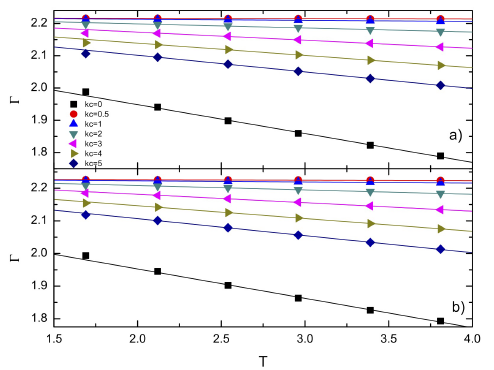
Figure 1 Sorption curves as a function of the temperature for different kc. The solid lines are the best fitting. Data with kc = 0 are calculated with the rigid model whereas the others (kc) were calculated with the Einstein model.
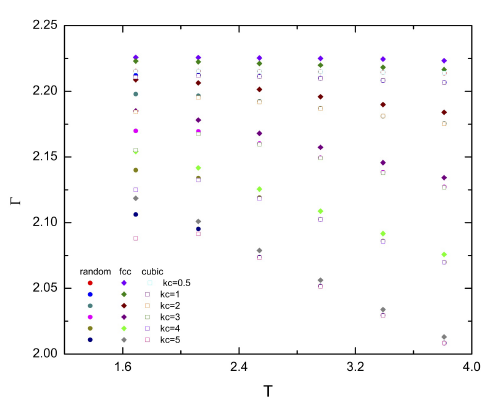
Figure 2 Sorption curves as function of the temperature for the Einstein model. Simulations for the FCC, the disordered and the cubic simple walls are shown. Symbols are given in the figure for different values of the spring constant kc.
conducted for 𝛬=0.001 with 𝑘 𝐵 =5 and the value of 𝑘 𝑐 was changed. For the rest of the paper all quantities are given in reduced units.
3. Results
Simulations were carried out for different values of spring constants, 𝑘, and since the reduced critical temperature for a Lennard Jones fluid is T = 1.2518 those simulations were carried out at reduced temperatures above T = 1.5.
3.1 sorption
In Fig. 1 the absorption curves of the gas (specie A) as function of the reduced temperature for the disordered and the
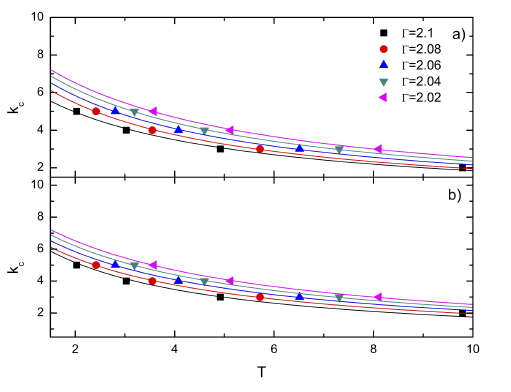
Figure 3 Spring constants, kc, as function of the temperature for different sorption values, ¡. The fitting “a” and “b” parameters (in equation 9) are: a) For disordered walls, 0.1165 and 0.0425 (black), 0.1014 and 0.0411 (red), 0.0982 and 0.0366 (blue), 0.0955, 0.0329 (green), and 0.0934 and 0.0299 (pink), respectively. b) For FCC walls, 0.1135 and 0.0415 (black), 0.1004 and 0.0398 (red), 0.0969 and 0.0358 (blue), 0.0939, 0.0325 (green), and 0.0916 and 0.0298 (pink), respectively.
the FCC walls are shown. Here absorption was defined as 𝛤= 𝑚 𝑓 / 𝑚 𝑖 , with 𝑚 𝑓 and 𝑚 𝑖 the total initial and final masses in the solid, respectively. As a general trend the rigid models present significant lower absorption than the Einstein model. Moreover, it is noted that chemisorption increased as the spring constant, 𝑘 𝐶 , decreased. From these results it seems that the presence of a spring in the solid particles modified the substrate absorption.
For the disordered surface it is observed similar absorption from T = 1.5 to T = 2.0, then it decreased linearly (Fig. 1a). For the FCC surface absorption had always a linear decayed with the temperature (Fig. 1b). It is also noted that FCC walls have slightly higher absorption than the disordered walls at the same temperature. In Fig. 2 absorption curves of both walls are compared with the absorption in a simple cubic wall. The values for the cubic wall were in good agreement with those reported in a previous work . In the figure is noted that FCC walls produced more absorption than the disordered and cubic walls for all the simulated temperatures. Moreover, the disordered and cubic walls had similar data. At low temperatures there was a higher difference in the absorption and as the temperature increased that difference became smaller. It is also interesting to observe a maximum in the curves between temperatures T = 1.6 - 2.5 for the cubic walls, however, that maximum disappeared for the other walls.
As in the previous paper, it was determined the behaviour of the spring constant as function of the temperature for a given absorption in the Einstein solid model (Fig. 3). For both surfaces, the disordered and the FCC, it was found an inverse dependence of the spring constant with the temperature,
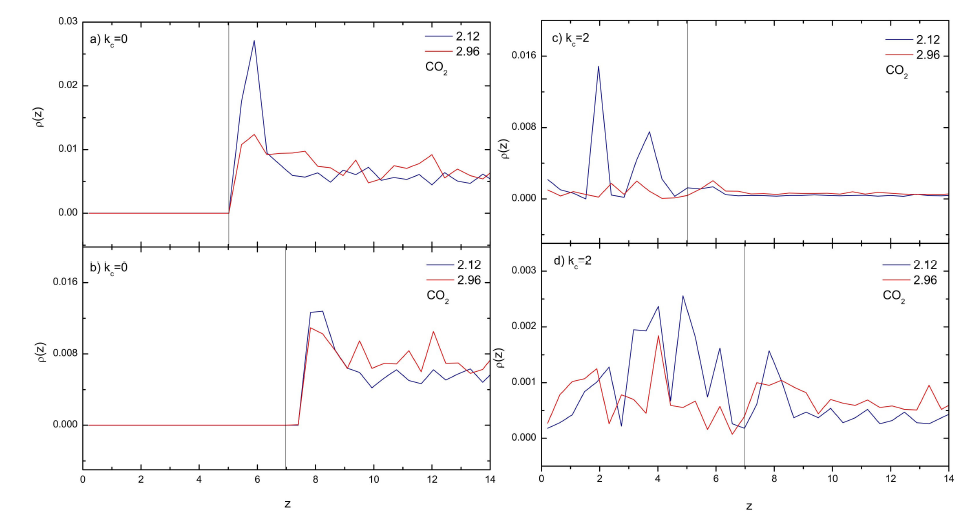
Figure 4 Typical density profiles for the gas particles (specie A) at different spring constants at two different reduced temperatures T = 2.12 (blue lines) and T = 2.96 (red lines). a) kc = 0 with disordered walls, b) kc = 0 with FCC walls, c) kc = 2 with disordered walls, d) kc = 2 with FCC walls. The position of the substrate in each case is shown by the black line.
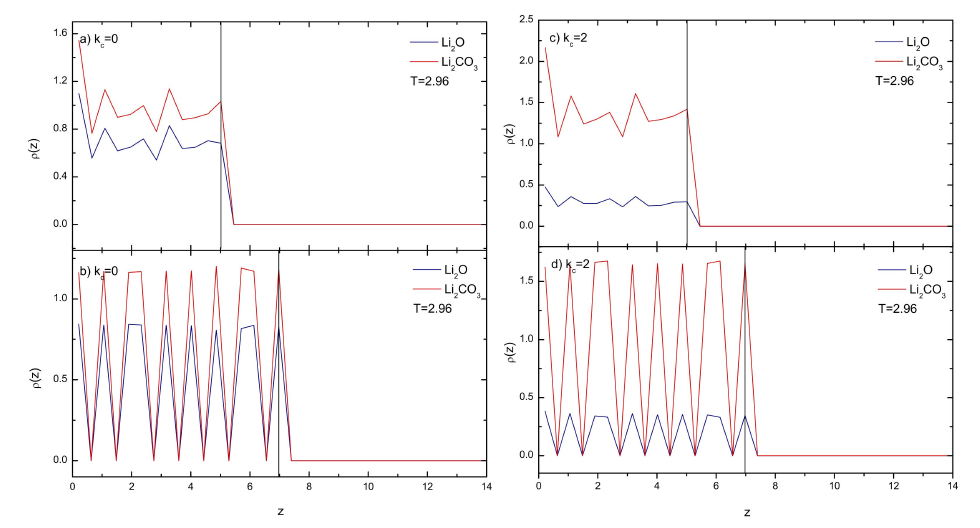
Figure 5 Typical density profiles for the solid particles at different spring constants at T = 2.96. Blue lines for the specie B and red lines for the specie C. a) kc = 0 with disordered walls, b) kc = 0 with FCC walls, c) kc = 2 with disordered walls, d) kc = 2 with FCC walls. The position of the substrate in each case is shown by the black line.
Moreover, both walls had similar fitting parameters “a” and “b” (see Fig. 3).
3.2 Structure
The structure of the different particles in the reaction were studied in terms of density profiles along the Z-direction, i.e. perpendicular to the surfaces. The structure of the gas particles close to the surfaces present different features as noted in Fig. 4. For instance, for the rigid solid model (first model, 𝑘 𝑐 =0) we did not observe any particles inside any of the solid surfaces, i.e. the gas was adsorbed at the solid-gas interface (Fig. 4a and 4b). On the other hand, the system with disordered walls (Fig. 4a) had a stronger structure close to the surface at low temperature (T = 2.12) than the system with FCC walls (Fig. 3b) suggested by the first high peak in the density profile. On the other hand, for the Einstein solid model the gas particles penetrated into the solid region (Fig. 4c y 4d). In fact, a strong structure inside the FCC walls at low temperature (T = 2.12) was observed for the gas particles. In the case of the disordered walls the structure was also strong however, less number of peaks were formed. It seems that the vibration of the solid particles in the model with springs created gaps which allow the fluid molecules (specie A) to move inside the solid by enhancing the sorption. From those results not only absorption but also adsorption was observed in the simulations.
The structure of particles inside the solid walls (species B and C) were also analyzed. For the disordered walls the B (Li 2 O) and C (Li 2 CO 3 ) particles were distributed uniformly along the surface regardless the value of the spring constant (see e.g. Fig. 5a and 5c). On the other hand, for the FCC walls the B and C particles kept the FCC layer array (Fig. 5b and 5d). Despite the height of the peaks in the density profiles similar trends were depicted for all the spring constants ( 𝑘 𝑐 ). However, it was noted that the profiles for the C particles were always higher than those of the B particles, for the disordered and FCC walls, suggesting that in all cases absorption of gas particles was favored by the walls.
3.3 Conclusions
Sorption of gas molecules on two different walls structures were studied by using a reactive Monte Carlo method (RxMC); a FCC and a disordered wall. For each wall two models for the solid particles were employed, a rigid model (solid particles were fixed) and an Einstein solid model (solid particles were allowed to vibrate). For both walls it was found an inverse function dependence of the spring constant with the temperature.
The FCC walls present slightly more absorption than the disorder ones regardless if the rigid or the Einstein solid models were used. Moreover, the FCC walls also present higher absorption that the simple cubic walls at the same temperature and at the same spring constant. Since the packing factor in a FCC (0.74) cell is higher than that in the simple cubic (0.52), i.e. there are more atoms per unit cell in the FCC in the first wall than in the second one. Therefore, there are more solid atoms to react with the gas by producing more absorption. Then, this feature combined with the use of a spring constant in the solid particles seem to enhance absorption in solid surfaces.
Right now only three different surfaces have been tested to study gas sorption on a solid surface with our model and the results suggest that the surface with the higher packing fraction shows better absorption. However, it is not possible to generalize that FCC surfaces have the best absorption properties since comparisons with other surfaces, with different structures, should be done to corroborate this issue and to have a more general conclusion.


 nueva página del texto (beta)


