1. Introduction
Rare earth-doped fibers have a wide range of applications: commonly in communication systems1,2, but also they have been used as superluminescent sources3, in spectroscopy systems4, data storage5, material processing6, fiber optic sensors7-9, and fiber optic gyroscopes (FOG)10,11. Two of the most widely studied rare-earths doped fibers are the Erbium and Ytterbium doped fibers. For telecommunication systems, erbium doped fibers can be pumped at 980 nm or 1480 nm, and can deliver output signals in two regimes of the laser operations: continuous wave (CW) and pulsed regimes12; the former is where the amplifiers have the best performance relative to gain, very low noise figures, high output powers and high quantum conversion efficiencies13. Typical bandwidth gain of erbium doped fiber amplifier ranges from 1520 nm to 1570 nm, and the typically values of gain for small signals2 are 30-40 dB.
Ytterbium doped fiber provides amplification over the range from 975 to 1200 nm13-15, and in some cases even at 515 nm16; it offers high output power and excellent power conversion efficiency. Ytterbium doped fibers allow several pumping schemes, where the strongest absorption band is around 975 nm, for this reason is used as a sensitizer ion, absorbing the pump photons and transferring to an acceptor ion, commonly approach in telecommunications for improve the performance amplification around 1550 nm in co-doped matrix erbium/ytterbium17,18.
This experimental work focuses on analyzing the output signal of an ytterbium-doped fiber in an EDFA configuration when using superluminescent sources. We compare these results to the same configuration using a laser source. We will show that the output signal in this cascade configuration presents an improvement in SNR around 60%.
2. Doped-fiber absorption spectrum
Even though, erbium and ytterbium doped fibers properties and applications have been extensively investigated, their
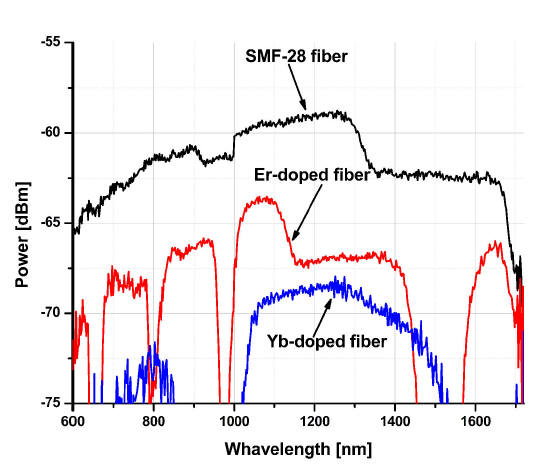
Figure 2 Transmission spectra of a halogen lamp trough SMF-28 fiber, Erbium doped fiber (Er30-4/125) and Ytterbium doped fiber (Yb1200-10/125DC).
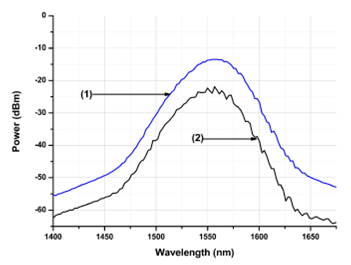
Figure 3 Signal of a SLD centered at 1550 nm. (1) Output spectrum after the SMF-28 fiber. (2) Transmission spectrum after the ytterbium-doped fiber.
transmission spectrums usually are only reported within a band between 850 nm and 1150 nm13,14. We wanted to observe those spectrums in a wider range (600 to 1730 nm) to observe the behavior of doped fibers when used with broadband sources like an SLD. Figure 1 shows the experimental setup used to register the transmittance spectra for an SMF-28 fiber coupled with an erbium-doped fiber using a halogen lamp as wide bandwidth light source. First, the light source was coupled into the SMF-28 fiber via a 5x microscope objective, and its output spectrum recorded. Then we repeated the experiment by connecting a 1.6 m erbium-doped fiber (model: Er30-4/125) after the SMF-28 fiber using an FC-PC connector10; finally we replaced the erbium-doped fiber with a 24 cm of ytterbium doped fiber (model: Yb1200-10/125DC).
Figure 2 shows the experimental transmission spectra for erbium-doped fiber, ytterbium-doped fiber and without any doped-fiber. Figure 2 help us compare the spectrum output of the SMF-28 fiber against spectrum output after the erbium doped fiber and the spectrum output of the Ytterbium-doped fiber. The output for the erbium-doped fiber present attenuation bands at around 660 nm, 800 nm, 980 nm and between 1460 and 1570 nm; these bands can be found commonly in the absorption spectrum of Er 3+ doped ED-2 silicate glass18. The ytterbium-doped fiber spectra have two wide attenuation bands: between 600 nm and 700 nm, between 860 nm and 1030 nm. From these curves we can see that there is an overlap region between 1030 nm and 1460 nm.
The halogen lamp and the microscope objective in Fig. 1 were replaced by a superluminescent diode (SLD), with an emission centered at 1550 nm, coupled to a single mode fiber optic (SMF-28) through a FC-PC connector. In Fig. 3, curve (1) corresponds to the SLD spectrum with a -13.5 dBm of maximum amplitude and a full width at half maximum (FWHM) of 115.5 nm, the curve (2) is the output spectrum of the SLD after ytterbium-doped fiber. From the curve (2), it can be appreciated the filtering of the curve (1) in amplitude and FWHM. Where, the output levels of the transmitted signal after the ytterbium-doped fiber presents a strong attenuation from 1400 nm to 1700 nm with a peak amplitude of -21.9 dBm around 1550 nm, and a FWHM reduction from 115.5 nm to 110.9 nm. Both curves in Fig. 3 seems very similar.
3. Cascade configuration, experimental results
In order to determine what factors modify the output we implemented a new experimental setup using an EDFA amplifier and adding the ytterbium fiber at the output of the EDFA as shows in Fig. 4. The EDFA was implemented with a fused single mode wavelength division multiplexer (WDM) in 2X2 configuration for 980/1500 nm of operating wavelengths, 1.6 m of Erbium doped fiber, 24 cm of ytterbium doped fiber, a laser pump at 980nm, and the fiber connections were made with FC-PC connectors.
We first performed a series of measurements to characterize the ASE signal from the EDFA, which means initially the superluminescent spectra were measured for different values of pump power without ytterbium doped fiber. Subsequently the ytterbium doped fiber was added as shown in Fig. 4 and the process was repeated.Figure 5 show the superluminescent emission spectra, where a) corresponds to the emission without ytterbium-doped fiber, and b) corresponds to the emission with ytterbium-doped fiber. Comparing a) with b), we can observe that minimum attenuation in the spectral amplitude is of 10 dBm for a pump power of 5.34 mW (curve 4), where part of this attenuation correspond to coupling losses between fiber and connector. On the other hand, there is a stronger attenuation for wavelengths larger than 1600 nm, which is the opposite behavior observed previously in Fig. 3.
We then proceed to evaluate the output signal when an ytterbium-doped fiber is placed in cascade after an EDFA with different light sources. First an SLD was introduced (as the 1550 nm light source) into the experimental setup shown in Fig. 4. The EDFA was pumped using the same values previously used. In Fig. 6 are shown the spectra output when the SLD signal is injected, where can observed that as pump power increase the spectral width also does. The spectra (4) and (5) have similar shape that original SLD signal, which
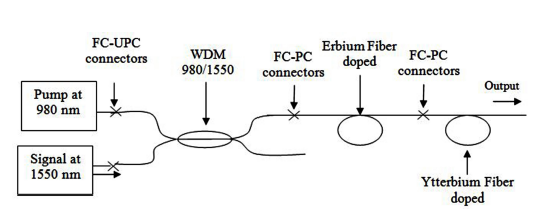
Figure 4 Experimental setup of the optical erbium doped fiber amplifier, combined with ytterbium doped optical fiber.
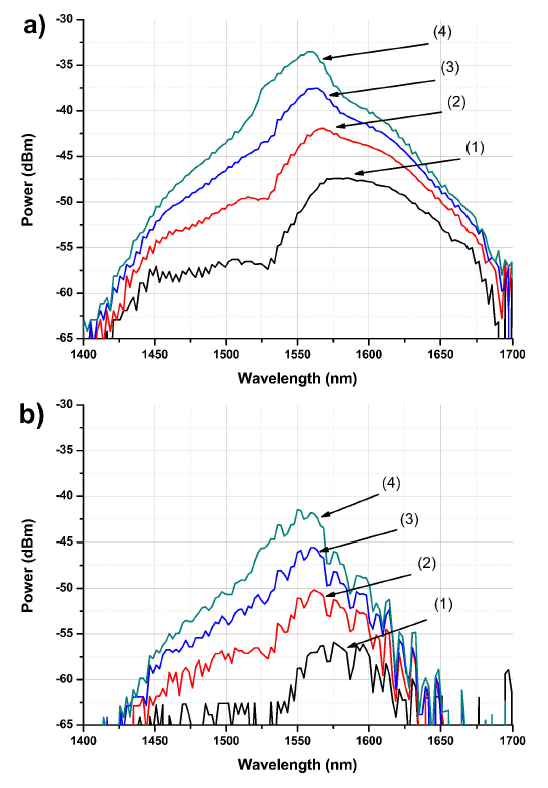
Figure 5 Superluminescent spectra output from EDFA implemented in the experimental setup shown in Fig. 4. a) ASE signal without ytterbium-doped fiber; b) ASE signal output with ytterbium-doped fiber. The spectra 1 is the measurement at 0 W of pump power; 2 at 2.29 mW; 3 at 3.71 mW; and 4 at 5.34 mW.
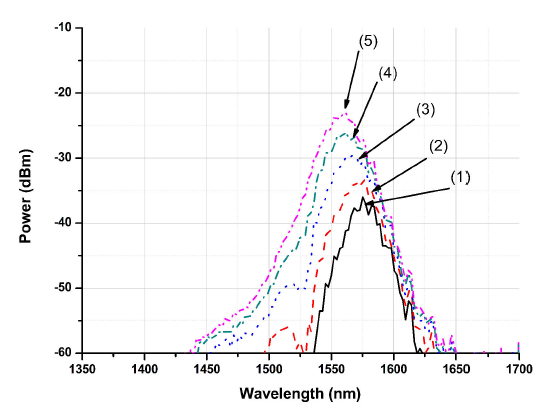
Figure 6 Output spectra from experimental setup of Fig. 4 for different pump power, when the input is the SLD signal from Fig. 3 as (1). The spectra number 1 is the measurement at 0 W of pump power; 2 at 2.29 mW; 3 at 3.71 mW; 4 at 5.34 mW; and 5 at 7.13 mW.
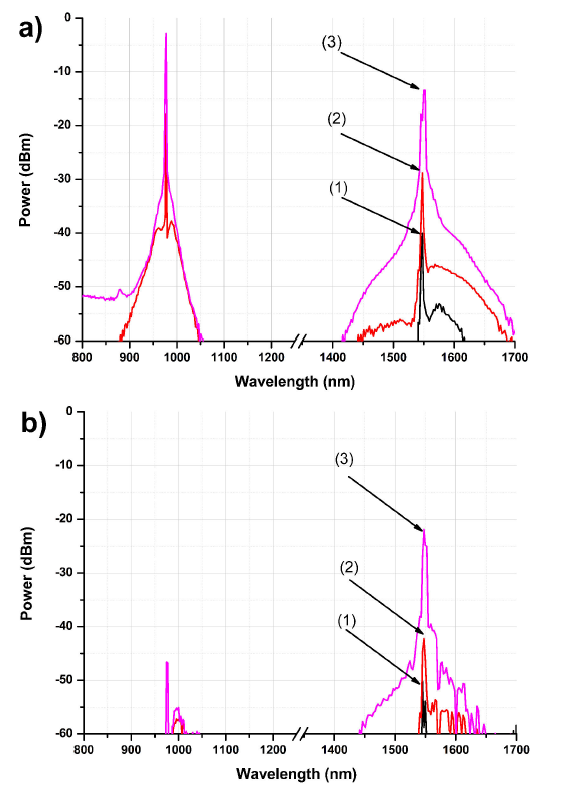
Figure 7 Output spectra from experimental setup of Fig. 4, when the input is a laser diode centered at 1550 nm. a) Laser amplified signal without ytterbium doped fiber; b) laser amplified signal with ytterbium doped fiber. Spectra 1 correspond at 0 W; 2 at 2.29 mW; and 3 at 7.13 mW of pump power.
implies that the EDFA compensate the attenuation of ytterbium doped fiber between 1450 nm and 1600 nm, and the ytterbium doped fiber attenuate the ASE noise. This is a similar situation as with the existing techniques to expand the spectral width of the signal. In this case there is a power loss in the output signal. This loss of signal strength is caused by existing leakage at the joints and splices of optical fibers, mainly in the ytterbium doped fiber.
We then proceed to replace the SLD with a laser source centered at 1550 nm. Figure 7 show the output spectra of that configuration. The spectrums in a), are the output spectra when the ytterbium doped fiber is not connected at the end of the amplifier; and b) are the spectrums when the ytterbium doped fiber is connected. From a), the 980 nm pump power not absorbed by the EDFA is strongly present in the output, furthermore, the ASE noise between 1400 nm and 1700 nm is present in the amplified signal. In b), when the ytterbium-doped fiber is used, the 980 nm pump signal is strongly absorbed as well as the amplified signal (around 1550 nm), but the amplified signal presents a lower ASE noise. For some sensors this characteristic is useful to filtering out the pump
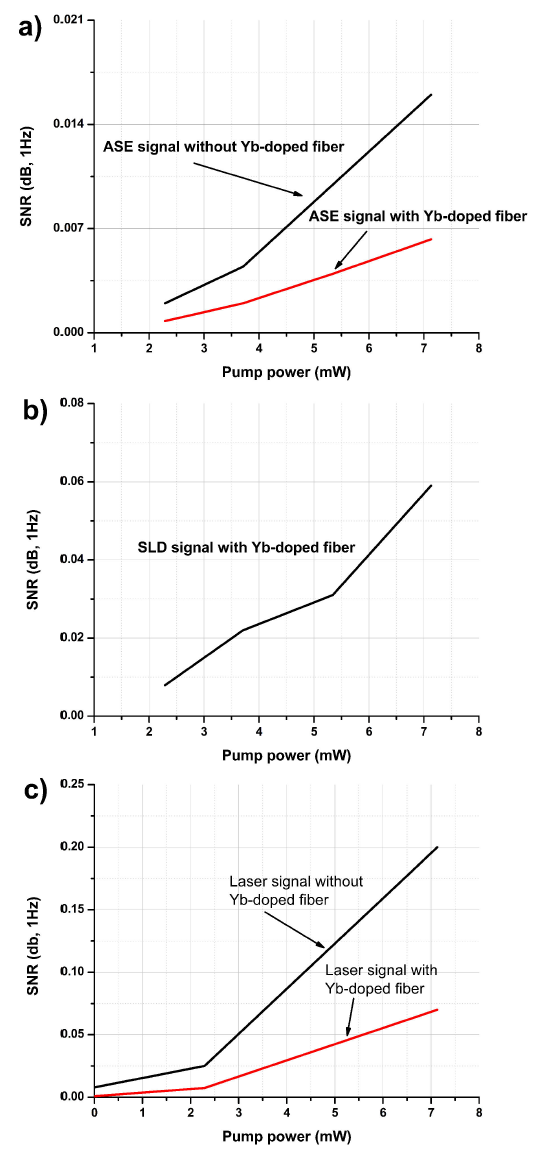
Figure 8 The different noise levels for the different configuration on our setup. a) the SNR for the ASE; b) the SNR when a 1550 nm laser is used as a source and; c) the SNR when using an SLD source.
signal and to avoid damages to the detectors. For the amplified signals the use of the ytterbium doped fiber reduces the spectral width, particularly for the laser case. This might be an advantage because the ytterbium-doped fiber helps to remove the ASE noise.
It would be of interest to calculate the SNR for the different configurations. The SNR is calculated using the following equation
Where 𝑃 opt is the output power of the system, 𝐵 is the bandwidth (1 Hz) and 𝜆=1550 nm. Figure 8 shows the different noise levels for the different configuration on our setup. Figure 8a shows the SNR for the ASE signal with and without the yterbium-doped fiber stage. Figure 8b shows the SNR when a 1550 nm laser is used as a source for different pump power and Fig. 8c shows the SNR, when an SLD source.
From Fig. 7 and Fig. 8 we can observe that, even though, the output power of the SLD signal is reduced when compared to the laser source the SNR signal for the former case is actually increase. We believe that this is caused by the reduction of noise caused by the 980nm pump source and amplified signal that are suppressed when the ytterbium-doped fiber stage is added to the EDFA.
4. Conclusions
In this paper we have reported the spectral output for erbium-doped fibers and ytterbium-doped fibers for a halogen light source, SDL source and a 1550 nm laser source. We have demonstrated experimentally how the use of a secondary ytterbium-doped fiber stage can alter the output signal from erbium-doped fiber amplifier. We have shown that this additional stage can filter out the 980 pump signal and reduce the amplified spontaneous emission (ASE) noise. Increasing the SNR from 0.3 dB to 0.48dB. An increase in SNR of 61%.
The ytterbium doped fiber could be used to filtering the pump signal and protect the devices as photo-detectors, furthermore the ytterbium doped fiber could be used to reduce the spectral width, particularly when the EDFA’s amplifying a laser signal and there is a need to absorb the ASE noise. We also propose the study of rare earth doped fiber as natural filters exploiting their spectral properties.


 nueva página del texto (beta)


