PACS: 63.20.-e; 64.70.kg; 61.66.Dk; 61.72.sd; 71.20.Nr; 71.55.Eq; 78.30.Fs; 78.55.Cr
1. Introduction
The quaternary alloy system Ga
1-x
In
x
As1-ySb
y
is of great importance for optoelectronic applications because its room-temperature band gap energy covers the extremely wide range from 1.43 to 0.10 eV. Lattice matched to InP substrates, the band gap energy for the GaInAsSb alloy is nearly fixed, ranging from 0.74 to 0.78 eV. However, lattice matched to GaSb, this band gap energy varies between 0.73 and 0.29 eV, corresponding to a wavelength range from 1.7 to 4.3
Among many techniques to grow Ga 1-x In x As1-ySb y epitaxial layers on GaSb substrates, Liquid Phase Epitaxy (LPE) still remains an attractive method due to its simplicity and high crystalline quality material it produces. But the existence of a large miscibility gap3 hinders the growth of Ga 1-x In x As1-ySb y in a wide range of x and y values. It is considered a metastable alloy, with the tendency to decompose into regions of non-uniform alloy composition. It should be noted that, owing to the large unstable region, only GaSb-enriched solid solution compositions will be stable at typical LPE temperatures with lattice-matching to GaSb substrates8. This is why trying to reduce the band gap energy of the quaternary antimonide-based material for the desired value for thermophotovoltaic (TPV) applications, usually results in phase separation.
In this paper reports the structural and luminescence properties of Te (or Zn)-doped GaInAsSb with the varying Te (or Zn) molar fraction, using Raman spectroscopy and photoluminescence. After thorough investigation of doped GaInAsSb, we have found a relationship of the main energy emission band versus (Te or Zn) dopant molar fraction added to the growth solution, which could be considered a useful tool to determine the free carrier concentration in doped GaInAsSb by low temperature PL spectra measurement. The carrier concentration increases with increasing dopant mole fraction. In this work we report a systematic study and a quantitative evaluation of the effects of high Te (or Zn) doping in GaInAsSb layers grown on (100) GaSb substrates by liquid phase epitaxy (LPE) using the Raman spectroscopy and photoluminescence (PL) spectroscopy technique.
2. Experimental details
Quaternary GaInAsSb epitaxial layers were grown in a three-zone furnace under H2-atmosphere, using a horizontal graphite sliding boat. As substrates, (100) Te-GaSb wafers mechanically polished from Firebird, Inc. were used. All the precursor elements used to prepare the growth melt were of 6N purity, and the GaAs came from a wafer. For carrying out the intentional doping of the epilayers for high electron (or hole) concentration, Sb2Te3 (or Zn) pellets were added in small amounts to the growth solution. After the charge of the substrate into the boat, the temperature was raised at 640°C for one hour, in order to eliminate the oxides in the substrate surface. Then, the temperature was decreased to stabilize the system, and a cooling ramp at a rate of about 0.3°C/min was established, after which the layers were grown at temperatures of around 530°C. Elemental chemical microanalysis measurements were performed using a scanning electron microscope (SEM) FEI-Quanta 3D FEG model equipped with an X-ray dispersive energy microanalysis system (EDX). Polarized Raman scattering experiments were performed at room temperature in the near-backscattering geometry using the 6328 Å line of a He-Ne laser at normal incidence for excitation. The light was focused to a diameter of 6.0
Table I. Summary of the GaInAsSb samples studied, and the Sb2Te3 fraction molar added to each one. All samples were grown at 530°C on single crystal GaSb substrates.
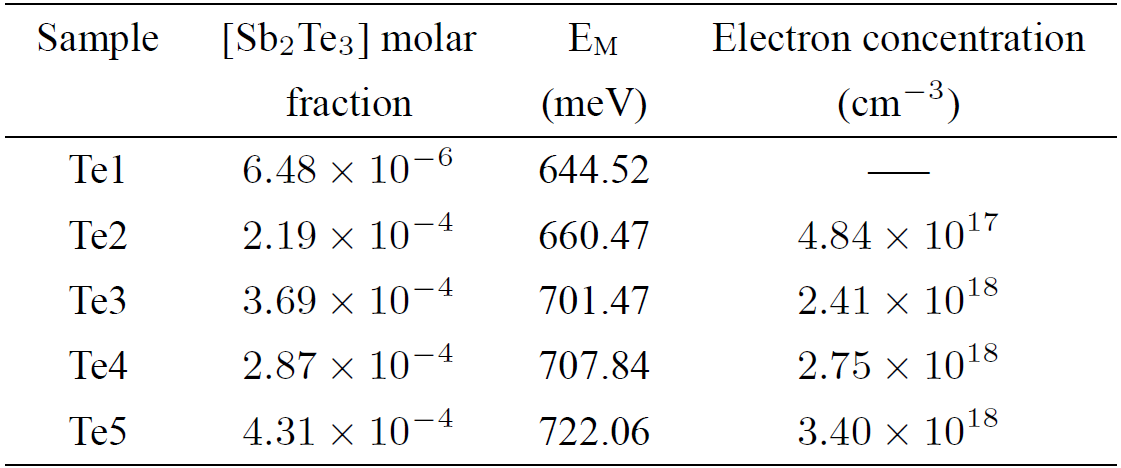
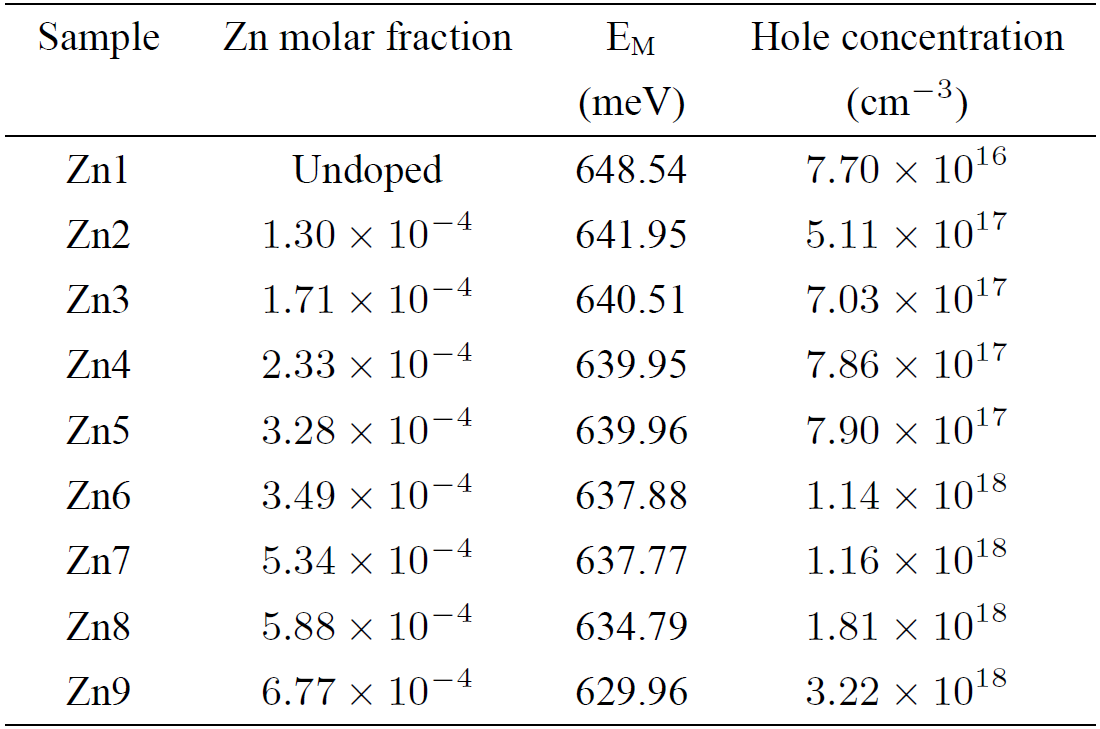
Table II. Summary of the Ga0.86In0.14As0.13Sb0.87 samples studied in this work, which were grown by liquid phase epitaxy and different Zn molar fractions were added to each one. All samples were grown at 530°C on single crystal Te-doped GaSb substrates. The fourth column shows the hole concentrations estimated by low temperature photoluminescence measured at 15 K and at a laser power of 120 mW.
3. Results and discussion
For all the Te (or Zn)-doped Ga0.86In0.14As0.13Sb0.87 layers, the surface morphology was very smooth, i.e. mirror-like surface without any pinholes, as confirmed by optical microscopy and atomic force microscopy (AFM). The surface morphology was generally very smooth with a root-mean-square (rms) roughness of 19-39 Å as determined from tapping mode AFM.
It is interesting to consider the effect of tellurium as group VI dopant (or of zinc as a group II-dopant) on the structural and optical properties of GaInAsSb solid solutions. It means that Te atoms as substitutional impurity can substitute Sb atom in the GaSb lattice since the covalent radius of Te (a Te=0.136 nm) is nearly the same as that of Sb (a Sb =0.140 nm). Zn is an acceptor impurity in GaSb and its alloys, which means that Zn atoms as substitutional impurities can substitute Ga atoms in the GaSb lattice since the covalent radius of Zn atom (a Zn =0.125 nm) is nearly the same as that of Ga atom (a Ga =0.126 nm). The influence of these dopants on the GaInAsSb physical properties has been studied using the Raman spectroscopy and low-temperature photoluminescence for high doping regime.
The chemical composition of a typical sample was analyzed by EDX. The Zn7 EDX measurement showed the presence of oxygen (0.35%) in the samples along with zinc, indium, antimony, gallium and arsenic. It is widely accepted that oxygen is a residual impurity that introduces deep traps into III-V semiconductor compounds9, which are dominating non-radiative deep centers located below the conduction band that critically reduce the luminescence efficiency9,10. Thus, it appears that oxygen has replaced antimony or arsenic at a few random points of the GaInAsSb lattice. The EDX spectrum indicated that the sample contains a significant amount of carbon (0.78%). From EDX characterization, the chemical stoichiometry of the quaternary layers was deduced for all the samples as approximately: Ga0.86In0.14As0.13Sb0.87.
Back scattering geometry has been used to record the Raman spectra of the GaInAsSb epitaxial layers grown with different tellurium and zinc molar fractions that are shown in Figs. 1 and 2. Raman spectrum of undoped GaInAsSb layer presents four well resolved bands. There are two dominant bands observed at about 227 and 241 cm-1, which were labelled as A and B, and one small band located at 269 cm-1, labelled as C, which does not depend on the tellurium concentration incorporated into the n-type layers. The band C at 269 cm-1 is associated to GaAs TO-like mode11. For the case of p-type layers, the band
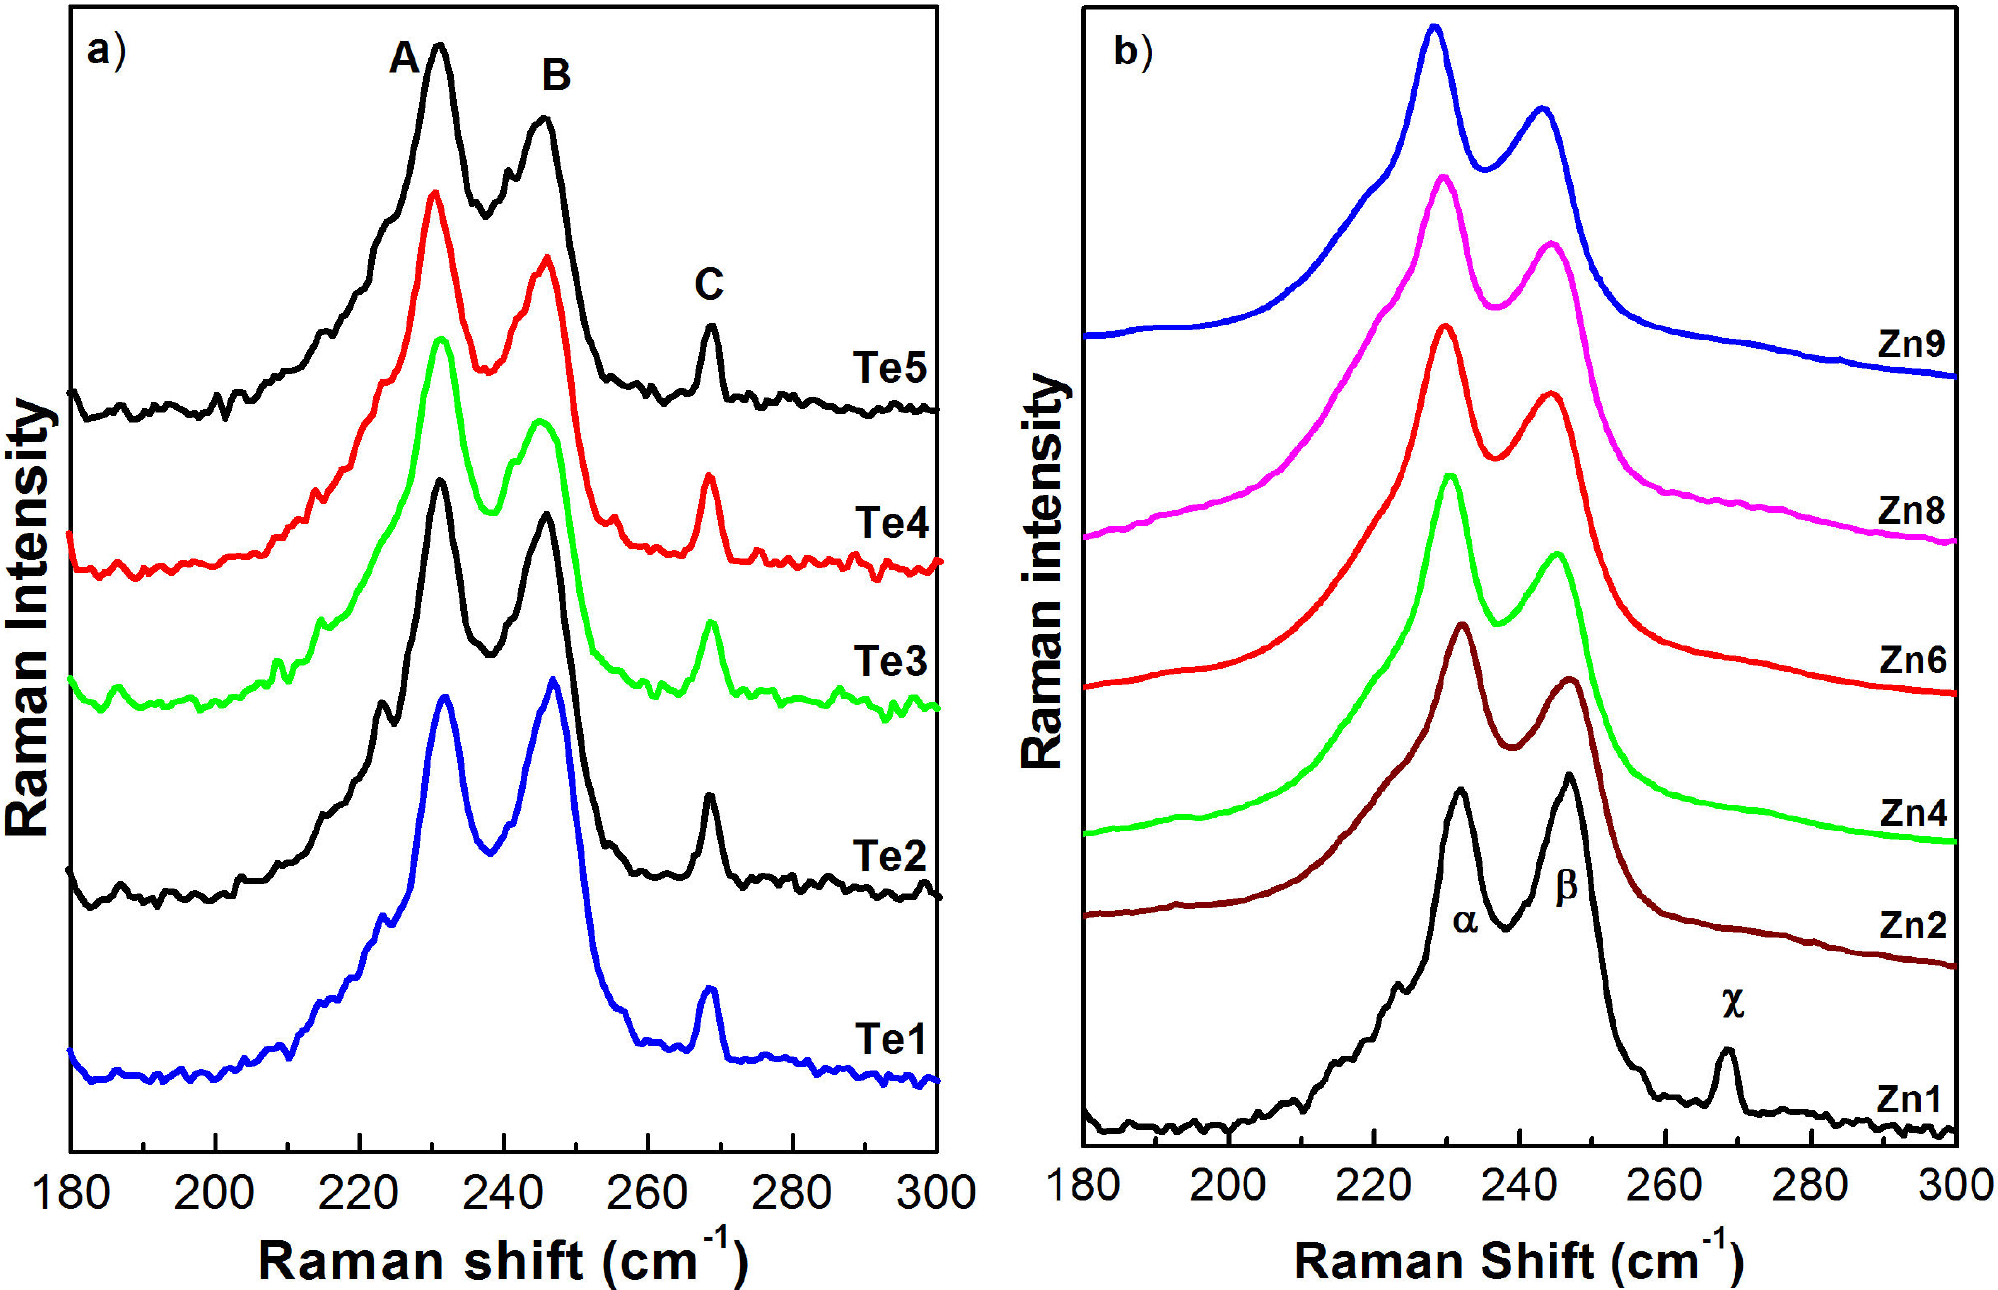
Figure 1. Raman spectra measured at 300 K for the LPE-grown GaInAsSb epitaxial layers with different dopant concentrations: a) tellurium and b) zinc.
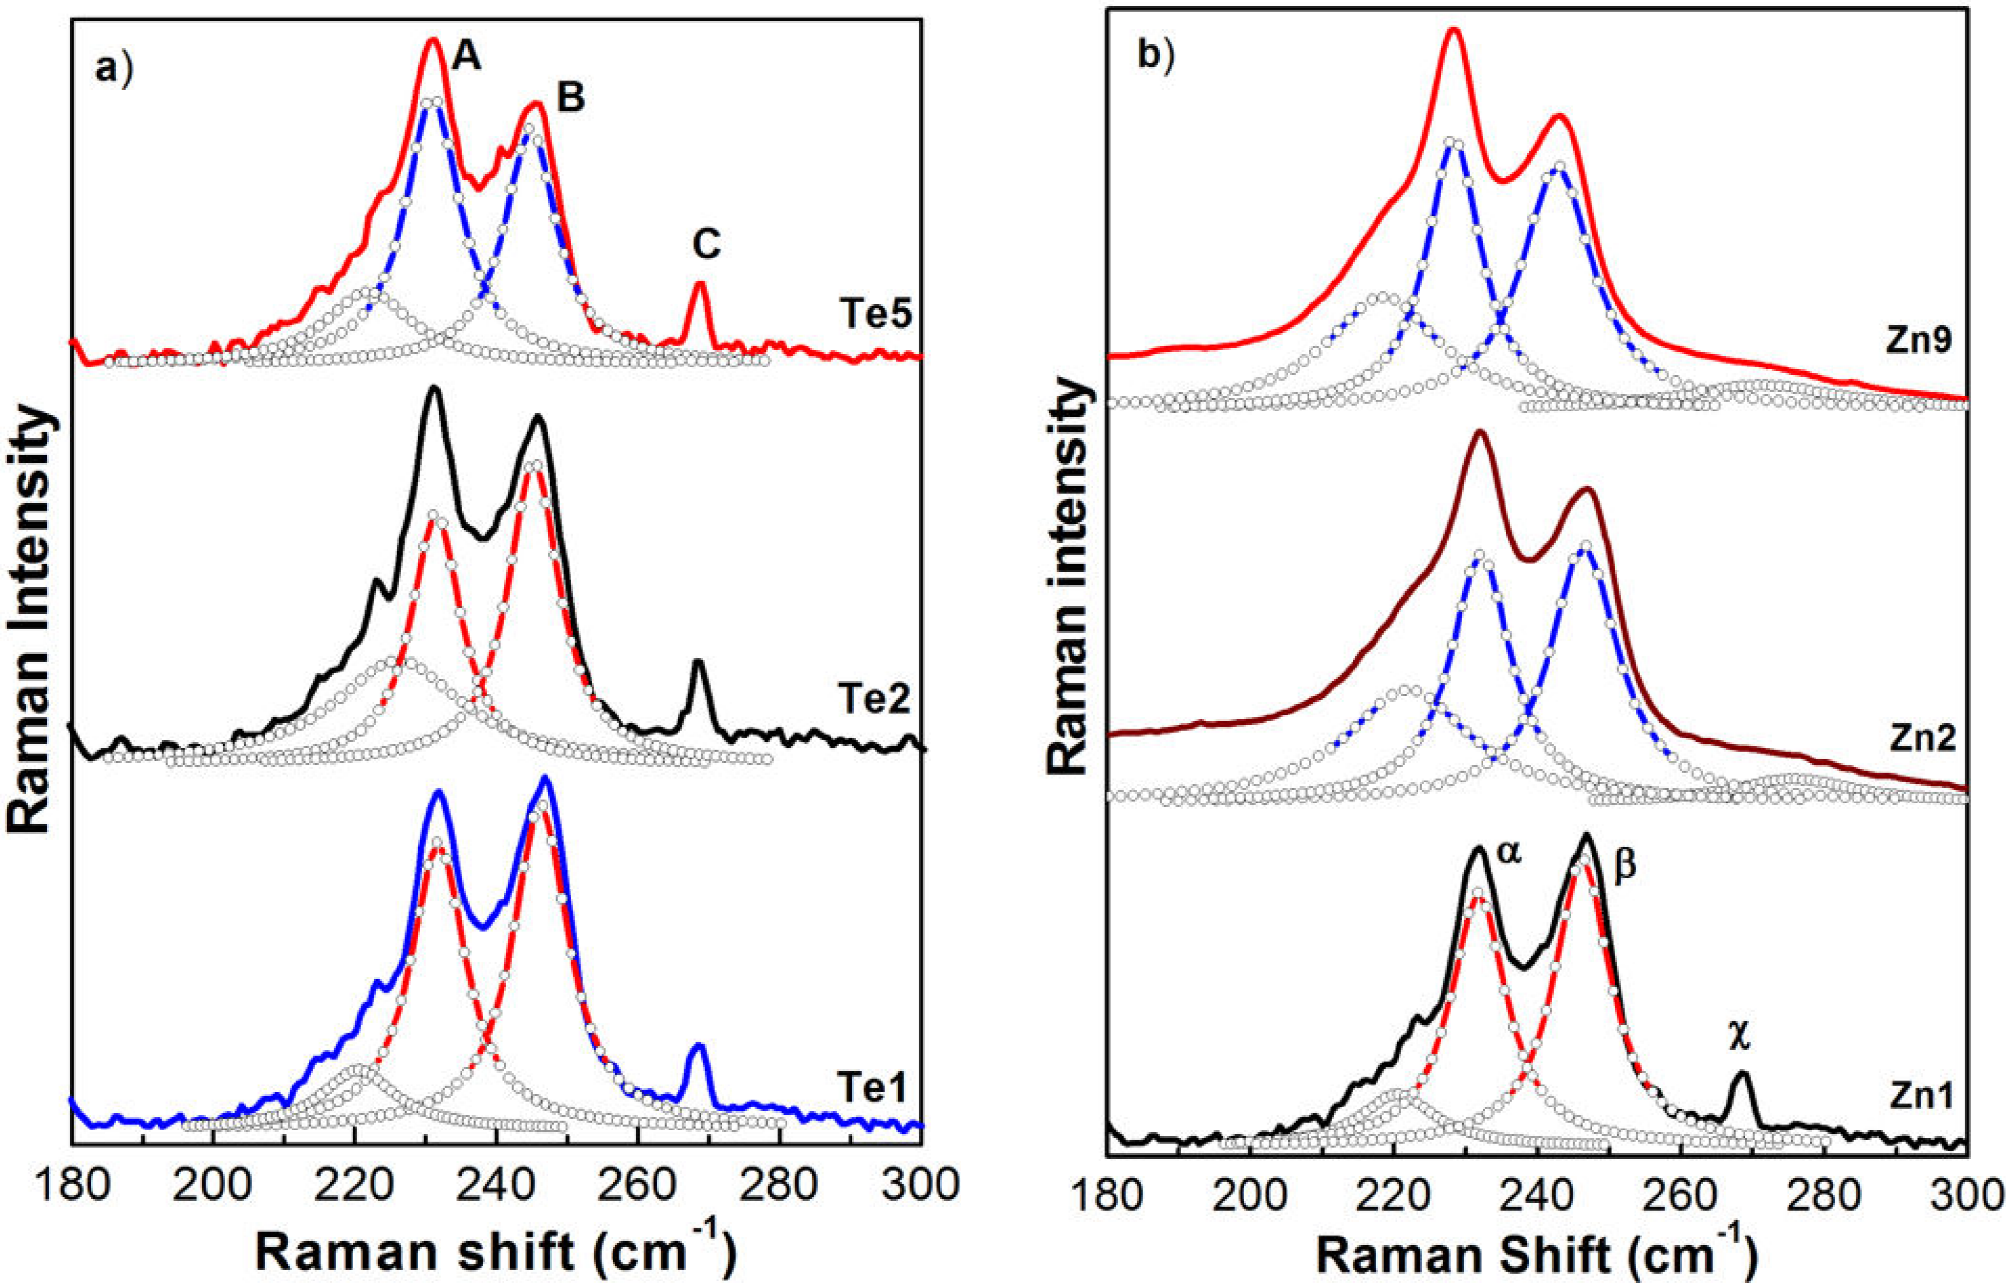
Figure 2 Decomposition of the measured GaInAsSb Raman spectra into individual components (Lorentzian shape) for three carrier concentrations: a) n-type; lightly doped, doped and highly doped. b) p-type: undoped, lightly doped and highly doped. Layers were grown on n-type GaSb substrates. The lines (-o-o-) are their respective fitting.
The ratio of intensities of the bands A/B (
The reduction in Raman intensity of the LO-GaAs-like mode, at about 246.2 cm-1, for the highly Te (or Zn)-doped samples with respect to the undoped one is due to the depletion layer depth. This effect can be explained as the superposition in the observed Raman spectra of two contributions. The first one would come from the depletion layer near to the surface; this Raman spectrum could be essentially the same as that of the undoped sample, and its intensity depends only on the thickness of the depletion layer. The second contribution would come from the charge region that is between the depletion layer and the penetration depth of the exciting light. In this region, the phonon-plasmon interaction can take place and it could be the cause that the band associated with this effect is not so sharp. Thus, the intensity of the LO-GaAs-like mode in the total spectrum will be determined by the ratio of the thickness of the depletion layer to the penetration depth of the exciting light. This is the reason why the intensity of the LO-GaAs-like mode in the doped samples decreases with respect to the same mode in the undoped sample. In fact, it can be considered that a sample with a carrier concentration of around
Figure 3 shows the low-temperature photoluminescence spectra of the samples Te1 and Zn1, one lightly doped and the undoped one. For the undoped sample an optical band gap energy of about 653 meV at 15 K has been estimated for this quaternary alloy22. As can be seen in Fig. 3a, the dominant emission band has a slightly asymmetric shape in the sharp high-energy edge and the low-energy tail. The quantitative fit of the dominant band of the 15K PL spectrum suggests that the main radiative emission consists of three bands with photon energies centered at 639, 645 and 649 meV that have been associated to bound excitons labelled as BE4, BE2 and BE1, respectively23,24,25, bounded to neutral acceptor impurities. The origin of these acceptor impurities is not definitely known though some authors have conjectured that they are due to native defects. The transition BE2 has been ascribed to the decay of an exciton bound to a dominant residual acceptor level that has a binding energy of 34-39 meV24. Very little is known about the acceptor impurity corresponding to the transition BE1, while there are some conflicting reports concerning the origin of the transition BE4. The values for the Full Width at Half Maximum (FWHM) of the three main three PL bands at 120 mW of laser power are about 6.5, 4.5 and 7.4 meV, respectively. This fact indicates the good crystalline quality of the undoped GaInAsSb layer. The FWHM of the BE bands are smaller than or comparable to the best results previously reported on similar composition GaInAsSb layers grown by LPE and other growth techniques24. Additionally, a broad band is observed at the PL low energy region that is constituted by acceptor-related transitions24. It is very well-known that undoped GaSb and its alloys exhibit p-type conductivity caused by native defects such as VGa or VGaGaSb26. Moreover, for sample Te1, see Fig. 3b, LT-PL shows only two bands, one associated to excitonic transition BE2 and another transition associated to neutral donor Te-to-neutral acceptor (Te°A°).
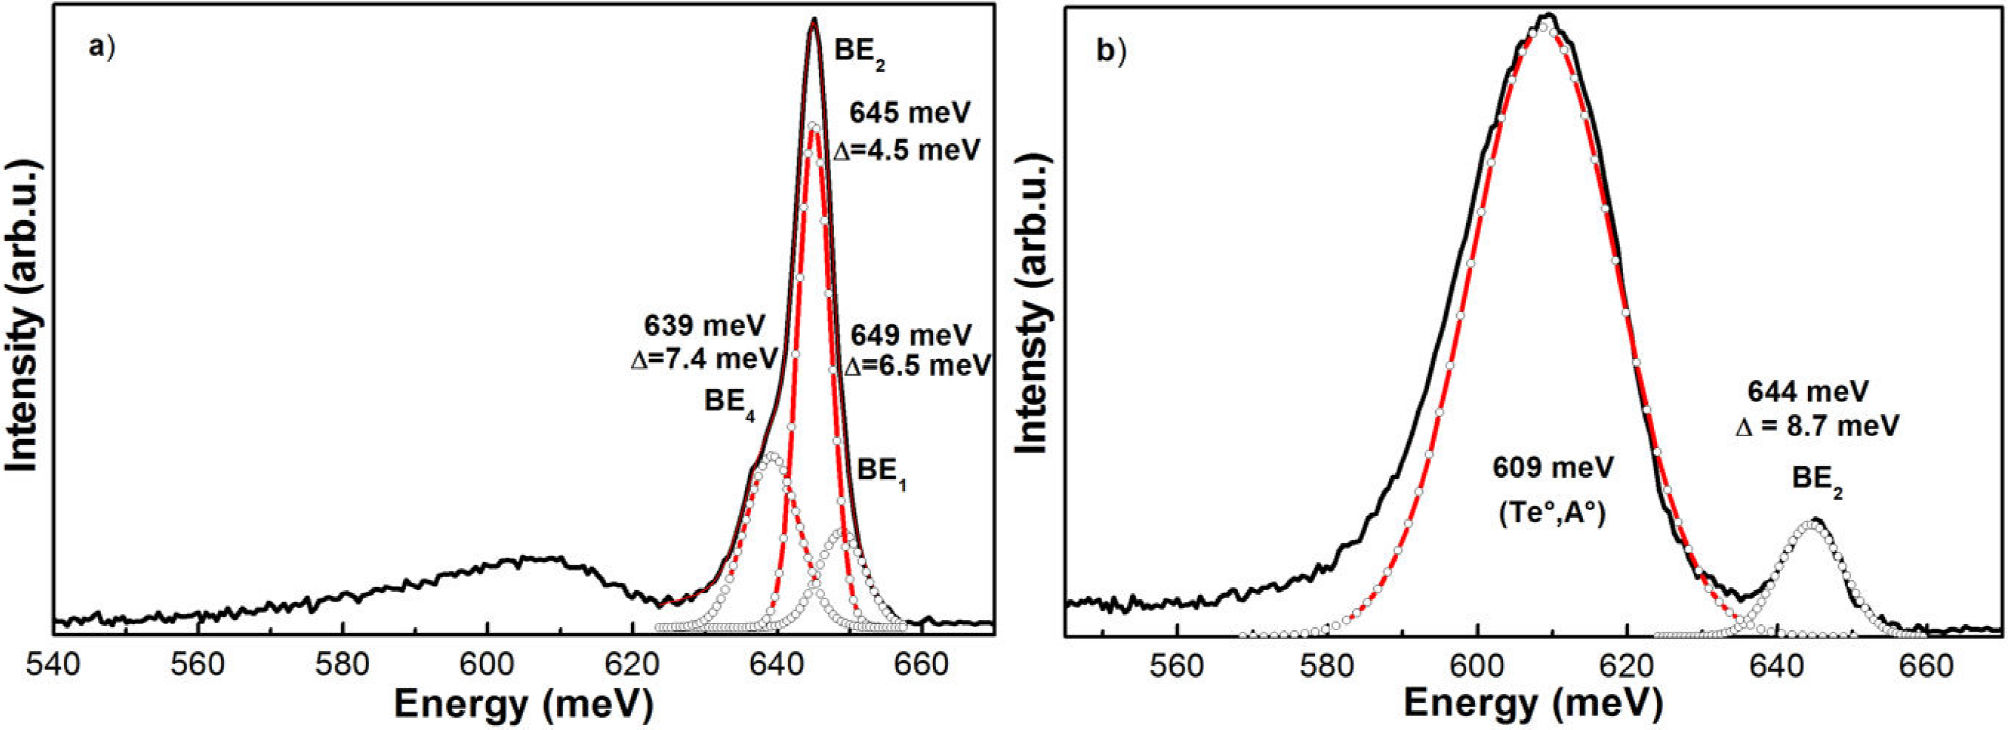
Figure 3. Decomposition of the measured GaInAsSb photoluminescence spectra into individual components (Gaussian shape) for two samples: a) Zn1 and b) Te1. The lines (-o-o-) are their respective fitting.
Figure 4a illustrates the PL spectra measured at 15 K of n-type samples studied and Fig. 4b shows the PL spectra of p-type ones. As one can observe the PL spectra of Te (or Zn)-doped GaInAsSb have features similar and show the same radiative transitions as in the case of low doping. Therefore, the features observed in PL spectra may be attributed to tellurium (zinc) incorporated in the films. Thus, the increase of dopant concentration above the degeneracy limit results in the substantial broadening of low-temperature PL spectra. The individual band due to the band-to-band (BB) transition, as can be seen in Fig. 4, completely overlap each other at free carrier concentrations. Additionally, at very high concentrations, the low-temperature luminescence band becomes highly asymmetric27.
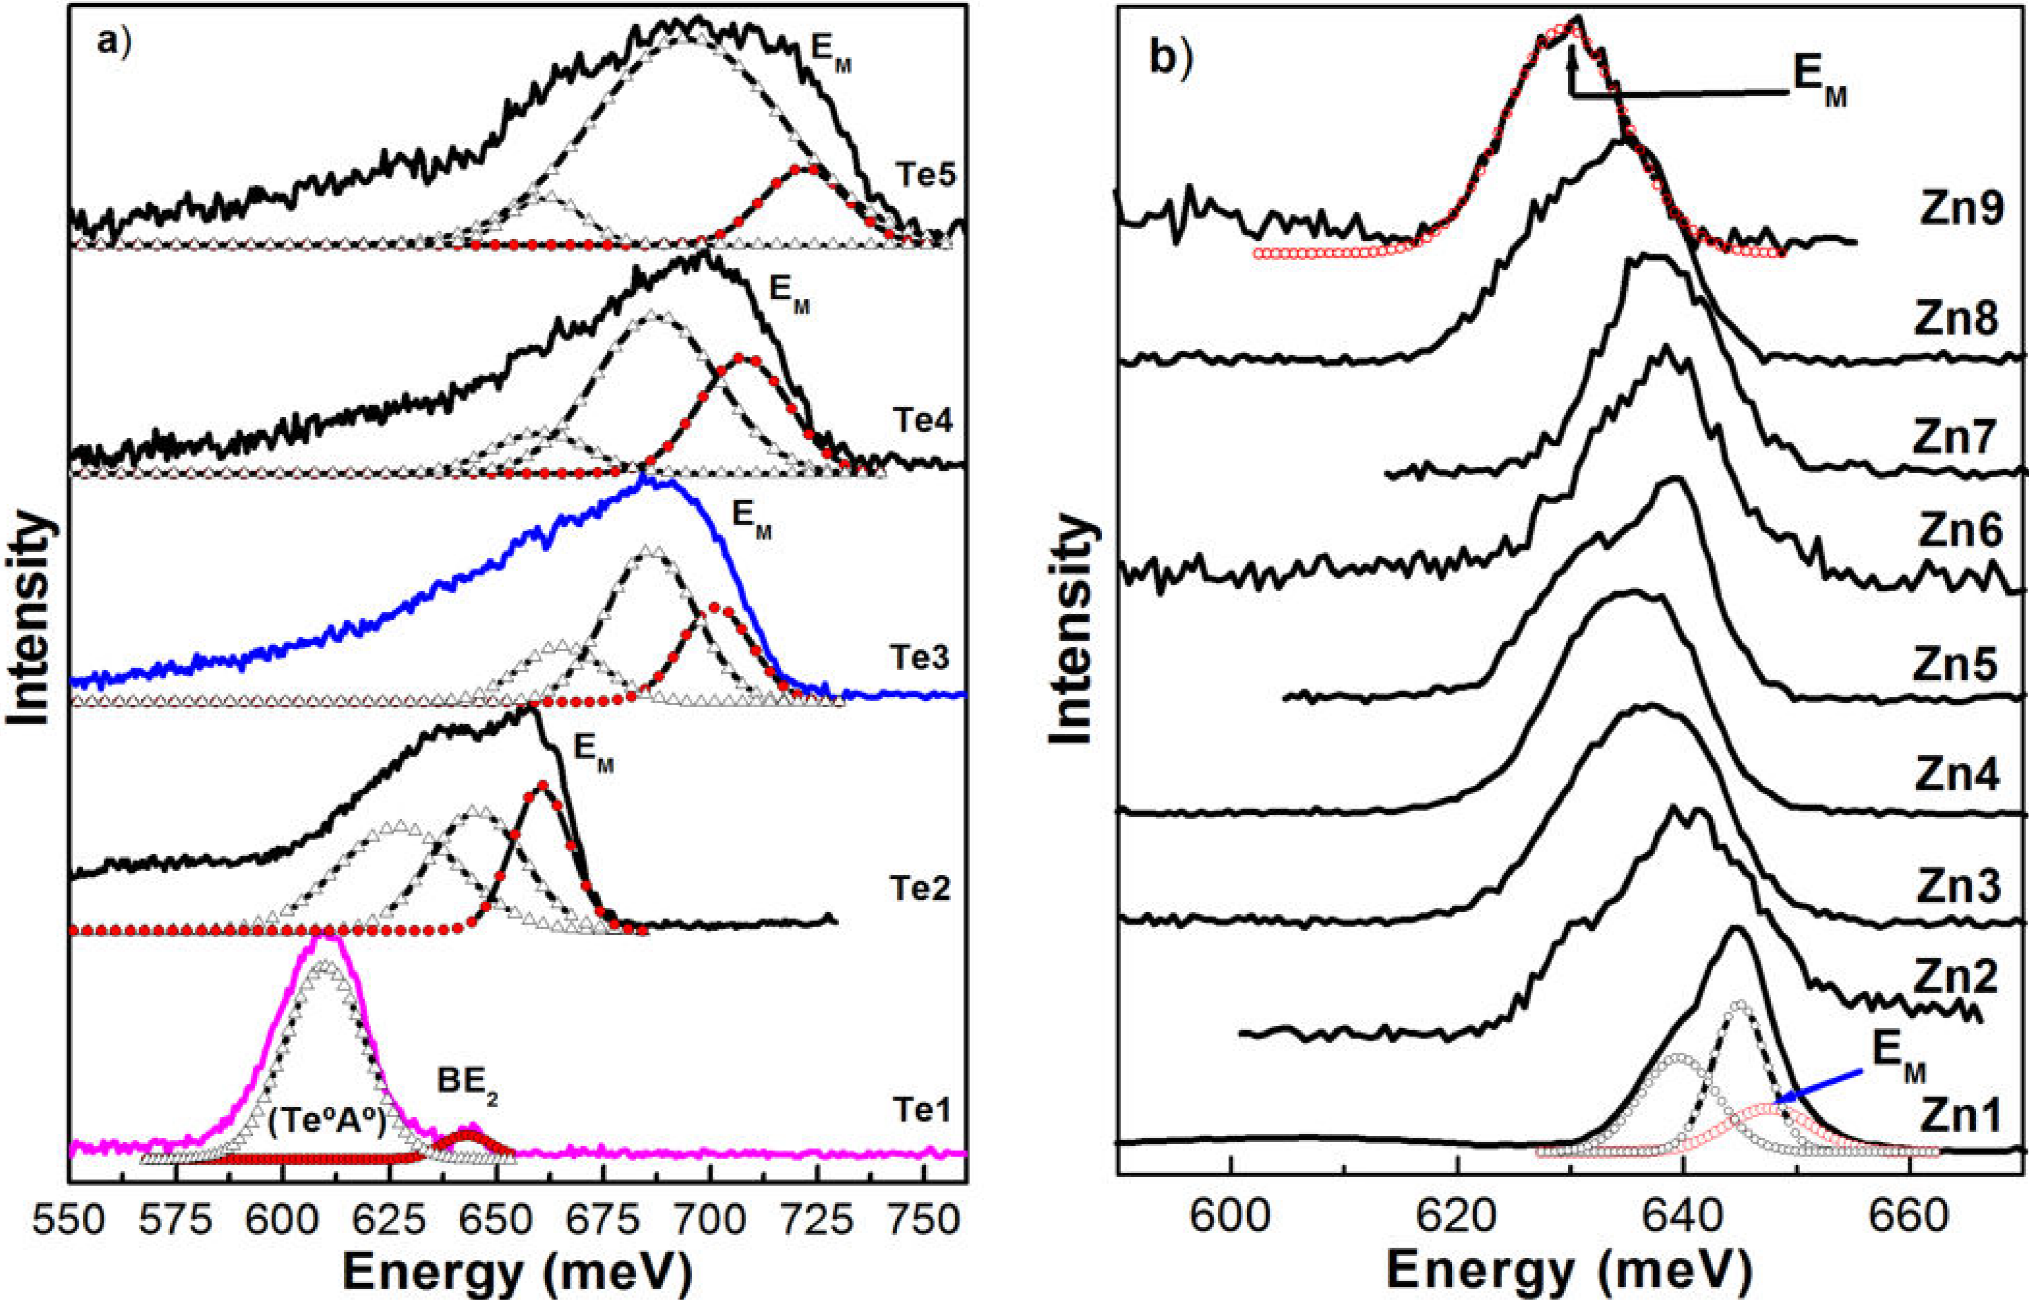
Figure 4. a) Photoluminescence spectra of n-type GaInAsSb as a function of [Sb2Te3] molar fraction in the growth solution at 15 K. The radiative transition band-to-band is renamed by EM to the Te-doped samples. b) PL spectra of p-type GaInAsSb as function of the Zn concentration. They were recorded at 120 mW of excitation power. The lines (-o-o-) correspond to the components of the experimental LT-PL spectra obtained by deconvolution by Gaussian curves. The radiative transition ban-to-band is renamed by EM to the p-type samples.
At low doping concentration, the donor (acceptor) impurity energy could be treated as a
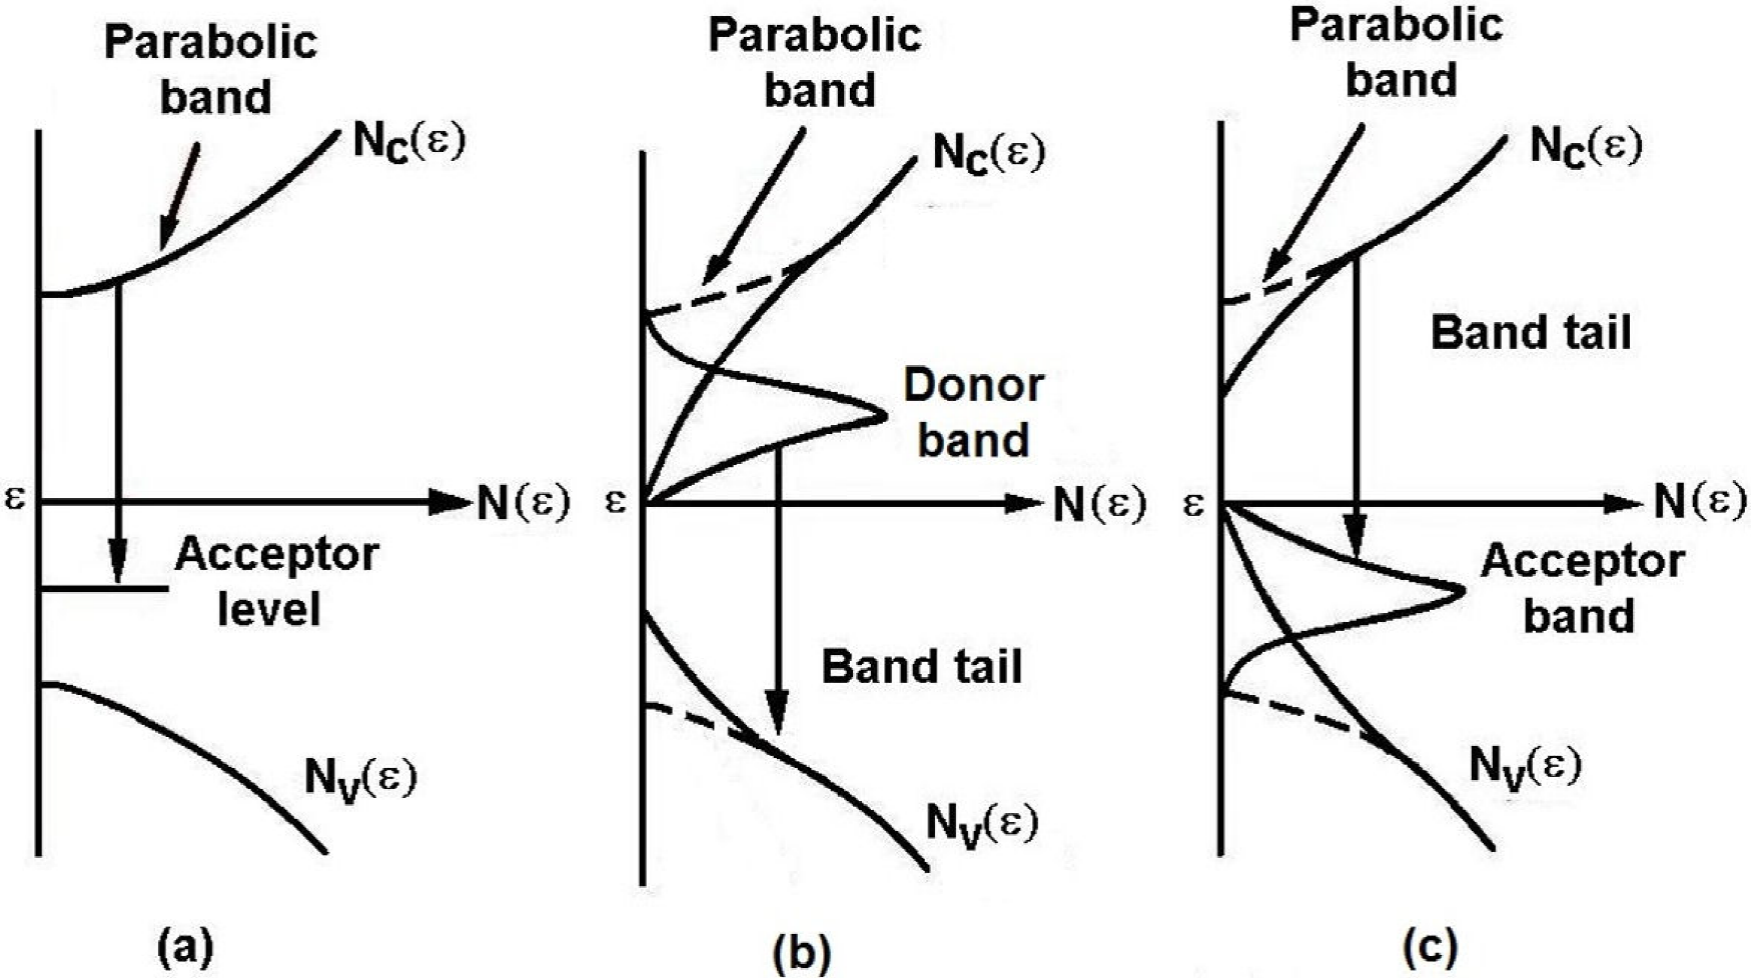
Figure 5. Schematic illustration of the photoluminescence emission from: (a) slightly doped p-type, (b) heavily doped n-type and c) heavily doped p-type samples28.
As the n (or p)-type dopant concentration is increased in the crystal; the average spacing of the impurity atoms becomes smaller. When this is close to or less than the Bohr excitonic radius of the impurity states, the majority carriers in the crystal become so numerous that their presence alters the lattice periodic potential. The calculated Bohr excitonic radius to the undoped quaternary alloy is
As can be observed in Fig. 4a, PL spectra of Te-GaInAsSb as the dopant concentration is increased the peak EM is shifted to higher energies in all investigated dopant range, this indicates that the PL spectra come from the direct band-to-band or direct impurity-to-band transitions following the k conserving rule. Unlike the photoluminescence spectra of Zn-GaInAsSb have a particular behavior, as can be seen in Fig. 4b, the main radiative band EM in the LT-PL spectra shifts toward lower energies (redshift) as the Zn molar fraction is increased in growth solution from 0-2.325 x 10⁻⁴. This indicates that photoluminescence has the same radiative transitions, as above. The spectral shape of the PL emission band is almost symmetrical. The asymmetry of the spectrum observed at higher Zn molar fraction, sample Zn8, in Fig. 4b strongly indicates that effective band-to-band or effective band-to-acceptor transitions dominate the emission across the energy gap breaking the k conservation31,32. The steep slope characterized by the exponential decay,
In order to compare the observed photoluminescence peaks with calculated transitions in high level of dopant concentration. It is necessary to include not only the usual band filling effect but also band gap shrinkage due to the exchange interaction among free carriers as well as the band tailing effect due to the Coulomb interaction of the free carriers with ionized impurities interaction. All the above-mentioned interactions are calculated taking into account the nonparabolicity of the conduction and valence bands, which result in a concentration-dependent effective mass. The three band Kane’s model34 has been used for the calculation of concentration-dependent effective mass. Kane’s model considers the interaction of the conduction band with the valence band, separated by the band-gap energy E
g
from the former. The valence band itself is composed of two bands with the energy separation of the spin-orbit split-off energy
where
The second term on the right hand side of Eqs. (2) depicts the deviation of the E - k dispersion from the ideal parabolic nature. Introducing the dimensionless nonparabolicity factors
These terms are named the nonparabolicity factors. Thus, calculating the concentration-dependence effective masses, with the following numerical values of Ga
1-x
In
x
As
y
Sb
1-y
band structure parameters:
where
These concentration-dependent effective mass expressions allow one for obtaining a useful expression for the Fermi energy of nonparabolic bands in terms of carrier concentration. It has been demonstrated for InP that the Fermi energy calculated by exact method using Fermi integrals differs only at low concentrations of the Fermi energy of nonparabolic bands obtained using the mathematical expressions above mentioned27. For high dopant concentrations, they agree very well with calculated values for the case of nonparabolic bands. Using the early obtained results and the energies of the bands EM for high levels of carrier concentrations, one may estimate the majority carrier concentration, which show a good agreement with the results obtained with the SIMS measurement38. In order to do this, it is necessary to include not only the usual band filling effect but also the band gap shrinkage due to the exchange interaction among free carriers as well as the band tailing effect due to the Coulomb interaction of the free carriers with ionized impurities interaction. All the above mentioned interactions are calculated taking into account the non-parabolicity of the conduction (or valence) band, which results in a concentration dependent effective mass. It is assumed that the hole distribution is highly degenerate, whereas the electrons (holes) introduced by optical generation occupy the states at the very bottom (top) of the conduction (or valence) band. Therefore, to a good approximation, the energy of the photoluminescence band EM arising from band-to-band (BB) transitions would be given by28,39:
Where
4. Conclusions
In order to summarize, in this work we have presented a systematic study of doping by tellurium and zinc in Ga0.87In0.13As0.14Sb0.86 epitaxial layers grown on (100) GaSb substrates by LPE. The epilayers studied were doped with Te and Zn in a broad range from low to high concentration. Raman spectra show two phonon bands, which may be assigned to the GaAs and (GaSb + InAs) mixture modes. The frequency of the former mode slightly decreases and the frequency of the latter decreases with increasing the dopant concentration. For low doping levels, the PL spectra show the presence of exciton-related transitions with a small FWHM value (7 meV), which is evidence of good crystalline quality of the layers. For higher doping levels, the PL spectra exhibit band-to-band and band-to-acceptor transitions, which merge in a broad band as the Te (or Zn) doping increases. An important result of the analysis is that the non-parabolicity of the conduction or valence band has to be taken into account in calculating the peak position of photoluminescence spectra at degenerate concentrations and in estimating the electron (or hole) concentration for the grown samples. The predictive model for the band gap narrowing has been applied to GaInAsSb, which is in good agreement with experimental results.


 nueva página del texto (beta)


