PACS: 64.60.-i; 71.; 78.20.-e
1. Introduction
SrF2, a strongly ionic crystal, is an important member of alkaline earth fluoride family (MF2, M = Ca, Sr, Ba). Their structural, optical, lattice dymamic and elastic properties have been extensively studied 1,2,3,4,5,6. Due to their unique properties, including low energy phonons, optical transparency, high resistivity and anionic conductivity 7, SrF2 has been applied in scintillation detectors 8 and luminiscent materials 9,10. As other members of the MF2, SrF2 undergoes a series of pressure induced phase transitions to highly coordinated 11.
In contrast of the great number of experimental and theorical works of CaF211,12,13,14,15,16 and BaF211,17,18,19,20 at high pressure, there is a very little studies about
pressure induced phase transition and properties of SrF2. At ambient
conditions, SrF2 crystallizes in the cubic fluorite structure with a
space group of Fm
Experimentally, Kourouklis et al.21 studied the pressure-induced phase transition by means
of the Raman scattering and reported that under hydrostatic pressure,
SrF2 can transform from cubic Fm
In present work, we report the results of theoretical investigation of pressure effect on the structural, electronic, optical properties of SrF2 by means of full-potential linearized augmented plane wave method within framework of the density functional theory.
2. Computational details
The full-potential linearized augmented plane wave (FLAPW) method as implemented in WIEN2k
package 25 has been used. For
structural calculations, the generalized gradient approximation (GGA) proposed by
Perdew et al.26
was employed as the exchange-correlation potential, and the maximum quantum number
(l
max ) for atomic wave functions inside the atomic
spheres was 10, the energy cutoff for plane wave expansion of wave functions in the
interstitial region was taken to be
Kmax
=7/RMT and the self-consistent
calculations are considered to be converged when the total energy of the system is
stable within 10-4 Ryd. For the integrations in the Brillounin zone, we
use 6 × 6 × 6, 6 × 5 × 9 and 7 × 7 × 4 mesh parameter grid for Fm
The electronic and optical properties were calculated using Tran-Blaha-modified Becke-Johnson (TB-mBJ) semilocal potential 28. This potential has been proven to give the more accurate band gap than LDA and GGA potentials, its results can be compared with those of hybrid functionals. The advantage of TB-mBJ is that it is computationally cheaper.
The linear optical properties of materials can be understood by means of the frequency dependent complex dielectric function
where, the extinction coefficient:
It is worth mentioning that in the optical calculations, we used the k-mesh much denser than that in structural and electronic calculations.
3. Results and discussions
3.1. Geometry optimization and phase transition
In the Fm
Table I. Lattice constants a, b, c (
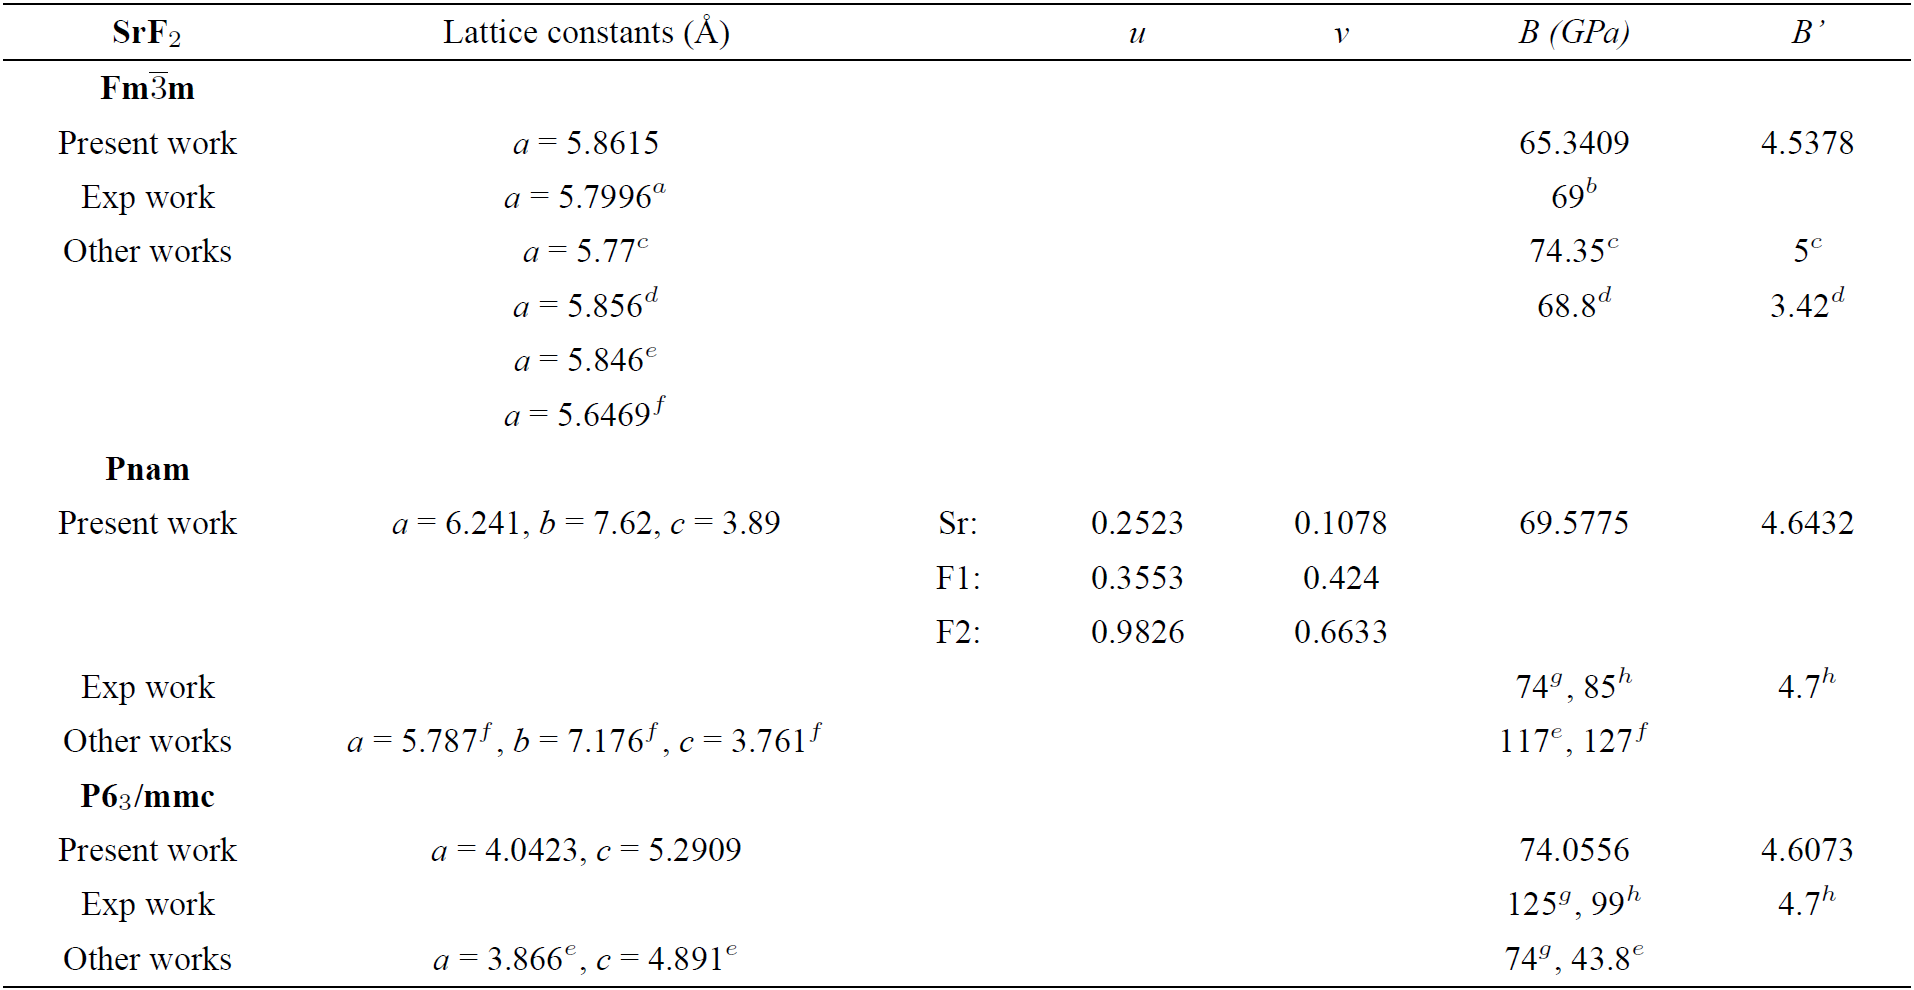
aRef. 31, bRef. 32, cRef. 6, dRef. 5, eRef. 24, fRef. 23, gRef. 11, hRef. 7.
There are two ways to determinate the transition pressure: the first is calculating the total energy curves of the two relevant phases to find out the common tangent, but this is difficult to give an accurate result 12, and the second is to calculate Gibbs free energy, the stable phase is one with lowest Gibbs free energy. In thermodynamic, the relation:
is well known. Since, the theoretical calculations were performed at zero temperature, then free Gibbs energy equals to the enthalpy:
Hence, the intersection of enthalpy versus pressure curve determines the transition pressure.
In the Fig. 1, we plot the calculated enthalpy
difference of Fm
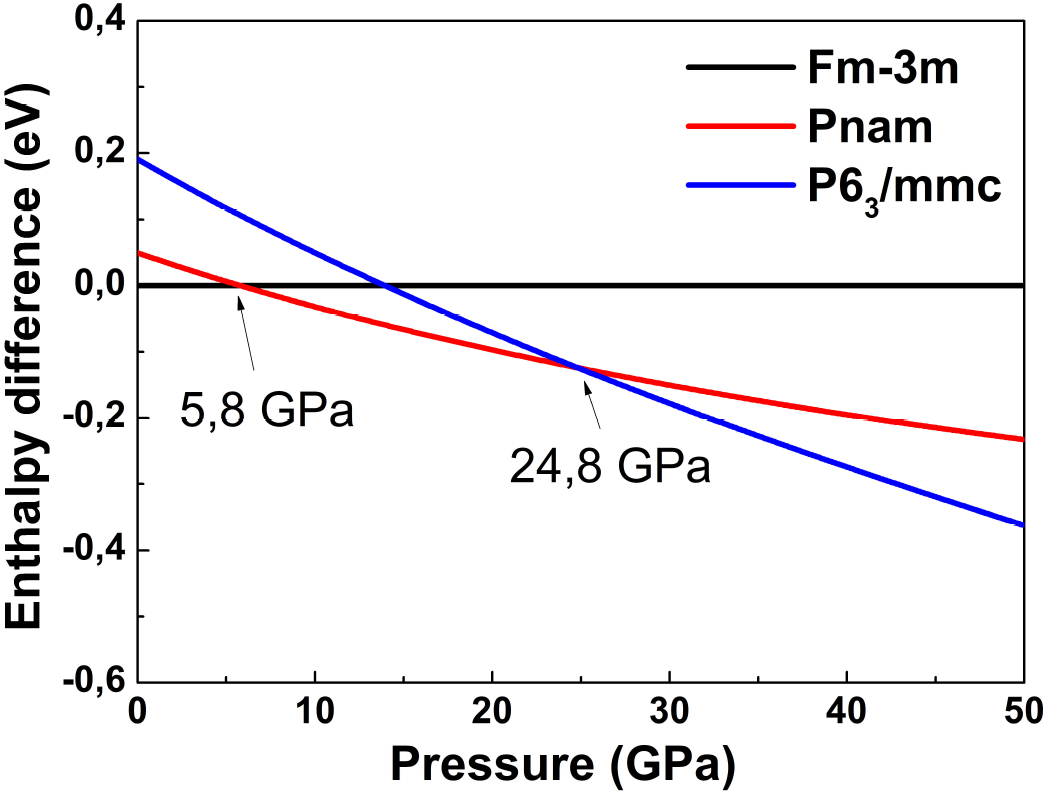
Figure 1. Enthalpy difference of considered phases with respect to Fm
Our calculations show that the volumen of SrF2 decreases 13.6% at the first transformation pressure, this result overestimates a littile the experimental one that is 8-10% 11, and at the second transition pressure, there is no remarkable change in volumen that agrees well with the results obtained in previous work 24 but underestimates the experimental result that is approximately 5%.
In the Fig. 2, we show the calculated lattice constants as a function of pressure, it is noted that the lattice constants of three structure decrease as pressure increases, and there is no notable difference of compressibility in the x, y, z directions of Pnam and P63/mmc structures.
3.2. Electronic properties
The Fig. 3 shows the band structures of SrF2 obtained at ambiente and high pressures. It is observed that the top of valence band is at X,
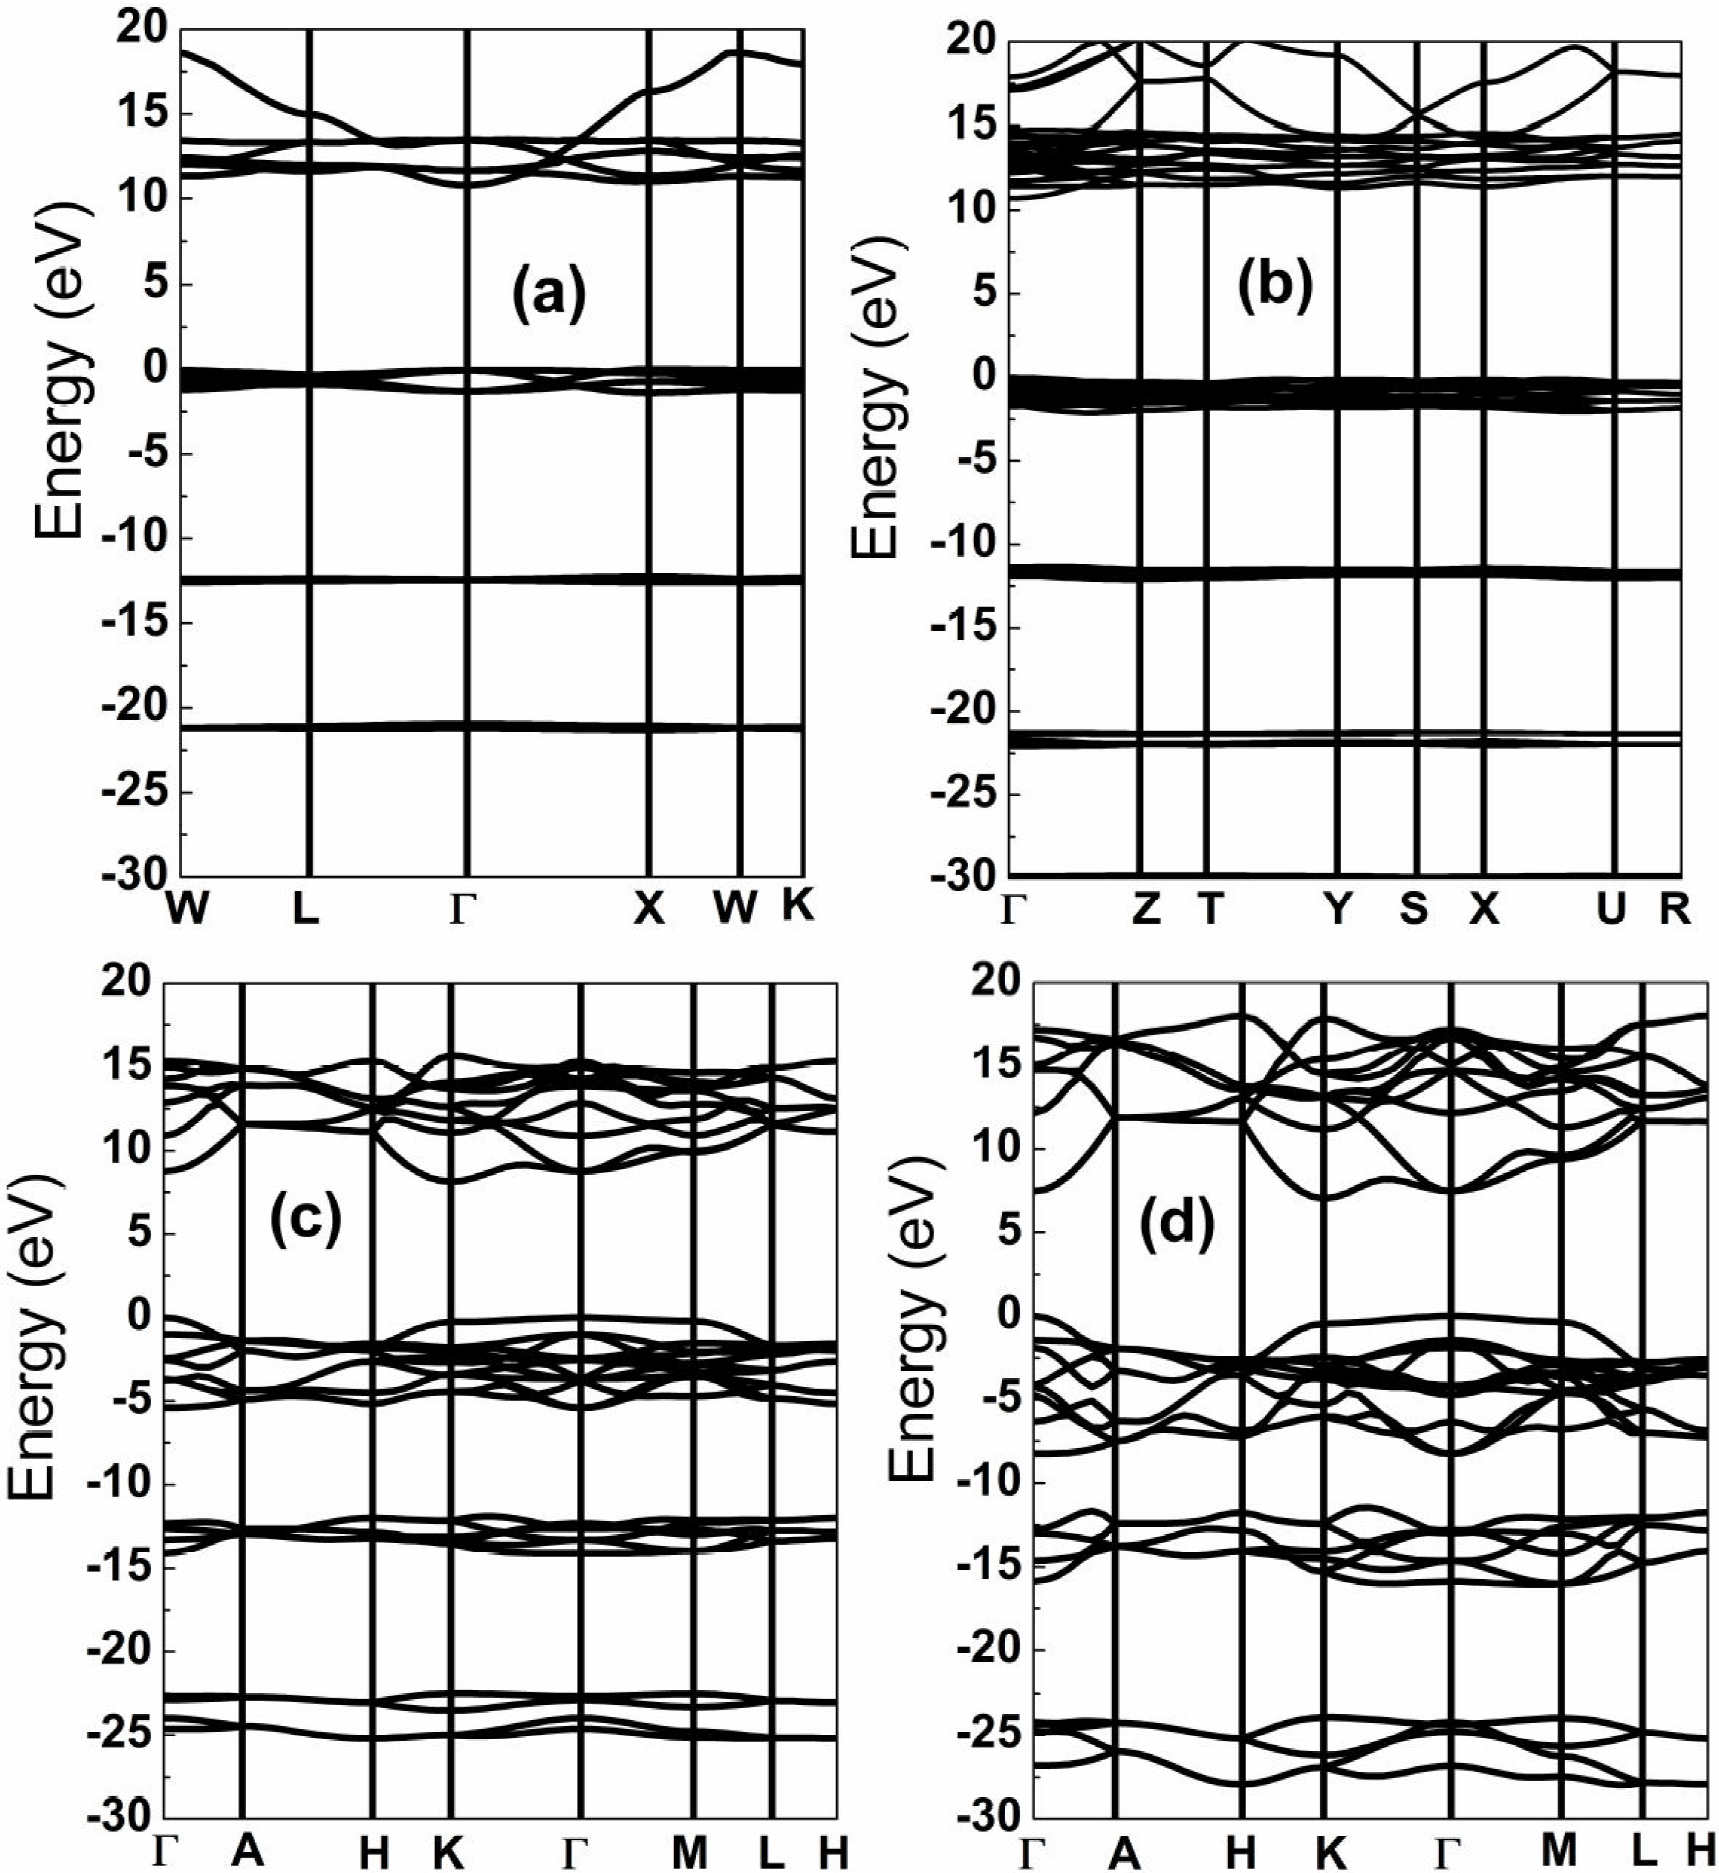
Figure 3. Energy band structure of SrF2 at several pressures. (a) 0 GPa, (b) 20 GPa, (c) 50 GPa, (d) 210 GPa.
The calculated energy band gap of SrF2 within pressure range from 0 to 50 GPa is shown in the Fig. 4. The band gap of cubic and orthorhombic structures increases as pressure increasing, but there is a drop of 0.88 eV of band gap at the first transiton pressure, this result was not observed in previous calculation 24, otherwise, before the second transition, our calculation does not indicate the reduction of band gap of Pnam structure as observed in 24 and for CaF216 and BaF218, this is maybe due to our calculated second transition pressure is much smaller than that obtained in 24, because we observe a saturation in band gap of Pnam structure between 28 y 30 GPa. In other hand, there is a collapse of 2.56 eV at the second transition pressure, and the band gap of P63/mmc decreases as pressure increases, but we do not observe metallization up to 210 GPa.
In order to analyze the electronic properties of SrF2, we have also calculated the partial density of state (PDOS) of constituent atoms Sr y F, that is shown in the Fig. 5. The peak at about -23 eV of lowest valence band is mainly derived from s state of F, while p state of Sr dominates the middle band of valence band at about -14 eV and the highest region of valence band is consituted mainly of p state of F. The conduction band at aproximately 11 eV arises mainly from the d state of Sr and the decrease of energy gap of P63/mmc as pressure increases is due to the drop of conduction band consisted of d state of Sr.
3.3. Optical properties
We have carried out the calculations of dielectric function and other linear optical properties are derived from this.
The dielectric function describes what an electric field such as an oscillating light wave does to material. The quantity
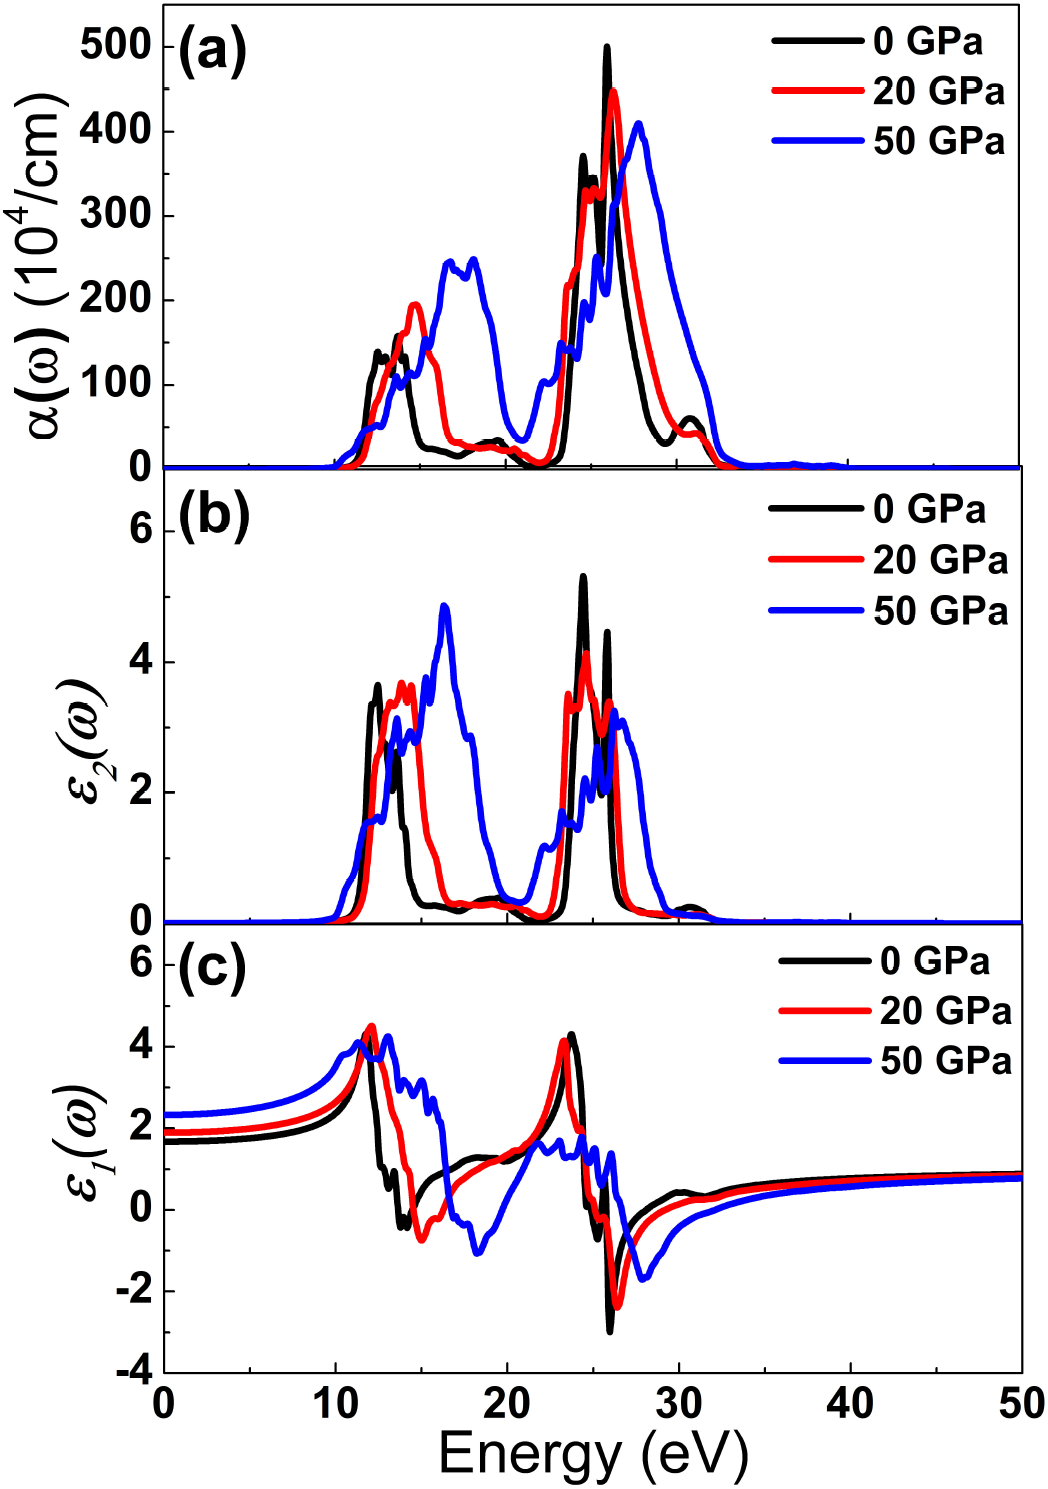
Figure 6. Optical functions (a) absorption coefficient, (b) imaginary and (c) real part of dielectric function as a function of energy at several pressures.
The refractive index determines how much light is bent, or refracted, when entering a material. The Fig. 7(a) shows refractive index as a function of photon energy, it is observed that this data is stable at energies smaller than 5 eV and higher than 40 eV and has oscillating behavior between this values. Generally, up to 16 eV, the refractive index increases as pressure increases and from this photon energy, there is contrary behavior. The Fig. 7(b) illustrates the reflectivity as a function of photon, at given pressure, SrF2 practically reflects no light with energy smaller than 9 eV and higher than 38 eV and region near 20 eV, SrF2 becomes good reflective material in two regions, the first is between about 10 eV and 18 eV, and the second from 25 eV up to 33 eV. The compounds with high reflectivity in the high energy region can be used as a good coating material to avoid solar heating. It is noted that the reflectivity increases as pressure increases.
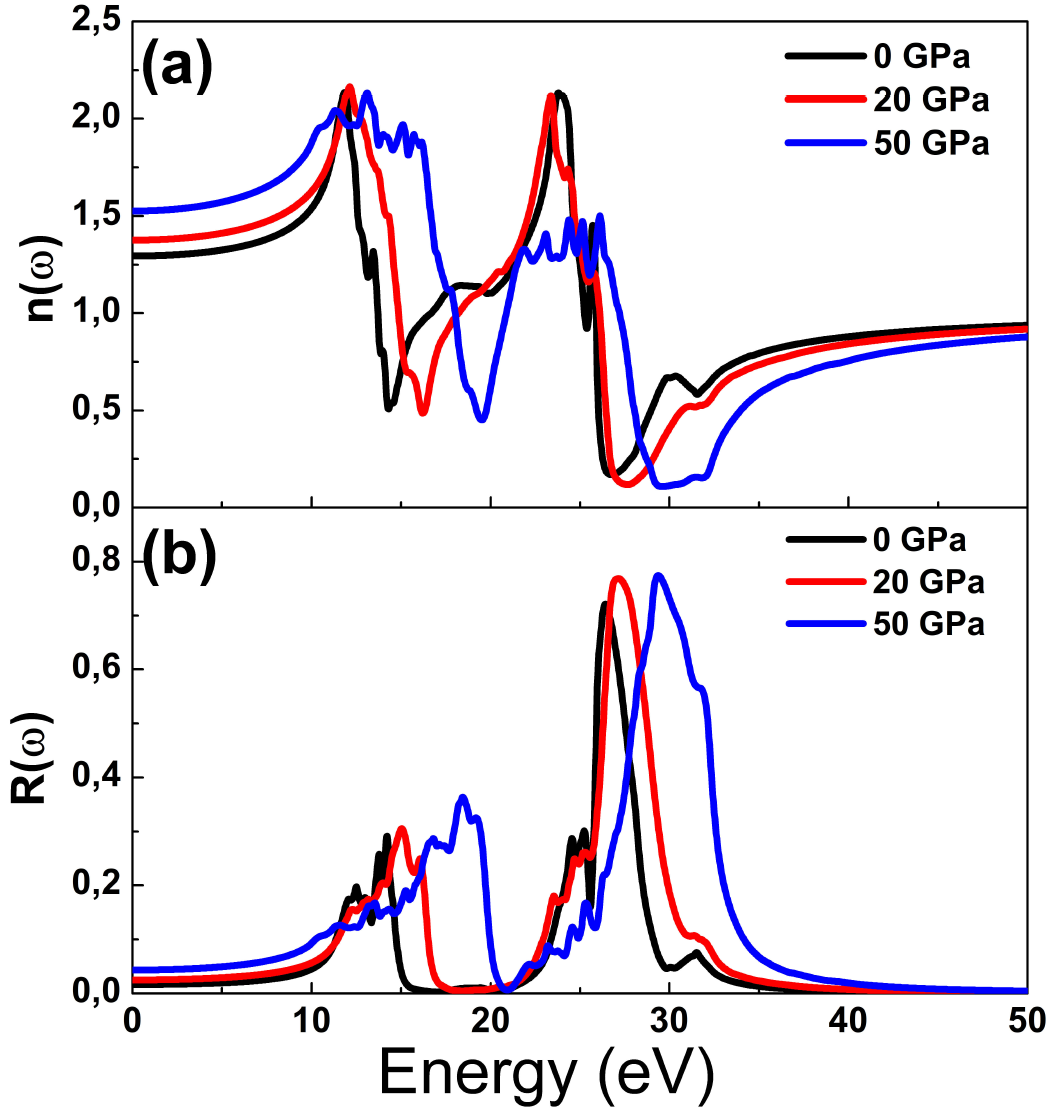
Figure 7. Optical functions (a) refractive index, (b) reflectivity as a function of photon energy at several pressures.
The photoconductivity spectra of SrF2 is shown in the Fig. 8(a), the photoconductivity starts at about 10 eV that, one more time the transparent nature of the studied material is confirmed. And the Fig. 8(b) plots the energy loss as a function of energy, there two peaks at given pressure, and we attribute these energy losses to emision of phonons. Of course, as pressure increases, the energy loss occurs at higher energy because it need more energy for generating phonons due to the reduction of atomic distance at high pressure.
4. Conclusions
We have made structure optimization of Fm


 nueva página del texto (beta)


