PACS: 61.05.cp; 74.70.Pq; 78.55.-m; 75.47.Gk
1. Introduccion
Perovskite manganites compounds with mixed manganese valence, La1-x
Ax
MnO3 where A for a divalent metal, have attracted a great deal of
attention due to anomalously large negative “colossal” magnetoresistance (CMR) for
2. Materials and Methods
The polycrystalline sample of the CSRO compound was synthesized by solid-state reaction method
at ambient pressure. Starting materials were RuO2 anhydrous (99.9%
STREM), SrCO3 (99.5% CERAC) and CaCO3 (99.99% BAKER). Prior to
weighing, SrCO3 and CaCO3 were preheated during 10-20 minutes
at 120°C in order to dehydrate them. Stoichiometric mixture of these starting
materials was done in air during 15 minutes using an agate mortar, resulting
homogenous slurry. The produced milled polycrystals were then annealed in air during
two days at a temperature between 700 and 800°C in a Thermolyne 46100 furnace (±4°C)
with the intention of decompose the carbonates. The resultant CSRO nano-crystals
were compressed into pellets (13 mm diameter, 1.0-1.5 ± 0.05 mm thickness), by
applying a pressure of 1/4 ton/cm2 for 15 minutes in vacuum. The
resulting compacted specimens were then sintered in air at 800°C during four days.
All reagents and final products were characterized by X-ray powder diffraction (XRD)
with a Bruker-AXS D8-Advance diffractometer using CuK( radiation
3. Results and Discussion
Figure 1 shows the XRD patterns of the
(Ca1-x
Srx)RuO3 system with x =
0.07, 0.10, and 0.1510-12. From those spectra, compounds show a solubility up to
x = 0.15. All samples crystallize in a single orthorhombic
phase identified as CaRuO3 PDF (70-2790) and form a continuous solid
solution. With respect to the examined diffractograms, it is worth to mention than
the compound with x = 0.10
(Ca0.90Sr0.10RuO3) present reflections of a
secondary phase identified as RuO213 and the lattice parameter a = 5.524
Å, b = 7.843 Åand c = 5.432 Å. The solid line
corresponds to an orthorhombic phase and it is identified as CaRuO3
compound with PDF (70-2790). The phase marked with an asterisk (*) corresponds to
the RuO2 compound, PDF (43-1027). The presence of this very small amount
of RuO2 compound was detected in the (Ca1-x
Srx)RuO3
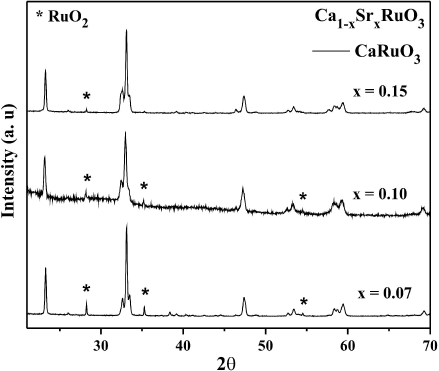
Figure 1 XRD patterns of (Ca1-x Srx)RuO3 system with x = 0.07, 0.10, and 0.15. The solid line corresponds to an orthorhom-bic phase and it is identified as CaRuO3 compound. The phase marked with an asterisk (*) corresponds to the RuO2 compound.
The next step was the characterization of the Ca0.90Sr0.10RuO3 compound achieved by SEM, to observe the morphology and grain sizes of the crystals. The micrograph shown in Fig. 2 was taken on the surface of the Ca0.90Sr0.10RuO3 compound with a magnification of the 50.00 K. X. Also, in some regions we observe semi-fusion than can be attributed to the ruthenium content. We can observe the secondary phase in the other gray color and the grain size varies between 0.592 and 1.598 µm. This coincide with the XRD data, than we obtain diverse components in the diffractograms, this generally happens, because SEM technique is more sensitive that XRD.
The electrical resistance as a function of temperature is present in Fig. 3. The Ca0.90Sr0.10RuO3 compound show a metallic behavior and short-range ferromagnetic interactions appear. This indicates that the ferromagnetism has been suppressed through the process of substitution of Sr2+ ions by Ca2+ ions10-14. For the compounds with large Ca2+ ions doping (
Figure 4 shows the PL spectra for the
(Ca1-x Srx)
RuO3 system with x = 0.0, 0.07, 0.10, 0.15 and 1.0
measured at room temperature. In the measurements performed at low temperature on
the (Ca1-x
Srx)RuO3 system with x =
0.0, 0.07, 0.10, 0.15 and 1.0, it was observed a change in the intensity peaks due
to temperature effects, although there exists small changes in the peaks position
due to effects of the Sr2+ ions incorporation. The most notable
observation in than the signal of PL is very intense when we have only
CaRuO3, but the gradual increase of the signal is due to
Sr2+ ions incorporation in the system, than indicates larger density
of states near Fermi level EF and smaller lattice distortion14. Therefore, the intensity is related to the peaks
of the 4d band than should be even narrower in CaRuO3 compound than in
SrRuO3 compound because a Ca-O bond has a more covalent character
than a Sr-O bond. This argument is consistent with the photoemission studies, which
reveal that the free-electron component in CaRuO3 compound is weaker than
in SrRuO3 compound and hence the 4d band is narrower in CaRuO3
compound15-16. Such changes in interactions are
observed through this change of chemical composition. Due to the other compounds of
the (Ca1-x
Srx)RuO3
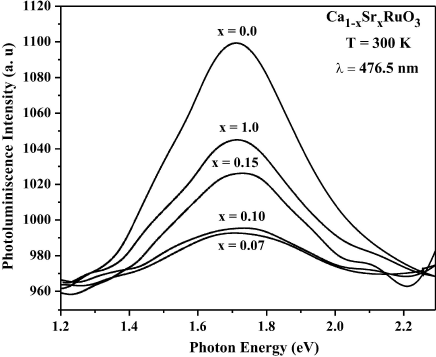
Figure 4 PL spectral on (Ca1-x Srx) RuO3 system with x = 0.0, 0.07, 0.10, 0.15 and 1.0 measured at room temperature.
In the Fig. 5 displays the PL spectra (1.3-2.5 eV) of the Ca0.90Sr0.10RuO3 compound in the range 6.7-296 K, for which an excitation laser wavelength of the 476.5 nm was used. The main peak at ∼1.73 eV, along with the shoulders at ∼1.38 eV and ∼2.05 eV, respectively, is observed through the whole temperature range. As to the PL bands with the photon energies of 2.2 and 2.5 eV in our studied CSRO compound, W.L. Zhu et al suggest that they do not originate from the oxygen vacancies or other defect states, which should be sample-dependent19. T. Ding et al suggest that the PL bands around 2.2 and 2.5 eV arise perhaps from the interband transition between the O 2p and Ru 4d bands20.
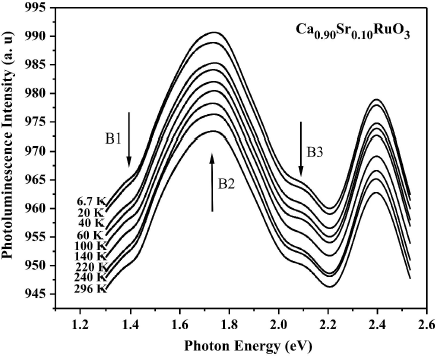
Figure 5 PL spectra of Ca0.90Sr0.10RuO3 compound at different temperatures from 6.7 to 296 K. Labels indicate the position of the peaks for the fitting. Excitation: λ = 476:5 nm.
In the following, we only concentrate on the temperature dependence of PL spectra in the photo-energy range 1.3-2.2 eV, ascribed to the Ru 4d band21. We use the multi-peaked Gaussian fitting to the mixed band (PL); the results are perfectly adjusted and determine the position of each peak, which is 1.38 eV for B1 , 1.73 eV for B2 , and 2.05 eV for B3 (Fig. 6), respectively, which represent three different types of electronic transitions.
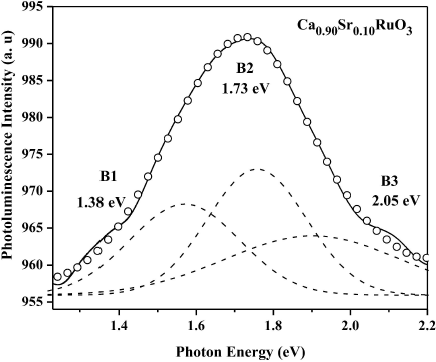
Figure 6 Experimental (open circles) and fitted (solid line) data of PL spectrum at 40 K. The best fit is given by three Gaussian curves B1 , B2 and B3 (dashed lines) centered at 1.38, 1.73, and 2.05 eV, respectively.
The temperature dependence of the intensity for each peak is clearly shown in Fig. 7. In the entire temperature range 6.7-296 K, the intensity of B1 and B2 increased with decreasing temperature. However, the intensity of B3 is almost temperature-independent. In order to reveal the mechanisms of PL CSRO, its related electronic structure should be understood.
Figure 8 shows the electronic structure of the Ru3+ and Ru4+ ions and the possible optical transitions. The upper panel shows the energy of Ru eg and t2g levels around the ferromagnetic transition region for adjacent Ru3+ and Ru4+ ions. The spin up eg levels in the Ru3+ ions are split by ETJ due to the J-T effect. Transition A is the dipole active photoionization of the J-T small polaron. The lower panel shows the energy levels in the metallic ferromagnetic state at low temperatures. The spin up and spin down eg bands are separated by ETJ. The aligned core spins in the t2g levels lie below the spin up eg levels by the crystal field energy ECF. Process B promotes a t2g core electron of Ru3+ to the spin up eg bands Ru4+ by a dipole allowed charge transfer process. The transition between the spin up eg bands and spin down eg bands depicted by C is allowed only transition involves electrons from the spin up eg level of Ru3+ to the spin down t2g level of Ru4+ with spin flip process.
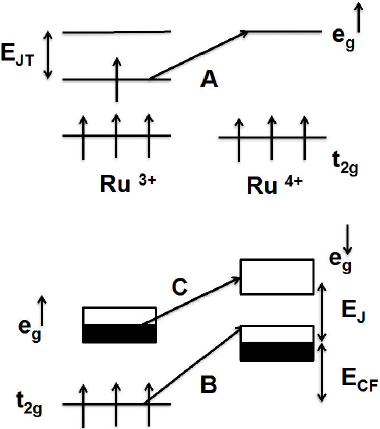
Figure 8 Schematic electronic structure of the eg and t2g levels of Ru3+ and Ru4+ ions and the optical transitions relevant to the PL peaks. From Ref. 8.
The existence of these three transition processes was supported by the temperature dependence. At lower temperatures, the spins are all aligned, so the effect of the intensity is expected to be maximum, whereas at higher temperatures, where the spins aligned randomly, and the effect of the intensity to be spin system is reduced. The growing intensity reflects the enhanced metallic character in Ca0.90Sr0.10RuO3 compound and helps to explain the observed ferromagnetism 10.
4. Conclusion
In conclusion, the visible PL of Ca0.90Sr0.10RuO3 compound in the range temperature 6.7-296 K was measured, and its temperature dependence was also presented. The intensities of the peak B 1 and B 2 varied with temperature. The Ca0.90Sr0.10RuO3 compound show a metallic behavior and short-range ferromagnetic interactions appear. The disappearance of the long-range magnetic order is commonly related to the distortion of the RuO6 octahedra associated with the partial or total replacement of Sr2+ ions by Ca2+ ions, and the corresponding narrowing of the 4d bandwidth.


 nueva página del texto (beta)


