


 nueva página del texto (beta)
 Inglés (pdf)
 Artículo en XML
 Referencias del artículo
 Enviar artículo por email
 Citado por SciELO
  Similares en
SciELO
Similares en
SciELO 
 Permalink
1. Introduction
From past to present days, determining the density distributions of nuclei has always been one of the main subjects in the field of nuclear physics. In this context, with the improvement of computational techniques, different approaches are applied to determine the density distributions of nuclei. Density distributions have been widely used to explain the structure of the nucleus, to determine nuclear potential and to investigate the nucleus-nucleus interactions [1-8]. There are various experimental and theoretical distributions in the literature. In this sense, it is known that the Fermi type density distribution gives good results for the charge densities of heavy nuclei while the gaussian density distribution is more convenient for the charge densities of light nuclei [9]. However, this is not a general approach that can be applied to every reaction at any energy. For this reason, investigation of density distributions of nuclei is still one of the most active topics in nuclear physics. Thus, it will be important to see the effectiveness of different density distributions in explaining the nuclear interactions.
8Li, which has a very short half-life (838 ms) [10], the first excited state at 0.980 MeV [10], and the 1n separation energy at 2.033 MeV [11], is an interesting test case in nuclear structure, nuclear reactions, and astrophysics. In this respect, 8Li is an important tool in the subsequent synthesis of heavier elements [10], to obtain seed nuclei for the r-process in Type II supernovae [12], and in inhomogeneous big bang nucleosynthesis [13]. Many studies have been performed both experimentally and theoretically on the 8Li nuclear interactions. Among all the possible reaction channels, elastic scattering has a particular importance. In this sense, Howell et al. [14] reported the angular distribution of the 7Li(8Li,8Li)7 Li reaction at Elab = 11 MeV. The angular distributions of 8Li from 9Be target were measured at 14, 19.6 and 27 MeV [10,11,15]. Becchetti et al. [15] reported the elastic scattering angular distributions of the 8Li + 13C, 8Li + 14N, and 8Li + 27Al reactions at Elab = 14 MeV. The angular distributions of 8Li + 51V reaction were reported at incident energies of 18.5 and 26 MeV [11,16]. The elastic scattering of 8Li from 58Ni were measured at incident energies of 14, 19.6, 20.2 and 27 MeV [15,17]. Kolata et al. [18] measured the elastic scattering cross sections of 8Li + 208Pb system at Ec.m. = 24.4, 27.6, 28.9, 30.6, 33.1 MeV.
In addition to all these studies, some works have been also undertaken to investigate the density distributions of the 8Li nucleus. Dobrovolsky et al. [19] determined the density parameters of the 6,8,9,11Li nuclei. The elastic scattering angular distributions of 8Li from different targets have been studied by using the gauss-gauss density distribution [20]. A different density distribution of 8Li has been obtained by means of the variational Monte Carlo calculations (VMC) [21]. In addition to all these findings, the new density distributions of 8Li nucleus can also be determined by using different approaches. For example, Dhiman [22] has determined different densities for the 56Ni nucleus. Thus, we consider that new density distributions of 8Li would be determined in terms of these approaches.
In the present study, we extend the theoretical analysis carried out in Ref. [20] in order to investigate the behaviors of different density distributions of 8Li in describing the elastic scattering angular distributions of 8Li on light, medium and heavy mass targets like 7Li, 9Be, 12C, 13C, 14N, 27Al, 51V, 58Ni, and 208Pb. With this goal, we perform the double folding model analysis within the framework of the optical model for nine different density distributions of the 8Li nucleus. Some of these density distributions are reported for the first time this work while others are available in the literature. Then, we compare the theoretical results with the experimental data. Thus, a relative evaluation of the effects of the density distributions on the scattering cross sections of 8Li is provided. We also develop new imaginary potential sets by using the parameters determined from the theoretical analysis of each density distribution.
Section 2 describes the theoretical formalism used in the calculations. Section 3 shows the results and discussion for the reactions and densities analyzed. Section 4 provides a brief summary and conclusions.
2. Theoretical Formalism
2.1. Model
The theoretical calculations of the elastic scattering angular distributions of the 8Li nucleus by different light, medium and heavy mass target nuclei are carried out in terms of the optical model. The real potential for the optical model is calculated by using the double folding model that needs the density distributions of projectile and target nuclei together with an effective nucleon-nucleon interaction potential (νNN). Thus, the double folding potential can be parameterized by
where ρP (r1) and ρT (r2) are the densities of projectile and target nuclei, respectively. The νNN is considered as the M3Y nucleon-nucleon (Michigan 3 Yukawa) realistic interaction displayed by [23]
where J00(E) is the exchange term given by
The imaginary part of the optical potential was assumed to have a Woods-Saxon shape
where AP and AT are the mass numbers of projectile and target nuclei, respectively. The code FRESCO [24] is used in the theoretical calculations.
2.2. Parametrization of density distributions of 8Li projectile
In the analysis, nine different density distributions both phenomenological and microscopical are used. Eight densities are evaluated phenomenologically while one density distribution is investigated microscopically. The necessary information on all density distributions is given in the following subsections.
2.2.1. The Variational Monte Carlo (VMC) density distribution
The VMC approach is applied to construct a variational wave function. 8Li density obtained by means of the VMC calculations using the Argonne v18 (AV18) two-nucleon and Urbana X three-nucleon potentials (AV18+UX) has been calculated by Pieper et al. [25]. This density distribution is marked as AV18 in our work.
2.2.2. The Gaussian-Oscillator (GO) density distribution
In this approach, the 8Li nucleus is considered to be composed of 7Li and n. Thus, the GO density distribution is the sum of the core (7Li) and valence (n) densities shown as
While the core density is assumed as the gaussian function given by
the 1n valence density is accepted as the 1p-shell harmonic oscillator density presented by
where Rc and Rv are the root mean square (rms) radii of the core and valence nucleon distributions, respectively. In our calculations, the values of Rc and Rv are taken as 2.47 fm and 2.62 fm, respectively [19]. The total matter distribution ρm, normalized to unity [26], is in the following form
where Nc and A are the number of nucleons in the core and the mass number, respectively. This density distribution is shown as GO in our work.
2.2.3. Gaussian-Halo (GH) density distribution
Another possible parameterization of the density of the 8Li projectile is the GH density distribution written as
where
α is a parameter in the range 0 ≤ α ≤ 0.4. Rm is the matter radius of the nucleus. The values of Rm and α are taken as 2.53 fm and 0.02 fm, respectively. This density is indicated as GH in our work.
2.2.4. Symmetrized-Fermi (SF) density distribution
The SF density, which is the fourth density distribution used in our work, is parameterized by
where R0 and a is the half-density radius and diffuseness parameter, respectively. R0 and a values are taken as 2.24 and 0.48, respectively [19]. This density distribution is displayed as SF in our work.
2.2.5. Gupta 1 density distribution
The two parameter Fermi (2pF) density is given by
where ρ0i (the central density) is in the following form
where R0i is half-density radius, and ai is the surface thickness parameter. Gupta et al. [27] determined R0i and ai parameters as [28]
This density is marked as G1 in our work.
2.2.6. Gupta 2 density distribution
Gupta et al. [29] reported also different values of R 0i and a i parameters as
This density distribution is shown as G2 in our work.
2.2.7. Ngô - Ngô density distribution
The Ngô - Ngô density distribution is assumed in the Fermi form shown by [30,31]
where
C is the central radius
with
The sharp radii of a neutron and a proton are taken as
with
This density distribution is marked as Ngo in the present study.
2.2.8. Schechter density distribution
Schechter et al. [32] obtained the Fermi parameters as
This density distribution is displayed as S in our work.
2.2.9. Moszkowski density distribution
The last density distribution analyzed in our work is the Moszkowski density in the Fermi form [33]. This density accepts the parameters of Fermi density as
The Moszkowski density is marked as M in this study.
3. Results and Discussion
In the present study, the double folding model analysis is performed for nine different density distributions (AV18, GO, GH, SF, G1, G2, Ngo, S, M) of the 8Li nucleus. The density distributions for these approaches are compared one to another in Fig. 1. Also, the root mean square (rms) radii of the examined densities are given in comparison with literature values in Table I. The largest radii are found for S and M densities, while the smallest radii are obtained for G1 and G2 densities. Also, we notice that the rms values of G1 and G2 densities are too far from the other densities and literature rms values, whereas the other rms results are in the range of literature values.

Table I The rms radii for the investigated density distributions.
| Nucleus | AV18 | GO | GH | SF | G1 | G2 | Ngo | S | M | Literature |
| 8Li | 2.344 | 2.482 | 2.530 | 2.488 | 2.061 | 2.074 | 2.485 | 2.573 | 2.574 | 2.53a, 2.50b, 2.44c, 2.37d |
a Skyrme-Hartree-Fock model in terms of the SK14 force parameters [35]. b Determined in Ref. [19] c Stochastic Variational Multi-Cluster approach [36,37]. d Determined in Ref. [39] via the interaction cross sections [38,39].
The real potentials are produced by using AV18, GO, GH, SF, G1, G2, Ngo, S, M densities while the imaginary potentials are determined as Woods-Saxon potential. In order to determine the optical potential parameters, the initial values of the depth (W0), the radius (rw) and the diffusion (aw) parameters of the imaginary potential are assumed as the values given in Ref. [20]. Then, to obtain better agreement with the experimental data, the test calculations are performed at step intervals of 0.1 and 0.01 fm. It is conceived that the parameters of the previous work [20] are suitable for our analysis. Thus, the rw and aw values of the imaginary potential are taken as 1.34 fm and 0.90 fm in all theoretical calculations, respectively. Thus, the normalization value and the imaginary depth are freely varied in the analysis.
The theoretical analysis related to the 8Li projectile is carried out through the experimental data available in the literature. With this goal, nine different target nuclei like 7Li, 9Be, 12C, 13C, 14N, 27Al, 51V, 58Ni, and 208Pb are considered as light, medium and heavy nucleus reactions. For light nucleus reactions, 8Li + 7Li (at 11 MeV), 8Li + 9Be (at 14, 19.6 and 27 MeV), 8Li + 12C (at 14 and 23.9 MeV), 8Li + 13C (at 14 MeV), 8Li + 14N (at 14 MeV), and 8Li + 27Al (at 14 MeV) are evaluated. The elastic scattering angular distributions of these reactions are obtained for nine different density distributions of the 8Li nucleus via the double folding model. The theoretical results are in very good agreement with the experimental data, as shown in Figs. 2-5. However, the experimental data on light nucleus reactions have an oscillatory structure, especially for 8Li + 13C reaction. Therefore, it is very difficult to achieve perfect agreement results with the experiment data. We think that the calculations including more interactions such as coupled channels may provide better results.
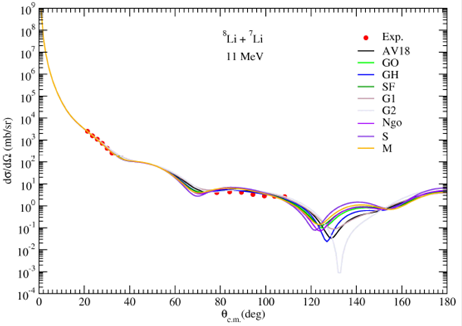
Figure 2 The elastic scattering angular distributions for AV18, GO, GH, SF, G1, G2, Ngo, S, M density distributions of the 8Li + 7Li reaction at ELab = 11 MeV in comparison with the experimental data. The experimental data are taken from Ref. [14].
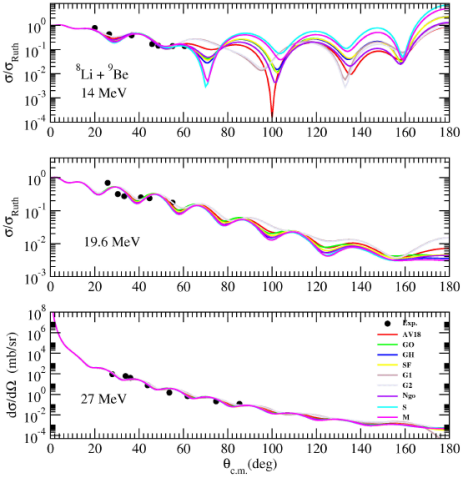
Figure 3 Same as Fig. 2, but for 8Li + 9Be reaction at ELab = 14, 19.6, and 27 MeV. The experimental data are taken from Refs. [10,11,15].
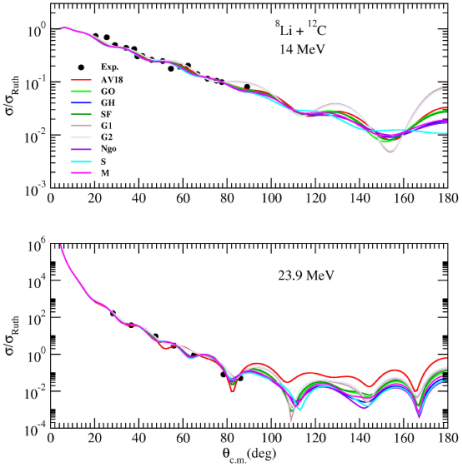
Figure 4 Same as Fig. 2, but for 8Li + 12C reaction at ELab = 14, and 23.9 MeV. The experimental data are taken from Refs. [15,34]
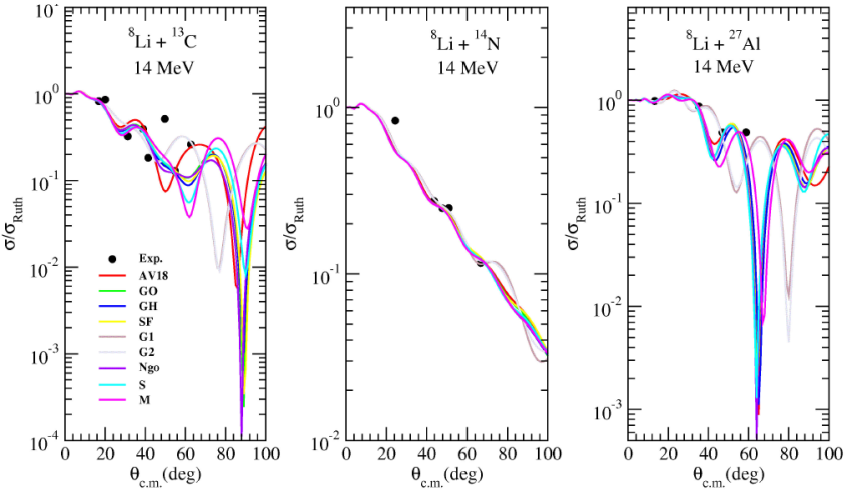
Figure 5 Same as Fig. 2, but for 8Li + 13C, 8Li + 14N, and 8Li + 27Al reactions at ELab = 14 MeV. The experimental data are taken from Ref. [15].
As medium nucleus reactions, 8Li + 51V (at 18.5 and 26 MeV) and 8Li + 58Ni (at 19.6, 20.2 and 22 MeV) reactions are investigated. The elastic scattering cross sections are compared with the experimental data in Figs. 6 and 7. Despite the limited number of experimental data points, the agreement between theoretical results and experimental data is quite good.
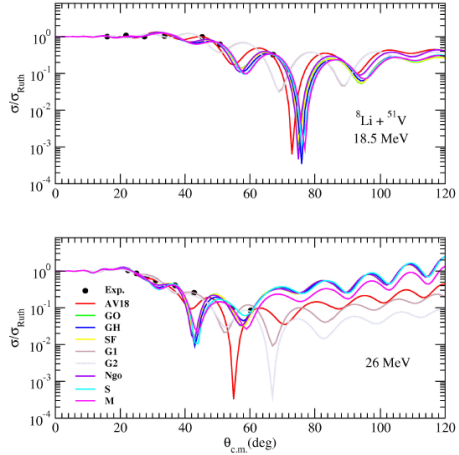
Figure 6 Same as Fig. 2, but for 8Li + 51V reaction at ELab = 18.5, and 26 MeV. The experimental data are taken from Refs. [11,16].
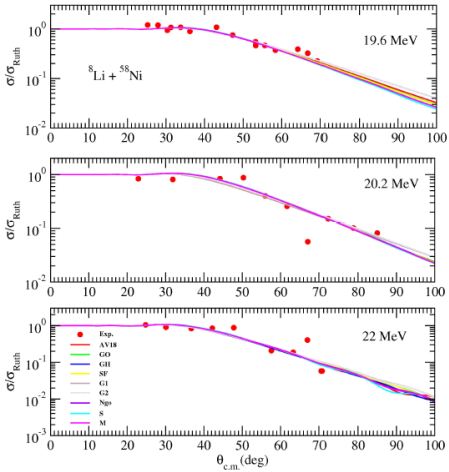
Figure 7 Same as Fig. 2, but for 8Li + 58Ni reaction at ELab = 19.6, 20.2, and 22 MeV. The experimental data are taken from Refs. [15,17].
Finally, as heavy nucleus reaction, the angular distributions of 8Li + 208Pb elastic scattering are analyzed at incident energies of 25.3, 28.6, 30.0, 31.7 and 34.3 MeV. It is observed that our theoretical results describe well the experimental data, which are shown in Fig. 8.
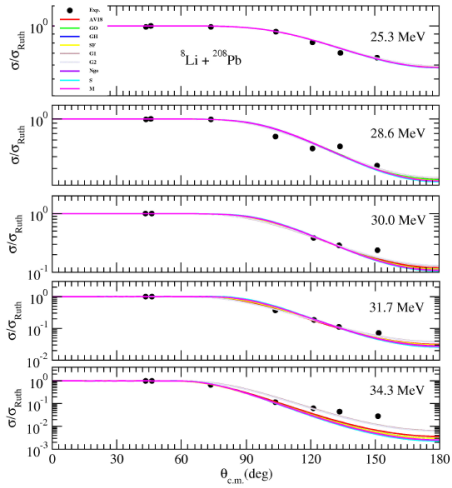
Figure 8 Same as Fig. 2, but for 8Li + 208Pb reaction at ELab = 25.3, 28.6, 30.0, 31.7, and 34.3 MeV. The experimental data are taken from Ref. [18].
We display NR values versus E/AP for the density distributions examined with this study in Fig. 9. They are grouped into light (7Li, 9Be, 12C, 13C, 14N, 27Al), medium (51V, 58Ni) and heavy (208Pb) nuclei. The normalization constant (NR) is applied to get good agreement results with the experimental data in the theoretical calculations based on the double folding model. It is assumed that NR ≈ 1 shows the success of the theoretical results. If NR value deviates from unity, it is considered as the uncertainty or oddities in the experimental data or to the fitting of the theoretical calculations [23]. We notice that the theoretical results are sensitive to the NR values according to the reaction type, density and energy. In general, we observe that the NR values of reactions on light and medium mass targets are around unity. However, this sensitivity increases for some density parameterizations. We observe that the theoretical results for reactions on heavy target do not change much according to the NR value. Therefore, we take N = 1 for heavy mass reactions.
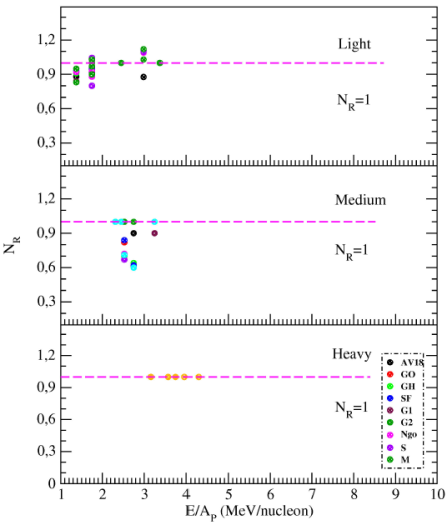
Figure 9 The normalization values (NR) used in the calculations with AV18, GO, GH, SF, G1, G2, Ngo, S, M density distributions versus E/AP.
The total reaction cross-section (σR) is one of the important reaction observables. Different approaches or models are commonly used to calculate the cross-sections of the investigated reactions. In this context, the close-fitting cross-sections for different approaches may be an indication that the experimental data are well reproduced. The σR values for all the densities are listed as compared with the literature in Table II. We notice that the theoretical results are close together and provide a suitable description of the literature in a general sense. However, we have observed differences between theoretical and literature cross sections for 8Li + 9Be reaction. We consider that this is due to the approaches applied in the theoretical calculations and the structural differences of nuclei.
Table II The cross-sections (in mb) obtained for AV18, GO, GH, SF, G1, G2, Ngo, S, M density distributions in comparison with the literature.
| Target | ELab | σAV18 | σGO | σGH | σSF | σG1 | σG2 | σNgo | σS | σM | σLiterature |
| (Mev) | (mb) | (mb) | (mb) | (mb) | (mb) | (mb) | (mb) | (mb) | (mb) | (mb) | |
| 7Li | 11 | 1437.1 | 1467.0 | 1480.0 | 1467.3 | 1388.6 | 1367.3 | 1465.2 | 1473.0 | 1489.0 | |
| 9Be | 14 | 1613.2 | 1599.8 | 1613.5 | 1598.5 | 1547.3 | 1561.8 | 1628.3 | 1560.6 | 1579.2 | 1332 [11] |
| 19.6 | 1955.9 | 2004.6 | 1991.7 | 1975.1 | 1900.4 | 1901.7 | 1977.1 | 1985.0 | 1971.8 | ||
| 27 | 2081.5 | 2117.8 | 2125.2 | 2090.9 | 1998.4 | 2043.8 | 2113.0 | 2127.9 | 2116.9 | ||
| 12C | 14 | 1579.7 | 1617.0 | 1660.6 | 1619.6 | 1481.8 | 1487.4 | 1666.1 | 1698.9 | 1665.6 | |
| 23.9 | 1702.1 | 1842.8 | 1876.6 | 1836.6 | 1767.0 | 1760.6 | 1881.7 | 1886.4 | 1869.2 | ||
| 13C | 14 | 1295.0 | 1432.1 | 1447.8 | 1443.3 | 1304.5 | 1306.8 | 1447.4 | 1428.9 | 1377.7 | |
| 14N | 14 | 1659.1 | 1700.6 | 1700.4 | 1715.6 | 1501.1 | 1532.3 | 1713.6 | 1713.2 | 1705.3 | |
| 27A1 | 14 | 776.9 | 783.0 | 799.3 | 782.1 | 710.9 | 815.8 | 792.7 | 795.3 | 825.3 | |
| 51V | 18.5 | 767.3 | 957.5 | 975.4 | 957.9 | 748.2 | 750.9 | 873.9 | 985.5 | 981.0 | 975 [11] |
| 26 | 1473.2 | 1075.1 | 1093.2 | 1072.9 | 1450.4 | 1591.6 | 1082.9 | 1102.2 | 1310.6 | 1510 (70) [16] | |
| 58Ni | 19.6 | 1447.7 | 1432.5 | 1433.9 | 1430.7 | 1447.1 | 1448.1 | 1444.3 | 1417.0 | 1435.0 | |
| 20.2 | 1417.8 | 1438.2 | 1439.2 | 1417.4 | 1636.1 | 1533.2 | 1419.8 | 1420.6 | 1441.0 | ||
| 22 | 1463.8 | 1488.7 | 1520.6 | 1519.0 | 1529.8 | 1515.4 | 1434.7 | 1392.8 | 1438.6 | ||
| 208Pb | 25.3 | 240.5 | 240.8 | 241.6 | 241.1 | 239.3 | 239.4 | 242.0 | 242.4 | 241.8 | 225 [18] |
| 28.6 | 503.3 | 490.2 | 488.1 | 496.3 | 518.2 | 518.7 | 488.8 | 482.0 | 483.8 | 504 [18] | |
| 30.0 | 612.0 | 596.4 | 573.5 | 595.9 | 648.4 | 639.6 | 575.0 | 557.5 | 571.1 | 624 [18] | |
| 31.7 | 880.9 | 800.9 | 721.7 | 793.9 | 923.2 | 924.1 | 733.7 | 685.8 | 727.8 | 885 [18] | |
| 34.3 | 1290.3 | 1318.1 | 1281.6 | 1319.3 | 1069.0 | 1094.8 | 1281.4 | 1274.1 | 1286.0 | 1219 [18] |
In this study, one of the main objectives is to derive the imaginary potential sets. These potential sets are necessary to describe various nuclear interactions of 8Li with more different target nucleus and energies. In this context, the imaginary potential sets are derived by using the imaginary potential parameters obtained from the theoretical analysis of the elastic scattering cross sections of the 8Li nucleus from 7Li to 208Pb target nuclei at various incident energies. These new and practical equations for each density distribution are parameterized in the following form:
for AV18 density,
for GO density,
for GH density,
for SF density,
for G1 density,
for G2 density,
for Ngo density,
for S density,
for M density,
4. Summary and conclusions
This paper discussed the theoretical calculations of the elastic scattering angular distributions of 8Li scattered from light (7Li, 9Be, 12C, 13C, 14N, 27Al), medium (51V, 58Ni) and heavy (208Pb) mass target nuclei. The real potential of each system has been produced for nine different densities of 8Li via the double folding model inside an optical model framework. It has been observed that our results are in good agreement with the experimental data. Then, new and practical equations of the imaginary potentials for each density investigated with this work have been derived from fitting the data. These equations will provide a convenient database in describing various nuclear reactions of the 8Li nucleus with different target nuclei and at several energies above the Coulomb barrier.

