1. Introduction
Rubbers are an important type of material widely used for industrial purposes due to their unique properties. They are also subject to important research and study in the materials science field, owing to their potential in the development of new materials with improved mechanical performance when compounded with reinforcing fillers. Until now, carbon black has led the market as reinforcing filler for rubbers. Nonetheless, its high polluting potential and its dependence on oil as the main source for its synthesis remain as a drawback. Hence, its substitution by more inert inorganic reinforcements such as clays has been an issue for further research. Recent investigations in the field of thermoplastics have shown that when compounded with small amounts of some clays with particle sizes in the order of nanometers, the resultant composites display improved thermal, mechanical, barrier and electric properties. Similarly, the study of rubber/clay nanocomposites is an active area of research nowadays. In nanocomposites, a significant fraction of the polymer is within a distance of several nanometers of the inorganic particle surface. This interface has potentially different structure and molecular dynamics than the bulk. In some reported cases, the nanoparticles do not effect at all on the dynamics, whereas in others a very thin layer of a few nanometers in the thickness of interfacial polymer with restricted mobility has been detected around the filler particles, while the rest of the polymer follows bulk dynamics [1-5]. Additionally, changes introduced by the necessary and conventional vulcanization process in rubbery materials also affect the molecular dynamics [6,7].
The Thermally Stimulated Depolarization Currents (TSDC) technique is an efficient tool for the characterization of polymeric materials in general because it allows knowing, in a very precise way, the molecular dynamics of their long chains, which are related to its macroscopic properties [8-13]. Its high sensitivity allows exploring the molecular dynamics at different scales, from chain segments of the size of the repetitive unit that produce local and restricted movements (secondary relaxations), to long chain segments or even whole chains whose movements are cooperative or of long range (segmental relaxations). Both processes correspond to dipolar relaxations.
Relaxation processes attributed to spatial charge carriers can also be measured by TSDC. Ionic or electronic current is produced by the combination of two processes: the injection of charge coming from the TSDC cell electrodes or the thermally stimulated movement of charge carriers inherent to the sample. The theory used to explain thermoluminescence due to charge relaxation processes has also been successfully used to explain the currents in TSDC measurements from the same origin [14-18]. The band structure formed by solids, even those of amorphous microstructure, originates energy sub-levels known as traps. Charge carriers are confined in these traps and emerge from them when heated. The depth of the traps, as a first approximation, can be assumed as unique, and its measurement is the activation energy of the process. Nonetheless, in practice, the trap depths in many solids are not the same and vary in an ample margin of values. Thus, peaks associated with those thermoluminescent (and dielectric) relaxation processes usually tend to be wide.
Under the assumption of unique activation energy, models are formulated based on the formalism of the kinetics of chemical reactions [19,18] which constitute the kinetic models. The kinetic model of first order assumes the recombination of charge carriers, once they have left the traps, as the most probable relaxation process [14]. The TSDC current density corresponding to this kinetics, obtained at a constant heating rate v, is described by the following equation
where σ n0 is the trapped carriers density at the discharge initial temperature, s 0 is the inverse of the relaxation time τ 0 of charge carriers, and E a is the activation energy. These are the three parameters to be adjusted in the experimental data analysis. The second-order kinetic model assumes the process of re-trapping the charge carriers into the traps as the most probable relaxation process [20]. When recombination and re-trapping take place simultaneously in the solid, the process is better described by the general-order kinetic model, which constitutes intermediate situations between the first and second-order kinetics. In this model, the current density is described by the equation
The parameter b is equal to 1 in first-order kinetics and 2 in second-order kinetics, even though values lower than 1 and higher than 2, as reported in the literature [16], can be found. In the case of general-order kinetics, there are four fitting parameters: σ n0 , s 0, E a , and b. In the process of determining these parameters, the following expression must be minimized by the non-linear least squares fitting technique [16], the expression is
where N is the number of experimental data, T i is the temperature corresponding to each measurement, J(T i ) is the TSDC current density measured at this temperature, J c (T i ,σ n0 ,s 0 ,E a ,b) is the current density according to the chosen model and with n 0 ,s 0 ,E a ,b fitting parameters.
Detailed studies of the effect of the dispersion of the inorganic nanophase on the molecular dynamics in solid substances are seldom reported. Thus, the aim of this work is to further explore the molecular dynamics of a rubber/clay system, through the study of the previously obtained fitting parameters in spatial charge relaxations by TSDC. Besides, a qualitative study of the dipolar relaxations of a rubber/clay system by TSDC is presented. Composites of natural rubber/montmorillonite were prepared, and their molecular dynamics were characterized by TSDC and related to the filler dispersion determined by Transmission Electron Microscopy (TEM). A conventional NR/carbon black system was also prepared and analyzed for comparison purposes.
2. Experimental
2.1. Materials
Natural rubber (NR) (SMR 20 grade) was used as polymeric matrix in the preparation of composites. Three layered silicates (montmorillonite) supplied by Southern Clay Products Inc. were employed in the preparation of the formulations. They are commercialized by the names of Cloisite® 15A, Cloisite® 30B, and natural sodium montmorillonite (Cloisite® Na+), which was organically modified in our laboratory. Their characteristics, reported by the supplier, are shown in Table I.
2.2. Experimental procedures
Sodium montmorillonite (Cloisite® Na+) was organically modified using octadecylamine and hydrochloric acid [21]. The clay was dispersed in hot water (about 80◦C) at 1200 rpm, and then the amine [(NH2(CH2)17CH3] was added, and kept under mechanical stirring for 10 minutes. After that period, HCl was added and kept under stirring for 15 minutes. Finally, the dispersion was allowed to cool down, always under stirring, for 30 more minutes. The product was filtered and dried at 80◦C, under vacuum for 48 hours, to obtain a montmorillonite intercalated with octadecyl-ammonium (OMMT). The OMMT thus prepared had an interlayer spacing of 1.8 nm [22].
The rubber/clay nanocomposite samples were prepared following the standard procedure described in ASTM D3184, in a laboratory Farrel Banbury internal mixer, and an open two-roll laboratory mill. First of all, the natural rubber was broken down by mastication and then the zinc oxide, stearic acid, antioxidant, and filler were added in the internal mixer. Then, the compound was discharged, banded and allowed to cool down. Afterward, the compound was added to the tworoll mill and the curatives were incorporated. Table II shows the different composites prepared.
TABLE II Formulations prepared in this work (in parts per hundred).
| Ingredient | F1 | F2 | F3 | F4 | F5 | F6 | F7 | F8 |
| Natural Rubber (NR) | 100 | 100 | 100 | 100 | 100 | 100 | 100 | 100 |
| Zinc Oxide (ZnO) | 5 | 5 | 5 | 5 | 5 | 5 | 5 | 5 |
| Stearic Acid | 2 | 2 | 2 | 2 | 2 | 2 | 2 | 2 |
| Antioxidant | 1 | 1 | 1 | 1 | 1 | 1 | 1 | 1 |
| Cloisite® Na+ modified (OMMT) | 3 | 5 | ||||||
| Cloisite® 15A | 3 | 5 | ||||||
| Cloisite® 30B | 3 | 5 | ||||||
| Carbon Black | 10 | |||||||
| 2-Mercaptobenzothiazole disulfide (MBTS) | 1 | 1 | 1 | 1 | 1 | 1 | 1 | 1 |
| Sulphur | 2.5 | 2.5 | 2.5 | 2.5 | 2.5 | 2.5 | 2.5 | 2.5 |
Curing curves were recorded using an Ektron EKT-2000S vulcameter at 160.0 ± 0.5 oC, following the standard procedure in ASTM D5289. Once the scorch and curing times (t s and t 90) were obtained, sheets of approximately 2.0 mm in thickness were compression molded and vulcanized in a Carver press. The morphologic study of the samples was carried out by Transmission Electron Microscopy (TEM) using a JEOL JEM1220 equipment, with an acceleration voltage of 100 kV. Samples were cut out from the compression molded sheets, by ultramicrotomy (Ultracut UCT by Leica) at about −100◦C.
The standard protocol followed when the Thermally Stimulated Depolarization Currents (TSDC) technique was used consists in applying a polarization of a direct current (DC) voltage V p to a sample located between a pair of circular parallel-plate electrodes at a temperature T p during a time t p to reach the equilibrium polarization at this temperature. The sample was under a nitrogen atmosphere in the course of polarization. Then, it was cooled down to a temperature T 0 << T p under the applied voltage. Once at T 0, V p was turned off, and the system remained frozen-polarized in the absence of an applied voltage. Afterwards, the sample was heated at a constant rate of v = 6 K/min, while a high sensitivity Keithley 6430, electrometer measured the polarization rate change. This rate change is the depolarization current density as a function of temperature J(T). Polarization conditions were selected to properly separate the segmental relaxations from those relaxations at higher temperatures. TSDC spectra were normalized to the area of the sample, applied voltage and sample thickness, for comparison purposes. The electrodes are circular, stainless steel, and coated with a thin gold film. For space charge experiments, the blocking electrodes were not used.
3. Results and discussion
3.1 TEM results
Figure 1 shows the TEM micrographs of NR/Cloisite® 15A composites, where exfoliated clay structures are clear. A higher degree of exfoliation was obtained at lower concentrations of the clay. Figure 2 shows that in those composites prepared with Cloisite® 30B, the clay is present as exfoliated as well as tactoid structures. This fact indicates that Cloisite® 15A is more compatible with natural rubber than Cloisite® 30B. Finally, Fig. 3 displays TEM micrographs of the composites of NR with OMMT. Exfoliated and intercalated structures are visible, which are signs of compatibilization. From the morphological analysis, it is clear that Cloisite®15A is the most compatible of the clays (more exfoliation), followed by OMMT, and Cloisite®30B as the least compatible of the three.
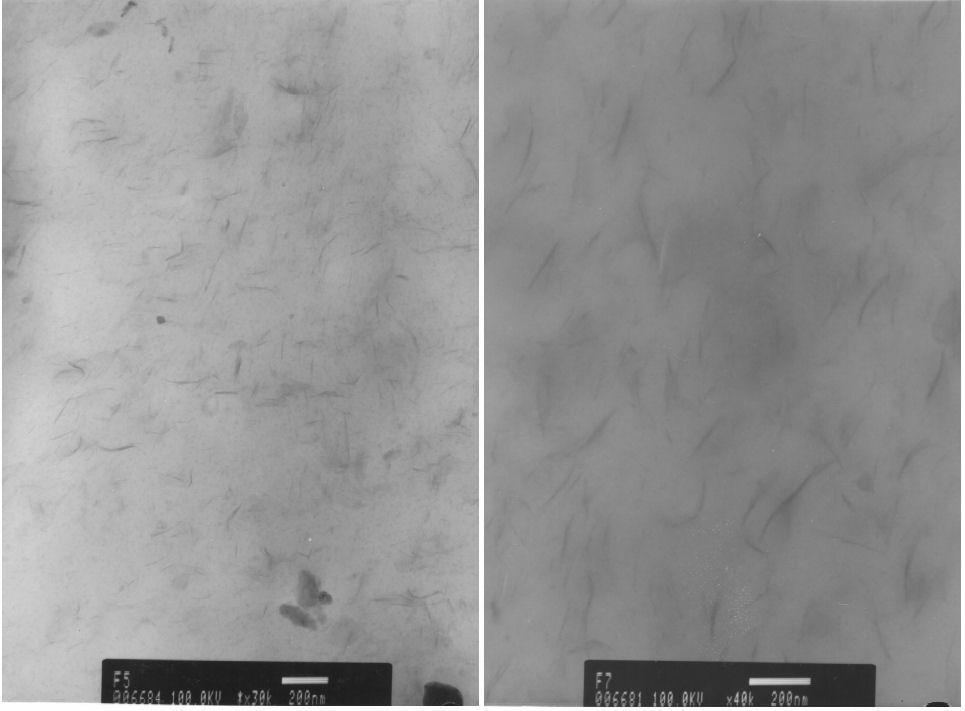
FIGURE 1 TEM micrographs of NR/Cloisite®15A nanocomposites: 3 phr (left micrograph), and 5 phr of clay (right micrograph).
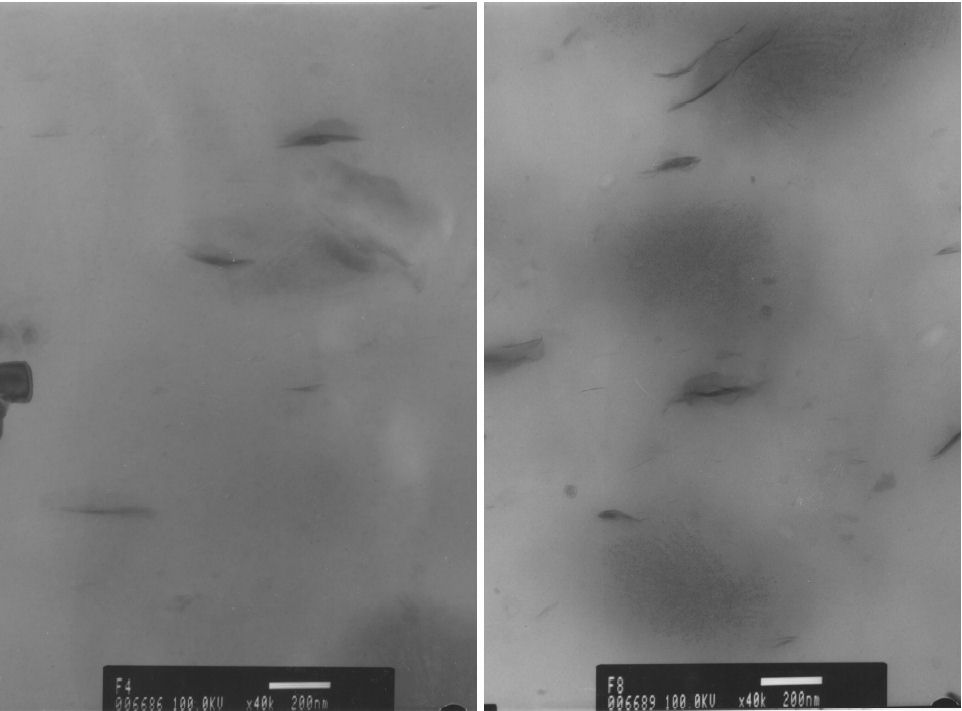
FIGURE 2 TEM micrographs of NR/Cloisite®30B nanocomposites: 3 phr (left micrograph), and 5 phr of clay (right micrograph).
3.2. TSDC Results: Dipolar relaxations
Figure 4 shows the TSDC spectra of segmental relaxation of natural rubber (NR) and its composites with 3 parts per hundred (phr) of the nano clays in the temperature range between 200 and 240 K. All samples were polarized at 297 K during 30 seconds, in the 100 to 400 Volts range. The peaks exhibit the dielectric signal of the glass transition of the rubber, with a glass transition temperature T g of approximately 210 K [1]. In TSDC spectra, the area under the current density vs temperature curve is proportional to the amount of mobile electric dipoles susceptible to orientation [11]. In that sense, both the peak intensity and its width can indicate, at the molecular level, interaction between the rubber matrix and the filler. All TSDC peaks are wide, suggesting the existence of complex molecular dynamics in the elastomeric matrix due to its heterogeneous nature. The wide relaxation peak of the NR formulation without clay (cf. Fig. 4) indicates that molecular dynamics are affected by the presence of the curing system and antioxidants added in its preparation and by its vulcanization. This conclusion is consistent with dielectric studies carried out using broadband dielectric spectroscopy (BDS) [6,7]. In Fig. 4 the spectrum corresponding to the NR/Cloisite®15A compound displays the lowest intensity and a doublet peak. This result suggests that rubber chains are restricted in their movement owing to their interactions with the nano clay, analogously with what Dynamic Mechanical Thermal Analysis (DMTA) results reported in the literature have shown [23-26]. Besides, the temperature at the intensity maximum T m and width at half intensity height ∆T were obtained from Fig. 4 and are reported in Table III. From these results it is clear that the relaxation peak of the composite containing Cloisite®15A is wider and moved towards higher temperature than those of the remaining samples, indicating the presence of important interactions between rubber chains and clay nanoparticles which unfolds that this composite presents the strongest compatibilization between phases [1]. These results are in agreement with those from the morphological analysis; that is, the interactions at the filler/rubber interface are stronger in the composite with Cloisite®15A than in any other composites because it presents a higher degree of exfoliation (cf. Fig. 1). Similar results were reported by Joly et al. [27] through SAXS, TEM, and measurement of mechanical properties. Formulations with OMMT and Cloisite®30B unfold narrower relaxation peaks due to the presence of zones where the inorganic phase forms tactoids because of fewer interactions (cf. Fig. 2). The peak of natural rubber without clay is wider than those in the composites containing Cloisite®30B and OMMT, which suggests that the mobility of the reorientable dipolar entities associated with the antioxidant and curing system ingredients is restricted by the presence of the nanophase. Arroyo et al. [28] concluded that the organic treatment of the silicate increases the interlayer spacing, which allows the dispersion of the silicate layers into the matrix at a nanoscale level and improves the filler-matrix compatibility. Thus, they reported better mechanical properties for those composites.
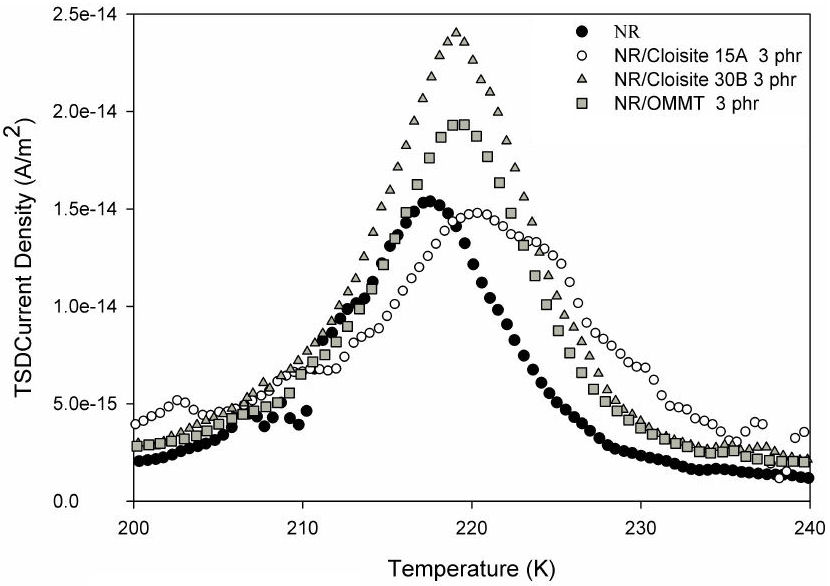
FIGURE 4 TSDC spectra at room temperature (T p = 297 K, t p = 30 s) of natural rubber and its composites with Cloisite®15A, Cloisite®30B and organically modified montmorillonite (OMMT). Relaxations around glass transition temperature of the rubber are shown in this spectra.
TABLA III Temperature at the intensity maximum (Tm) and peak width at half intensity height of TSDC relaxation bands of natural rubber and its nanocomposites.
| Sample | T m ±0.1 K | ∆T ±0.2 K |
| Natural Rubber (NR) | 217.5 | 12.0 |
| NR/Cloisite®15A | 220.1 | 16.5 |
| NR/Cloisite®30B | 219.1 | 10.9 |
| NR/OMMT | 219.2 | 11.4 |
In Dynamic mechanical thermal analysis (DMTA), Teh et al. [23,24] reported a reduction in the value of the mechanical loss factor tan δ with the incorporation of an organoclay, and attributed this phenomenon to a strong interaction between the rubber matrix and the clay. An additional relaxation peak at a higher temperature in the tan δ vs. temperature curve was also reported by the authors, which may represent the part of the rubber that is intercalated, that is, located between the clay layers.
According to Varghese et al. [25], the smaller segmental peak (or glass transition relaxation peak), the higher the reinforcing efficiency of the filler is. Hence, a higher reinforcement effect could be predicted for the Cloisite®15A and by the OMMT in the present work, following the form of TSDC dipolar peaks. Varghese et al. also reported a more or less pronounced doubling or tripling of the segmental peak (as additional peak and/or shoulder on the main peak, also found in TSDC spectra in the present work) which suggests that at least a part of the NR molecules is less mobile. Reduced chain mobility owing to the physical absorption of the NR molecules on the filler surface causes a height reduction of the segmental peak. The multiplication of the segmental peak hints for several NR populations with different chain mobilities and this behavior could be a consequence of the silicate intercalation/exfoliation by NR.
Varghese and Karger-Kocsis [26] also reported that a pronounced segmental peak in DMTA analysis reflects high mobility of the polymer chains when their contacts to the filler are low, and a reduction on the height of this peak indicates a strong interaction between NR and the silicate. A similar explanation could apply for an increase in the width and a height reduction in TSDC spectra in the present work.
With the reinforcing fillers in the rubber matrix, the peak maxima are shifted towards higher temperatures, as shown in Table III. The larger displacement was experienced by the composite containing Cloisite®15A, where the peak is located at 220 K. This fact is interpreted as a decrease in mobility of the rubber chain, due to a strong adhesion at the filler platelets/polymer interface [29], and thus T m increases.
Figure 5 shows the TSDC spectra of the samples polarized at room temperature in a wider temperature range (from 240 to 300 K), where an additional peak at higher temperatures is observed in the 260 to 300 K range only in the composites with Cloisite®15A and 30B. This peak can be ascribed to a new relaxation mode recently reported in the literature that has been named new mode, caused by a restricted segmental dynamics of rubber chains localized in the rubber/clay interfacial region [6]. The absence of the so called new mode in the composite with OMMT has been already reported by Hernandez et al. [6] in broadband dielectric spectroscopy. Varghese and Karger-Kocsis [26] and Teh et al. [23] also report an additional peak in tan δ vs. temperature curves. They attributed the additional peaks at higher temperatures than that of T g to rubber located between clay layers in an intercalated (partially exfoliated) and/or confined (re aggregated) system. There the rubber behaves differently from that of the bulk, being under constraints. Therefore, this rubber portion has a higher T g than that of the bulk.
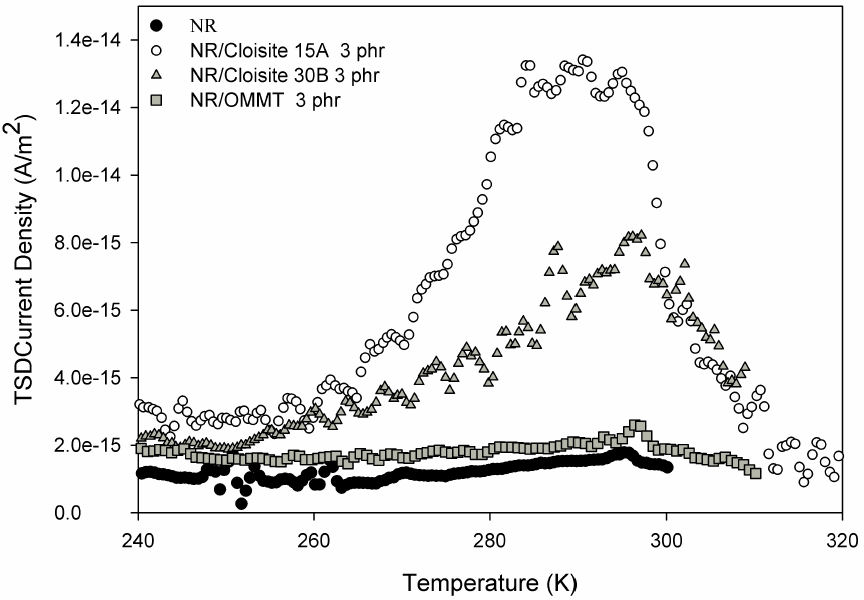
FIGURE 5 TSDC spectra at room temperature (T p = 297 K) of natural rubber and its composites with Cloisite®15A, Cloisite®30B, and organically modified montmorillonite OMMT. Relaxations above glass transition temperature of the rubber are shown in this spectra.
Figure 6 shows the TSDC spectra of rubber nanocomposites containing different concentrations of Cloisite®15A and carbon black. The segmental relaxation peak near T g of rubber is slightly shifted towards higher temperatures as the clay concentration increases, in agreement with the results reported by Fragiadakis et al. [1]. The temperature at the intensity maximum T m of the composite with 5 phr of the clay is located at 220.8 K, which is a higher temperature than those of the peak maxima for the unfilled natural rubber and the composite with only 3 phr of the clay (cf. Table III).
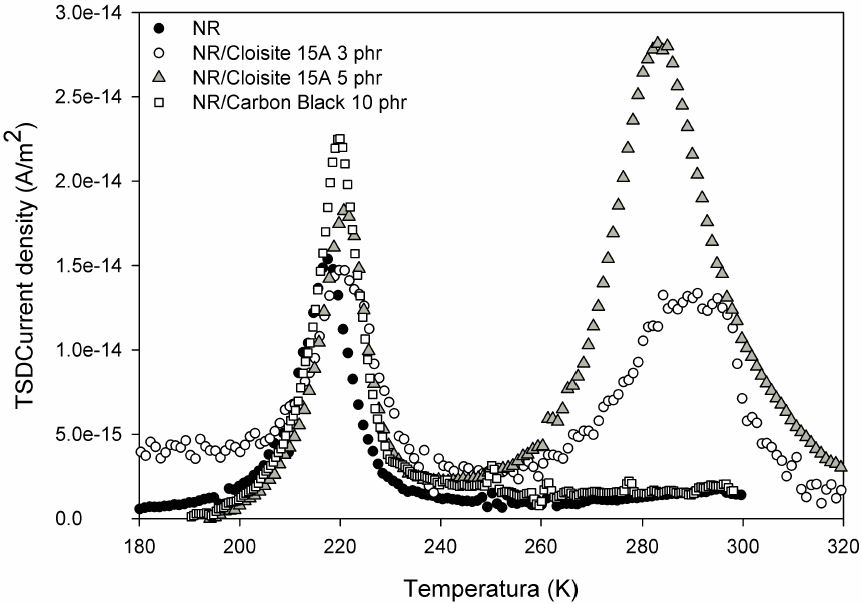
FIGURE 6 TSDC spectra at room temperature (T p = 297 K) of natural rubber and its composites with Cloisite®15A at different clay concentrations and natural rubber/carbon black.
Furthermore, the intensity of this peak increases with clay concentration. Additionally, the dielectric signal of the new mode shows a strong dependence on clay content present in the rubber matrix, as can be observed. These results indicate that the higher peak intensity of the new mode corresponds to the higher content of Cloisite®15A, in agreement with what was reported by Hernandez et al. Since the composites prepared with natural rubber and Cloisite®15A displayed a higher degree of exfoliation and higher rubber/clay compatibility, as suggested by TEM analysis and TSDC characterization, they were chosen to compare their dielectric behavior with that of a conventional natural rubber formulation containing 10 phr of carbon black. From its TSDC spectrum (Fig. 6), the strongest segmental peak is observed around the rubber glass transition temperature, which indicates a higher amount of reorientable dipolar entities. On the other hand, the new mode is not present in the compound with carbon black, as can be seen in its TSDC spectrum. The relationship of this new mode with the mechanical properties of the rubber is still under study and has not been reported yet. Vu et al. [30] reported that the factor governing tan δ is the state of filler networking, and, in general, the stronger the filler network, the lower the value of tan δ. From DMTA analysis, they found that above the glass transition temperature of the elastomer, the tan δ value obtained using carbon black is higher than that using silica due to weaker filler-filler interactions and stronger polymer-filler interactions in the former.
3.3. TSDC Results: space charge relaxations
Next, results from dielectric relaxation measurements in natural rubber reinforced with nano clays and carbon black, polarized at much higher temperatures than that of the glass transition temperature of natural rubber (T p >> T g ), where space-charge processes [10,11] are activated, will be presented. To our knowledge, such measurements in rubber and its composites, using TSDC or dielectric spectroscopy, have not been reported in the literature yet. To confirm that the high temperature TSDC spectra correspond to the space charge relaxation, two experiments were performed. First, dielectric relaxation was measured by polarizing at 373 K, V p = 1400 V, and t p = 30 s in the natural rubber sample (NR) with blocking electrodes using sapphires and without them (sandwich configuration of electrode-sapphire-samplesapphire-electrode and electrode-sample-electrode, respectively). TSDC spectra were normalized to the applied voltage, and sample’s thickness and area. Figure A shows these results where it can be seen that both the shape and the position of the maximum of the peaks change when the electrodes are blocked. It is known that the use of different types of electrodes can give information about the nature of the dielectric relaxation peak [31] and cites therein. Thus, the conductor-dielectric junction produces variations that affect the profile of the space charge TSDC peaks, unlike the dipole relaxation peaks that are not affected by these variations. From Fig. B, we can affirm that the high temperature TSDC peaks (above room temperature) correspond to the relaxation of space charge. To also confirm that the TSDC peaks that appear below room temperature correspond to dipole relaxations, TSDC spectra were obtained with blocking electrodes and without them in the natural rubber sample, with identical polarization conditions than the previous experiment. The non-variation of the shape and position of the maximum intensity of the TSDC peaks, as can be seen in Fig. B, verify that it corresponds to dipole relaxations [32].
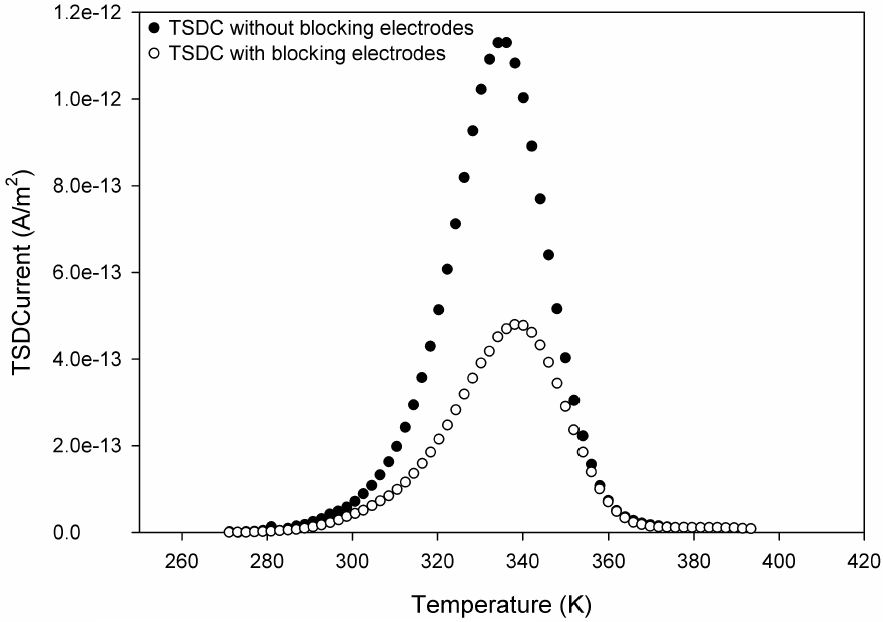
FIGURE A High Temperature TSDC spectra of Natural Rubber (T p = 373 K, t p = 30 s) with blocking electrodes and without them.
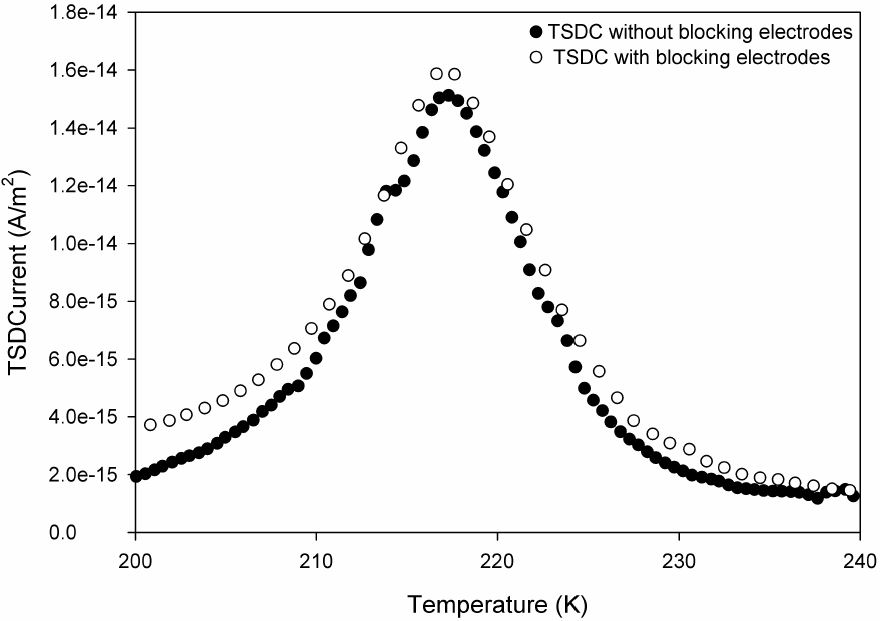
FIGURE B TSDC spectra at room temperature of Natural Rubber (T p =297 K, t p =30 s) with blocking electrodes and without them.
Once the nature of the high-temperature TSDC peaks was verified, the space charge relaxation peaks were obtained from the rest of the nanocomposites. High-temperature TSDC spectra were obtained polarizing all rubber samples at 373 K, at 50 V, for 30 s, without blocking electrodes, to simplify the analysis of the results. TSDC spectra were normalized to the applied voltage, and sample’s thickness and area. The results are shown in Fig. 7. This figure shows the hightemperature TSDC spectra of natural rubber and its composites with 3 phr of the different clays, and also of that with 10 phr of carbon black. The relaxation peaks are produced by the flow of charge carriers or spatial charge present in the polymer matrix. In those curves, a peak shifting towards higher temperatures can be seen in samples with filler. Characteristic parameters of TSDC curves, such as current intensity maximum (I m ), the temperature at the intensity maximum (T m ), and peak area (Q rel ), related to the liberated charge, were determined for these discharges and reported in Table IV.
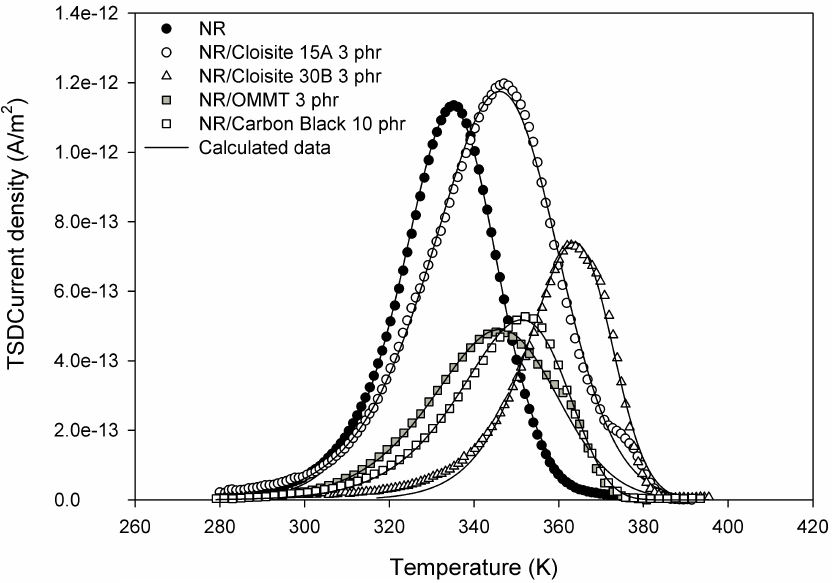
FIGURE 7 High Temperature TSDC spectra and numerical fitting (T p = 373K, t p = 30 s) of natural rubber and its composites.
TABLE IV Characteristic parameter of experimental TSDC curves of unfilled and filled rubber sample.
| Sample | (I m ±0.01) pA | (T m ±0.1) K | (Q rel ±0.01) nC |
| Natural Rubber (NR) | 6.84 | 335.1 | 1.96 |
| NR/Cloisite®15A 3 phr | 4.98 | 347.1 | 1.88 |
| NR/Cloisite®30B 3 phr | 3.09 | 362.3 | 0.82 |
| NR/OMMT 3 phr | 3.09 | 345.6 | 1.19 |
| NR/Carbon Black 10 phr | 3.23 | 352.3 | 1.04 |
The curves were fitted using a kinetic model of general order, except that of the natural rubber/carbon black composite, which was fitted to a first-order kinetic model (cf. Eqs. (1) and (2)). In this sense, in those samples with clay as a filler and in that without filler, combined space-charge relaxation processes occur, that is, charge recombination and retrapping [17,18]. The sample with carbon black displayed mainly a charge-recombination relaxation process. Some examples of curves fitted to experimental data are shown in Fig. 7. A good agreement between the experimental results and the fitted curves was obtained. This agreement allows inferring that the origin of TSDC peaks is the space charge relaxation, located at energy sub-levels or traps, present in the band structure of the solid, which is thermally activated, and from where charge carriers hop to the conduction band. A small peak on the slope of the high-temperature dielectric signal can also be observed from the TSDC peaks for the Cloisite reinforced samples. TSDC was performed with blocking electrodes and without them for the NR/Cloisite15A 3 phr sample, with identical experimental conditions from the previous experiment using blocking electrodes, and from the results obtained (cf. Fig. C) it can be seen that this peak appears when there are no blocking electrodes. This allows us to assume that this small dielectric signal is due to the charge injected from the electrodes.
The fitting parameters, such as the charge initially stored in the traps n 0 (calculated using the adjustment parameter σ n0 and data area, thickness, and voltage applied to the sample), frequency factor s 0, activation energy, (E a , which is the average depth of the traps), and the kinetic order (b) are displayed in Table V for analysis. The TSDC peak areas Q rel were plotted against the initial stored charge in the traps n 0 for each sample, as seen in Fig. 8. The linear fitting is very good because the correlation coefficient is R 2 = 0.9999.
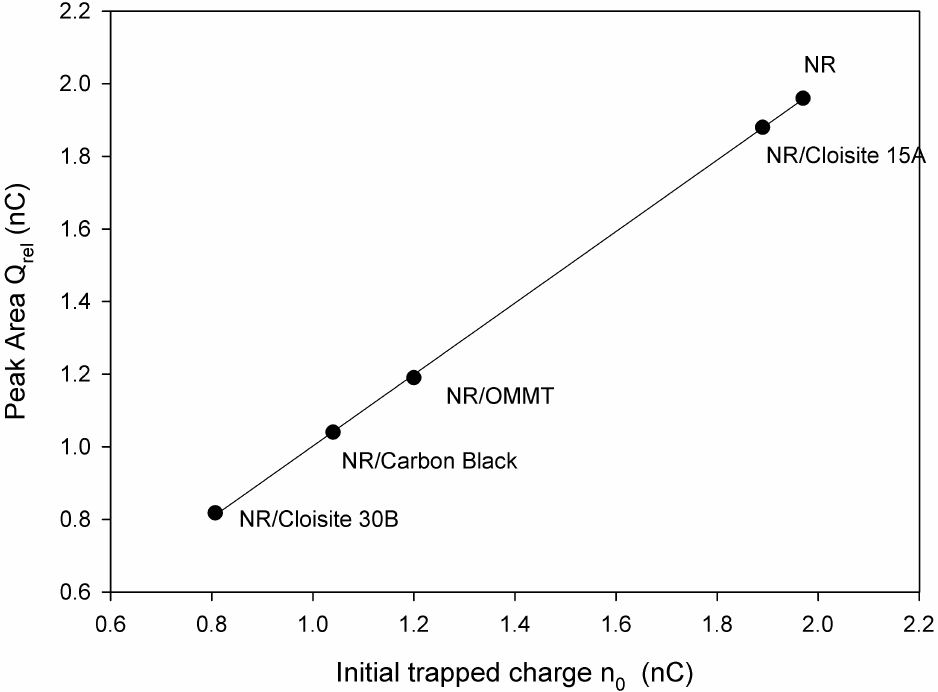
FIGURE 8 TSDC Peak area versus initial trapped charge with linear fitting and correlation coefficient R 2 = 0.9999
The concentration of the charge stored in the traps is the same as that of the liberated charge that goes to the conduction band of the polymer. Tables IV and V show that the unfilled sample traps more space charge and also liberates more charge to the conduction band. The accelerators, activators, and stabilizers added to the rubber, and natural impurities present in the raw elastomeric material are the most probable origin of these charge carriers. Additionally, charge injection from the electrodes contributes to space charge into the system.
TABLE V Fitting parameters of TSDC curves (space charge) of unfilled and filled rubber sample.
| Sample | n 0 nC | (s 0x1011) Hz | E a eV | b |
| Natural Rubber (NR) | 1.97 | 1290 | 1.07 | 1.5 |
| NR/Cloisite®15A 3 phr | 1.89 | 0.0134 | 0.774 | 1.4 |
| NR/Cloisite®30B 3 phr | 0.807 | 25,700 | 1.26 | 1.2 |
| NR/OMMT 3 phr | 1.20 | 0.0249 | 0.789 | 1.3 |
| NR/Carbon Black 10 phr | 1.04 | 0.0530 | 0.820 | 1 |
From TEM results, as previously mentioned, a higher compatibilization degree was found for Cloisite®15A in NR. This fact is related to the amount of liberated charge in the dielectric relaxation of this nanocomposite (Cf. Fig. 8). At better dispersion, higher liberated charge Q rel , because there are fewer obstacles for electric conduction of space charge and a higher amount of charge carriers can percolate. Hence, the NR/Cloisite®30B sample has a lower Q rel , which is in agreement with the lower degree of dispersion in NR, as seen in micrographs (Cf. Fig. 2). Space charge percolates less when tactoids are present, which is in agreement with the fact that NR/Cloisite®30B sample has the lowest TSDC peak area.
The sample of rubber with carbon black has a lower percolating degree because the filler’s particle size is two orders of magnitude larger than that of the clays. Then, even though the reinforcing filler could be better dispersed, it has efficient sections that hinder the percolation of charge carriers, which is reflected in the fact that its TSDC peak area lies among the smaller of all. It is noteworthy that all reinforcing fillers act as obstacles in the path of charge carriers.
In Fig. 9 the current maxima I m , extracted directly from experimental data, is plotted against temperatures at which each appears, T m . As seen there, all filled composites display lower I m values than that of unfilled natural rubber, though all composites peaks are shifted towards higher T m . This result indicates that reinforcing fillers reduce the mobility of charge carriers, and the evidence is a lower current intensity in all nanocomposites when compared to the unfilled NR sample.
Figure 10 displays a plot of the activation energy, obtained from the fittings, versus peak temperature of the samples, E a vs T m . The presence of reinforcing fillers modifies the rubber’s energy profile, because the activation energy, corresponding to the traps ’average depth, decreases in general when compared to that of the unfilled rubber. This decrease in E a could be associated with the appearance of energy sub-levels between the existing levels when NR has no fillers and the conduction band, which indicates strong interactions between the reinforcement and the polymer [14]. An exception to this behavior is the NR/Cloisite®30B sample, which has the lowest degree of filler dispersion or compatibility, according to TEM results. Furthermore, the NR/Cloisite®15A sample displays the lowest E a value and has the finest dispersion, according to TEM images.
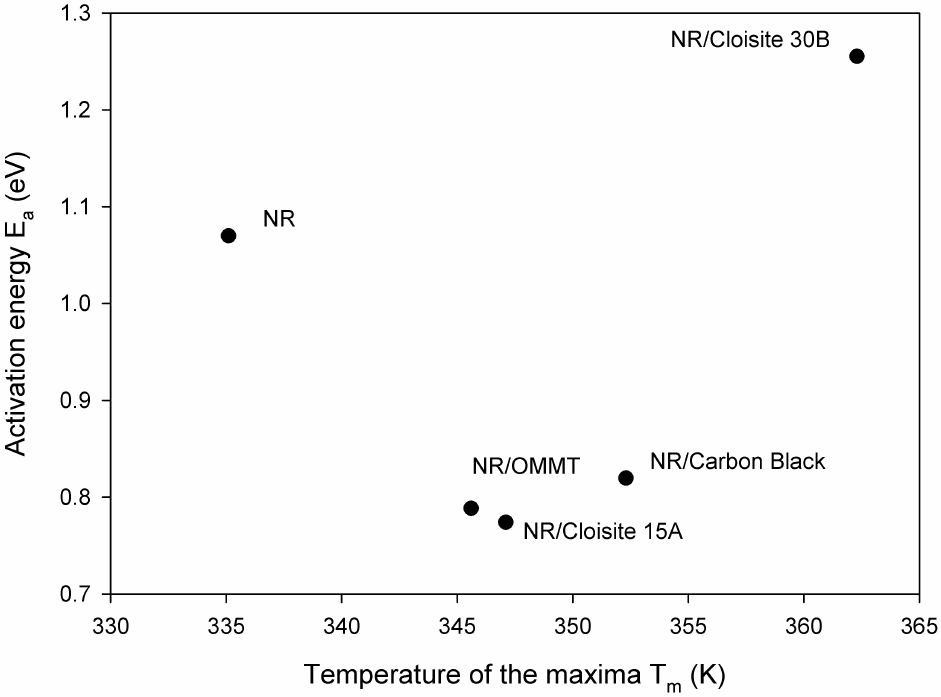
FIGURE 10 Plot of activation energy against peak temperature. Samples with good clay dispersion (without tactoids) display lower activation energy.
Thus, an alternative way of ascertaining whether the reinforcement is homogeneously dispersed in the rubber matrix can be through the measurement of the sample’s activation energy, which should be lower than the unfilled sample. Then, a complementary path to determine the degree of dispersion of the clay in NR is offered, that is, using TSDC as an experimental technique besides TEM. Hence, if E a < E a,NR , the latter being the activation energy of the unfilled rubber matrix, then the reinforcement will be well dispersed in the polymer. This plot also indicates that the shifting of the peak temperatures toward higher values is not a consequence of activation energy increases, as usual in dipolar relaxations, because in the NR/OMMT composite the E a value is higher than that of NR/Cloisite®15A and T m is higher in the latter. In the end, the reinforcement with carbon black reveals an important fact which makes a big difference from the tactoids of Cloisite®30B: even though particles of carbon black are larger than 100 nm, they are better dispersed and distributed into the rubber matrix. Furthermore, there are important interactions between carbon black particles and NR (known as “bound rubber ”). The finest dispersed filler (NR/Cloisite®15A) displays the lowest activation energy of all samples with clay.
The plot of I m vs E a is presented in Fig. 11. NR shows the maximum current value for an activation energy located in an intermediate point between the values corresponding to the better (NR/Cloisite®15A) and the worst (NR/Cloisite®30B) dispersed composites. This could suggest, qualitatively, a distribution of current in activation energy values, and is it an indicator of the conductive property of the solid in the bulk, as already seen in the presence of fillers: the charge carrier flow decreases and the interaction between the polymer matrix and reinforcement increases in the lower activation energies direction, being more towards the left the more compatible formulation, NR/Cloisite®15A. Finally, the preexponential factor s 0 is obtained from the fittings (cf. Table V), and the values lie in a wide range of orders of magnitude (109 a 1015 Hz). Some of them are in agreement with those typical from the classic Debye theory. If the logarithm of the inverse of the pre-exponential factor, τ 0, varies linearly with the activation energy E a , then a compensation law is observed [17] given by τ 0 = τ c exp(−E a /kT c ) where T c and τ c are the compensation temperature and time, respectively. Figure 12 displays the ln(τ 0) vs E a plot, where the curve’s linearity indicates a compensation law. The linear relation is closer in samples with well-dispersed fillers, suggesting that the dielectric relaxations observed in these samples have the same molecular mechanism [17]. Fitting parameters were calculated by linear fitting of the data through the method of least squares, and the compensation temperature T c and time τ c were obtained, with correlation coefficient R 2 = 0.9751. Their values are T c = 368 K and τ c = 22.8 s, which seems to stand out the importance of molecular dynamics of space charge relaxation in polymers [17].
4. Conclusions
The effects of the presence of the Cloisite®15A, Cloisite®30B, organically modified montmorillonite, and carbon black on the molecular dynamics of natural rubber were studied using TEM and TSDC. The morphological results revealed that NR/ Cloisite®15A compound is the sample with a higher degree of exfoliation, which suggests stronger compatibility between the organic and inorganic phases. Displacement of TSDC peaks around T g towards higher temperatures supports this compatibility between the phases. TSDC spectra of NR/Cloisite®15A or 30B display an additional relaxation peak, a new mode, which is not associated with normal modes in the rubber because of its vulcanization, in agreement with reported investigations carried out using Broadband Dielectric Spectroscopy (BDS). This peak is more intense as the exfoliated fraction of the clay in the rubber matrix is higher, as shown by the TSDC spectra, where this new mode is more intense in the sample containing Cloisite®15A. Furthermore, clay concentration determines the intensity of this relaxation peak; that is, the intensity increases with the amount of clay. A significant finding in this work is that, since E a is related to dispersion, and dispersion affects all the mechanical properties, it could be used as a parameter to predict, qualitatively, the mechanical behavior of the samples. Thus, if E a < E aNR , the latter being the activation energy of the unfilled rubber matrix, then the reinforcement will be well dispersed in the polymer. This fact could be used as a predictor of the clay’s reinforcement ability during mechanical testing. On the other hand, TSDC peak area Q rel in rubber/clay composites increases with clay dispersion, because there are more charge-carrier percolation paths. In this sense, to examine the Q rel values in this type of formulations can be considered a good complement to TEM characterization. However, in carbon black filled rubber, the Q rel value is low though good dispersion is known to be attained, probably due to its particle size, which can be up to two orders of magnitude larger than that of clays. Finally, the dielectric relaxations of the rubber/clay composites obey a compensation law very closely, indicating that relaxation molecular mechanisms are similar in those samples.


 nueva página del texto (beta)


