1. Introduction
In recent years a very important technological interest in semiconductor alloys has been reserved in the literature for applications in the fields of optical devices [1,2]. Several authors have studied a wide range of materials to search for the desired parameters [3-6]. Thus, some kinds of semiconductors have been investigated theoretically, especially for the development and applications of mismatched alloys based on II-VI and III-V compounds. Due to the importance of the physical properties of such materials, works were motivated in III-V and II-VI [7-9] alloys for the development of new devices operating in the wide spectrum range. Particularly few authors indicate the wavelength region 1-2 µm [10-14] for optoelectronic devices in optical communication applications. Theoretically, different methods have been used for the calculation of the properties of semiconductor alloys. The full potential linear augmented plane wave method (FPLAPW) within the density functional theory (DFT) has been used to compute the structural, electronic, and optical properties of several III-V and II-VI alloys. Thus, this method has recently been used for both ternary and quaternary alloys based on II-VI [15-17] and III-V [18,19] compounds. However, a major condition of materials for optoelectronic applications is the ability to adjust easily the band-gap to obtain the desired optical properties in order to ensure its matching with a given substrate. The quaternary (II-VI) alloys meet these requirements. Very recently, the structural and optoelectronic properties of Zn1− x Cd x Se y Te 1−y quaternary alloys [20] have been investigated using the density functional theory (DFT) based full-potential linearized augmented plane wave (LAPW) approach. Thus, the structural properties have been computed using the Perdew-BurkeErnzerhof (PBE) generalized gradient approximation (GGA) scheme, while the optoelectronic properties have been calculated using both the modified Becke-Johnson (mBJ) and Engel-Vosko (EV-GGA) schemes. Hence the important interest in calculating the structural, electronic, and optical properties of Zn1− x Cd x Se y Te 1−y quaternary alloy using the (FP-LAPW) method within density functional theory (DFT) in order to collect much information, complete the previous works, and improve the knowledge of the field. In the rest of this article, we present the sections as follows: the computational method used in this paper will be described in Sec. 2 and our results will be reported and discussed in Sec. 3. Finally, as conclusions, a summary of the present work will be given in Sec. 4.
2. Computational method
In our work, we have computed the structural, electronic, and optical properties of Zn 1−x Cd x Se y Te 1−y quaternary alloys, using the Full Potential Linearized Augmented Plane Wave (FP-LAPW) method [21] within the framework of the Density Functional Theory (DFT) as implemented in the WIEN2K code [22]. The FP-LAPW method principle is based on dividing the space into non-overlapping muffin-tin (MT) spheres around the atomic sites and an interstitial region (IR). Inside the MT spheres, the charge density and potential are expanded by spherical harmonic functions. In addition, in the IR region, the basis set consists of plane waves. For structural parameters, the exchange-correlation potential was performed using the Perdew-Burke-Ernzerhof Generalized Gradient Approximation (GGA-PBEsol) [23]. On the other hand, the Tran-Blaha modified Becke-Johnson (TBmBJ) [24] in adding to the Local Density Approximation (LDA) [21] approaches have been used to calculate the electronic and optical properties of Zn 1−x Cd x Se y Te 1−y quaternary alloys lattice-matched to ZnTe.
The quaternary alloy computed in this work is made of four binary compounds ZnSe, ZnTe, CdSe, CdTe. For these binary alloys, the normal structure, zinc blende (ZB), is adopted. However, in our simulation, the plane wave cut-off was used with the condition R MT .K max = 8, where R MT is the smallest muffin-tin sphere radius and K max is the plane wave cut-off. We have chosen the muffin-tin radius (MT) as R MT (Zn)= 2.2, R MT (Cd)= 2.4, R MT (Se)= 2.3 and R MT (Te)= 2.6 atomic units (a.u). The Fourier expanded charge density was truncated at G max = 12(Ryd) 1/2 . For the wave function expansion inside the atomic spheres the maximum l value was confined to l max = 10. To dissociate core from valence states, the cut-off energy is set to −6Ryd. The self-consistent calculations are considered to be converged when the total energy of the system is stable within 0.0001 Ryd. A 2×2×2 supercell with 64 atoms was used in order to compute the Zn 1−x Cd x Se y Te 1−y quaternary alloys. The obtained simple cubic supercell to simulate the Zn 1−x Cd x Se y Te 1−y quaternary alloys is made by 32 atoms of valency II (Zn,Cd) and 32 atoms of valency VI (Se,Te). A mesh of 50 special k-points was taken in the irreducible wedge of the Brillouin zone to calculate the structural and electronic properties. On the other hand the optical properties calculations were performed using 500 k-points. For the Zn 1−x Cd x Se y Te 1−y alloy, the epitaxial layers can be deposited on substrates by the Metal-Organic Chemical Vapor Deposition method (MOCVD) [2]. Further, the Molecular Beam Epitaxy (MBE) method [2,25] can be used for lattice matching the epitaxial layer to the substrate. The electronic configurations Zn(3d104s2), Cd(4d105s2), Se(3d104s24p4), Te(4d105s25p4) were chosen as valence states. The crystal structure of Zn 0.500 Cd 0.500 Se 0.437 Te 0.563 quaternary alloy is shown in Fig. 1.
3. Results and discussions
3.1. Structural properties
Very interesting applications in semiconductor devices with desired band gaps were mentioned in the literature [26,27] on quaternary (II-VI) alloys having the general chemical formulas (A 1−x B x C y D 1−y ) where AC, AD, BC, BD are the binary compounds and (x,y) are the concentrations. The aim of the present work is related to predicting the structural, electronic, and optical properties of Zn 1−x Cd x Se y Te 1−y alloys with a number of Cd concentrations x (0.125 ≤ x ≤ 0.875).
For the structural properties, the lattice parameter and bulk modulus were computed using the GGA-PBEsol approximation. In addition to the LDA approach, the recent (TB-mBJ) approach has been used to calculate the electronic and optical properties. The quaternary alloy Zn 1−x Cd x Se y Te 1−y is bounded by four binary compounds ZnSe, ZnTe, CdSe, and CdTe. The normal structure of this binary is zinc-blende. Among 64 atom simple cubic structures, the ones that minimize the total energy with respect to the cell parameters and the atomic positions were searched. The simulated parameters have been computed as a function of cationic and anionic compositions (x,y), where x and y are the concentrations of Cd and Se elements, respectively. First, the structural properties of the binaries (ZnSe, ZnTe, CdSe, and CdTe) and the Zn 1−x Cd x Se y Te 1−y quaternary alloys were computed by the GGA-PBEsol approximation. In order to compute the equilibrium lattice constants (a) and bulk modulus (B) for the Zn 1−x Cd x Se y Te 1−y quaternary alloy, the total energy versus volume data have been calculated by fitting the total energy versus volume data into the Murnaghan’s equation of states (EOS) [28]. The lattice constant of the quaternary A x B 1−x C y D 1−y alloy is a function of the compositions (x,y) and can be approximated by the Vegard’s law [2] given by the following relation:
where α AC, α AD, α BC, and α BD correspond to the lattice constants for pure binaries AC, AD, BC, and BD, respectively.
By using Eq. (1), the lattice constant for the Zn 1−x Cd x Se y Te 1−y quaternary alloy can be deduced according to the following expression:
where the binaries AC, AD, BC, and BD are CdSe, CdTe, ZnSe, and ZnTe, respectively. The lattice-matching conditions are respected by putting α(Zn 1−x Cd x Se y Te 1−y ) equal to α ZnTe . Thus, using the respective experimental lattice constants of the binary compounds (α CdSe = 6.050 Å), (α CdTe = 6.481 Å), (α ZnSe = 5.669 Å) and (α ZnTe = 6.1037 Å), the corresponding concentrations for lattice matched of Zn 1−x Cd x Se y Te 1−y quaternary alloy can be obtained by the relation (3) below with different concentrations x(0.125 ≤ x ≤ 0.875).
We have adopted Zn 1−x Cd x Se y Te 1−y alloy latticematched to ZnTe with some selected concentrations (4/32 ≤ x ≤ 24/32). We have considered different concentrations along the line of lattice matching to ZnTe by assigning to the pair (x,y), the respective compositions (4/32;3/32), (8/32;7/32), (12/32;10/32), (16/32;14/32), (20/32;17/32), (24/32;21/32) and (28/32;24/32). Using the GGA-PBEsol method, the lattice constant and bulk modulus of the binaries (CdSe, CdTe, ZnSe, ZnTe), and the quaternary alloy Zn 1−x Cd x Se y Te 1−y were calculated for various Cd concentration (x) and exhibited in Table I.
TABLE I Calculated lattice constant a(Å) and bulk modulus B(GPa) of Zn1−x Cdx Sey Te1−y quaternary and their binaries by GGA-PBEsol method with experimental data and other theoretical calculations.
| Compound | This work | Other works | Experiment | |||
| a(Å) | B(GPa) | a(Å) | B(GPa) | a(Å) | B(GPa) | |
| ZnSe | 5.647 | 65.32 | 5.650α | 66.11α | 5.669b | 64.7α |
| CdSe | 6.087 | 52.85 | 6.092α | 52.76α | 6.050b | 53.0α |
| ZnTe | 6.067 | 51.46 | 6.099c | 51.59c | 6.103b | 50.9c |
| CdTe | 6.495 | 45.71 | 6.420d | 46.6d | 6.481b | 44.5e |
| Zn0.875 Cd0.125 Se0.093 Te0.907 | 6.052 | 62.57 | - | - | - | - |
| Zn0.750 Cd0.250 Se0.218 Te0.782 | 6.064 | 62.07 | - | - | - | - |
| Zn0.625 Cd0.375 Se0.312 Te0.688 | 6.079 | 61.89 | - | - | - | - |
| Zn0.500 Cd0.500 Se0.437 Te0.563 | 6.083 | 61.35 | - | - | - | - |
| Zn0.375 Cd0.625 Se0.531 Te0.469 | 6.094 | 61.02 | - | - | - | - |
| Zn0.250 Cd0.750 Se0.656 Te0.344 | 6.103 | 61.60 | - | - | - | - |
| Zn0.125 Cd0.875 Se0.750 Te0.250 | 6.111 | 61.91 | - | - | - | - |
To the best of our knowledge, there is no theoretical simulation based on the FP-LAPW method, and no experimental values of the structural properties of Zn 1−x Cd x Se y Te 1−y alloy for these concentrations have been presented up to now. Hence our calculations can be used to cover the lack of data for the studied alloy. It is seen from Table I that the calculated lattice constants of Zn 1−x Cd x Se y Te 1−y are also in good agreement with the experimental value of the ZnTe lattice constant. The variation of lattice parameter versus Cd concentration is found to be almost constant (around 6.084 Å). Figure 2 shows the calculated lattice constant as a function of the Cd concentration x (0.125 ≤ x ≤ 0.875). A marginal deviation of the lattice constant from Vegard’s law can be observed. From Fig. 2, we can notice that at given Se concentration, the lattice constant increases almost linearly with increasing Cd concentration. The optimized variation of the lattice constants α(x) was fitted by the quadratic function to calculate the total bowing parameter (b). Thus, we have obtained the following relation:
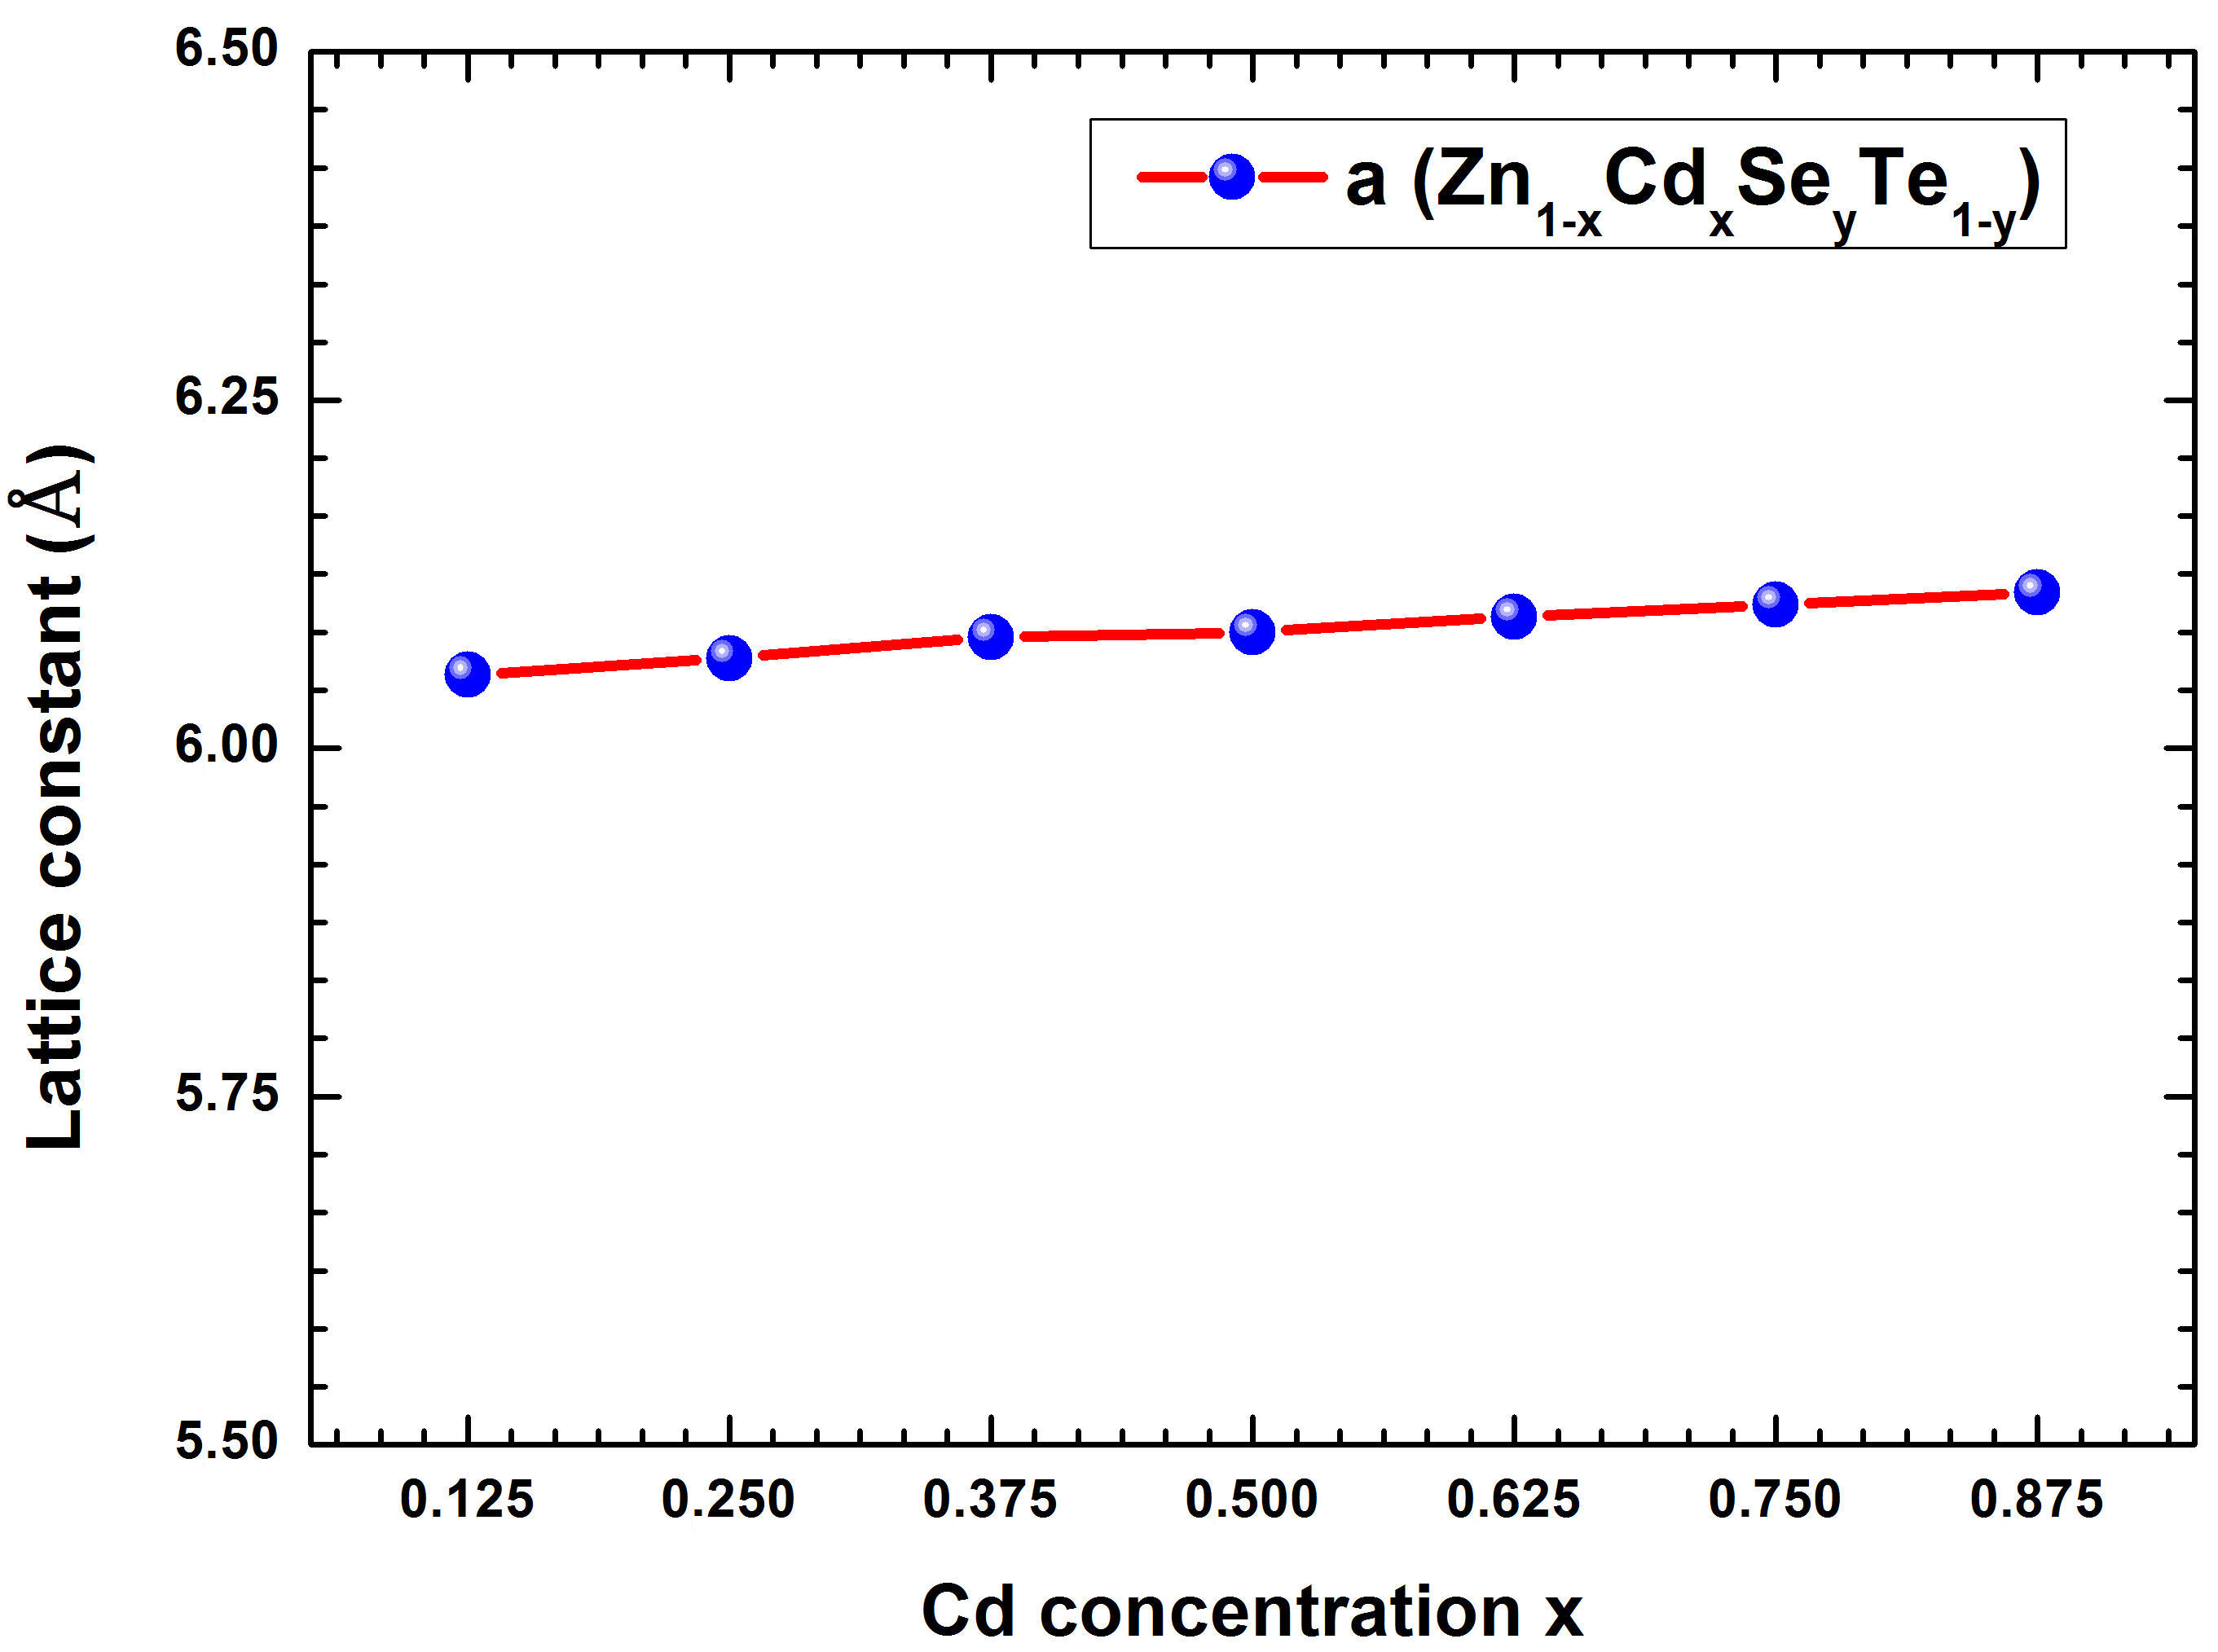
FIGURE 2 Calculated lattice constant as a function of the Cd concentration x in the Zn 1−x Cd x Se y Te 1−y quaternary alloys matched to ZnTe with GGA-PBEsol method.
By referring to relation (4), we can observe a negligible bowing parameter (b = −0.0272 eV) corresponding to the quadratic term of the above equation. The contour lines of the lattice constants for Zn 1−x Cd x Se y Te 1−y alloy as a function of Cd and Se compositions were simulated with the GGAPBEsol approach and exhibited in Fig. 3. From this figure, it is observed that the lattice parameter of the quaternary alloy increases with increasing Cd concentration. The variation of the bulk modulus (B) versus Cd concentration (x) for the quaternary alloy Zn 1−x Cd x Se y Te 1−y is reported in Table I and is shown in Fig. 4. It is seen to be almost constant. This result is in agreement with the well-known relationship between B and the lattice constant (B α /V 0) [31], where V 0 is the unit cell volume.
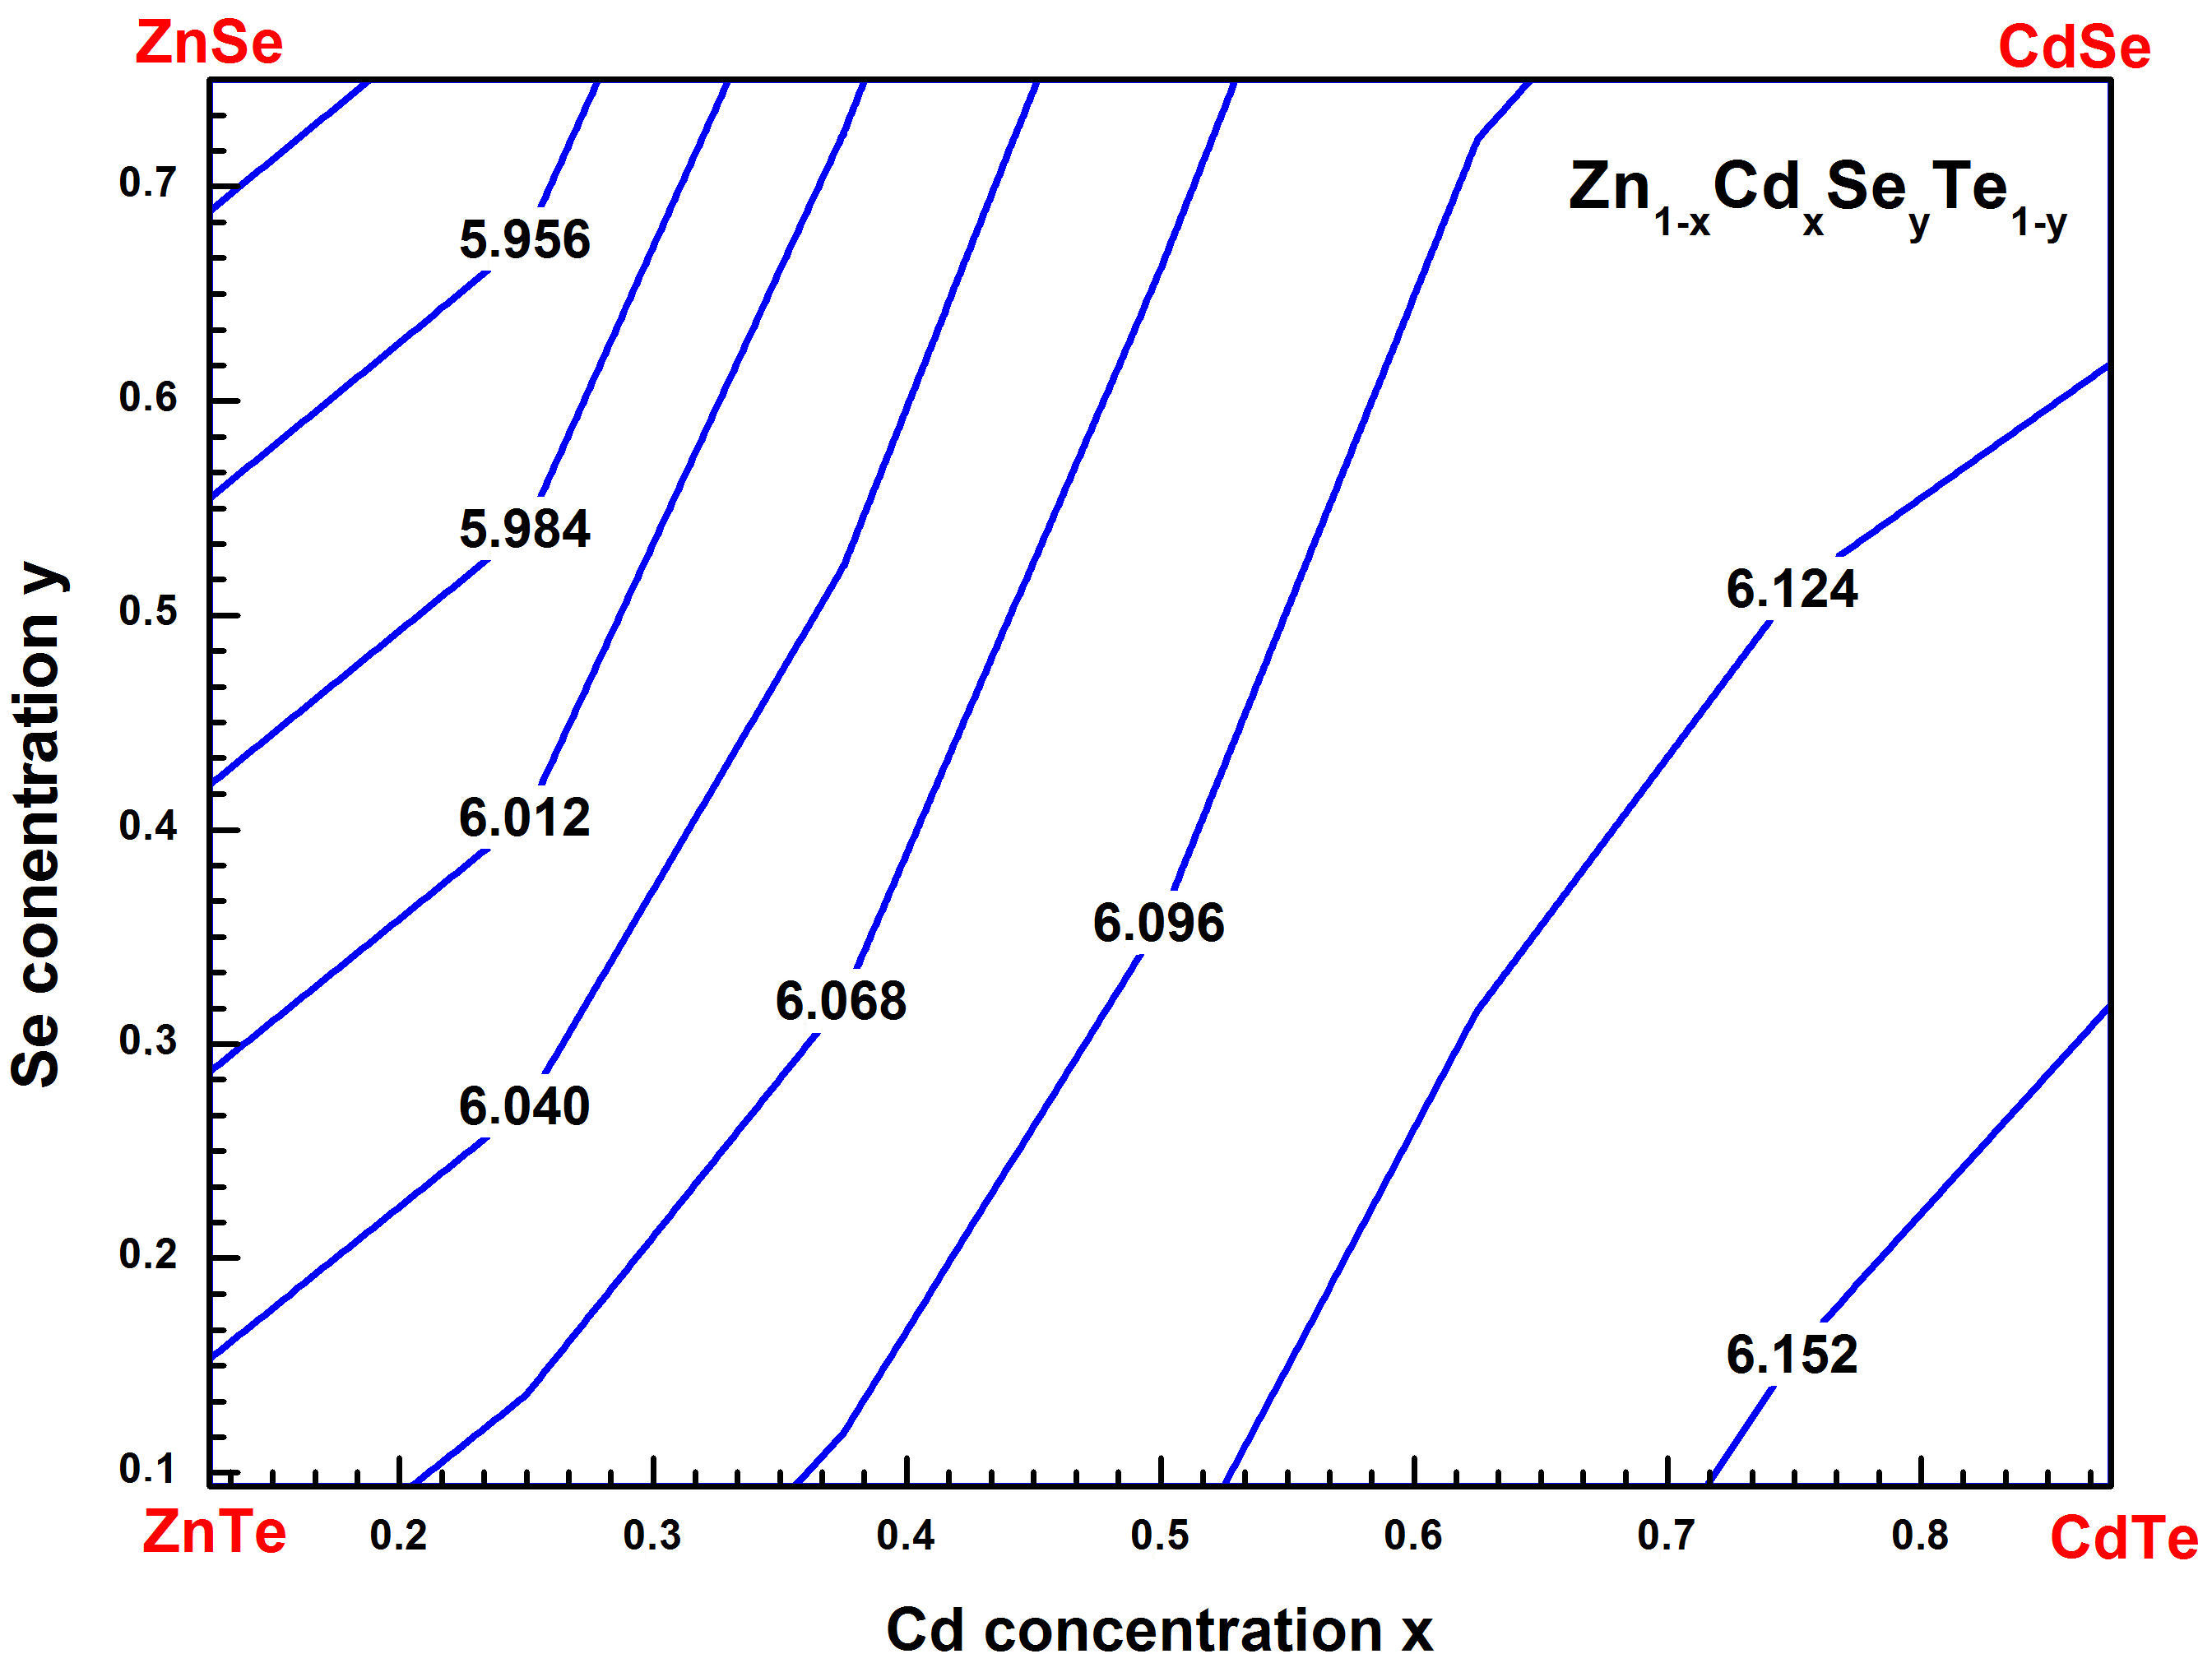
FIGURE 3 Contour lines of predicted lattice constant for Zn 1−x Cd x Se y Te 1−y quaternary alloys matched to ZnTe with GGA-PBEsol method.
3.2. Electronic properties
This part is devoted to calculations of electronic band structure for Zn 1−x Cd x Se y Te 1−y quaternary alloy without relaxation using the local density approximation (LDA) [32] and the Tran-Blaha modified Becker-Johnson (TB-mBJ) [24] approaches. This simulation was performed along the high symmetry lines of the first Brillouin zone, where the maximum of the valence band was fixed as the energy level reference. Table II exhibits the calculated energy band gaps (Eg) for the Zn 1−x Cd x Se y Te 1−y quaternary alloy using LDA and TB-mBJ schemes for various Cd concentration x (0.125 ≤ x ≤ 0.875). To the best of our knowledge, there are no earlier studies of the bandgap for Zn 1−x Cd x Se y Te 1−y alloys with these concentrations; hence our calculations can be used to cover the lack of data for the studied alloys. Figure 5 shows the variation of bandgap energies Eg versus the concentration x for Zn 1−x Cd x Se y Te 1−y lattice-matched to ZnTe, calculated via two schemes (LDA and TB-mBJ). We remark that the variation of the bandgap energies is almost linear with a slight decrease of the curves with increasing Cd concentration (was performed to determine the dependence of the energy(x). A fitting operation to curves presented in Fig. 5 was performed to determine the dependence of the energy band gaps (Eg) versus the composition of the cadmium (x) for the Zn1-xCdxSeyTe1-y lattice matched to ZnTe. Hence, we have obtained the following relations:
TABLE II Calculated lattice constant a(Å) and bulk modulus B(GPa) of Zn1−x Cdx Sey Te1−y quaternary and their binaries by GGA-PBEsol method with experimental data and other theoretical calculations.
| Compound | This work | Other works | Experiment | ||
| LDA | TB-mBJ | LDA | TB-mBJ | ||
| ZnSe | 1.102 | 2.443 | 1.060α | 2.761α | 2.721d |
| CdSe | 0.397 | 1.849 | 0.316α | 1.935α | 1.675d |
| ZnTe | 0.941 | 2.21 | 1.101b | 1.83b | 2.27d |
| CdTe | 0.286 | 1.56 | 0.623c | - | 1.51d |
| Zn0.875 Cd0.125 Se0.093 Te0.907 | 0.997 | 2.365 | - | - | - |
| Zn0.750 Cd0.250 Se0.218 Te0.782 | 0.925 | 2.304 | - | - | - |
| Zn0.625 Cd0.375 Se0.312 Te0.688 | 0.879 | 2.257 | - | - | - |
| Zn0.500 Cd0.500 Se0.437 Te0.563 | 0.751 | 2.158 | - | - | - |
| Zn0.375 Cd0.625 Se0.531 Te0.469 | 0.577 | 2.083 | - | - | - |
| Zn0.250 Cd0.750 Se0.656 Te0.344 | 0.496 | 1.967 | - | - | - |
| Zn0.125 Cd0.875 Se0.750 Te0.250 | 0.433 | 1.854 | - | - | - |
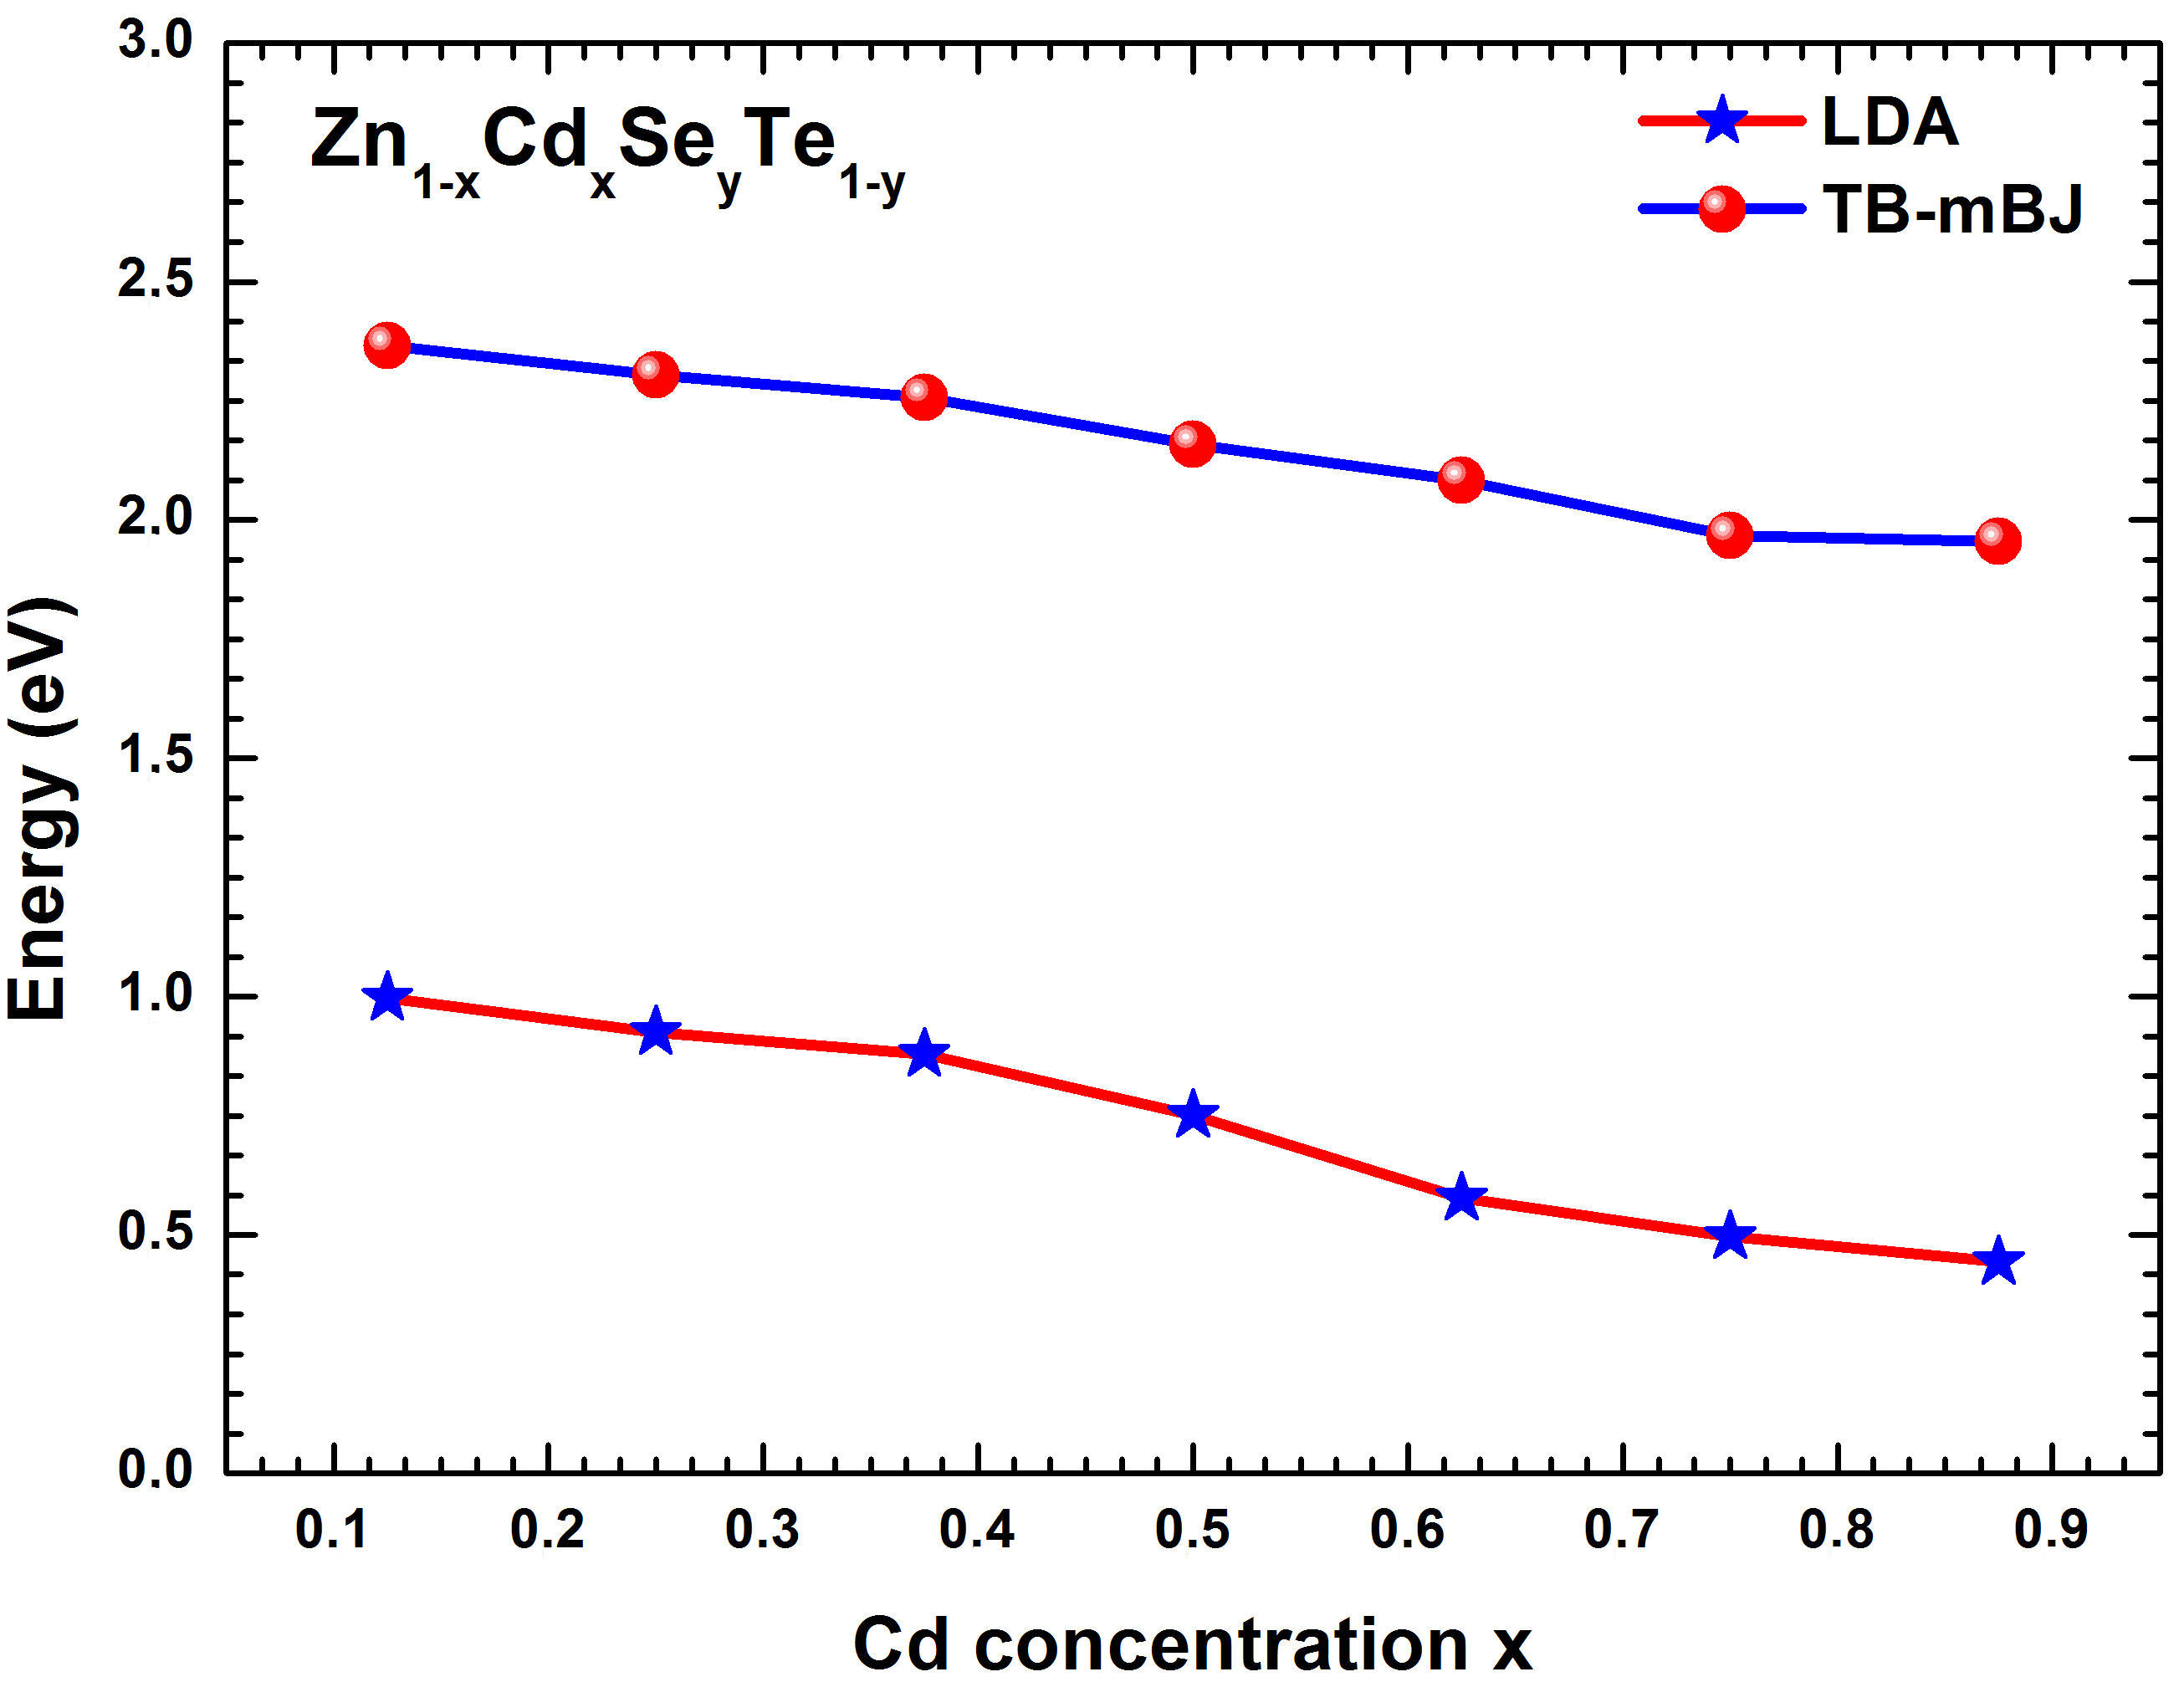
FIGURE 5 Bandgap energies Eg versus the concentration x for the Zn 1−x Cd x Se y Te 1−y lattice-matched to ZnTe.
From these equations, we can determine for a given composition (x) the related band gap (Eg) in the Zn1−xCdxSeyTe1−y alloy lattice matched to ZnTe. Thus, for the studied structure, we got the values (-0:1310 eV) and (-0:0456 eV) corresponding to the bowing parameter (b) for LDA and TB-mBJ schemes, respectively. As presented in Fig. 5, one notes the slight decreasing of the bandgap of Zn1−xCdxSeyTe1−y alloy with the increase of the Cd concentration (x). The computed TB-mBJ energy bandgap contour lines of Zn1−xCdxSeyTe1−y alloy versus Cd and Se concentrations are exhibited in Fig. 6. The contour lines allow the reading of values from the curve. The electronic band structures were computed for Zn1−xCdxSeyTe1−y quaternary alloy with the predicted lattice constant using the TBmBJ method. The corresponding results are shown in Figs. 7 and 8 for both quaternaries (Zn0:875Cd0:125Se0:093Te0:907; Zn0:750Cd0:250Se0:218Te0:782) and (Zn0:500Cd0:500Se0:437 Te0:563; Zn0:250Cd0:750Se0:656Te0:344) respectively. The calculations were performed along the high-symmetry lines of the first Brillouin zone, and the Fermi level has been set to zero. As shown in the figures cited above, the respective levels for the maximum valence band (VBmax) and minimum conduction band (CBmin) are located at point. Therefore, we conclude that the Zn1−xCdxSeyTe1−y quaternary is a direct bandgap alloy for the studied concentrations and is intended for optoelectronic applications.
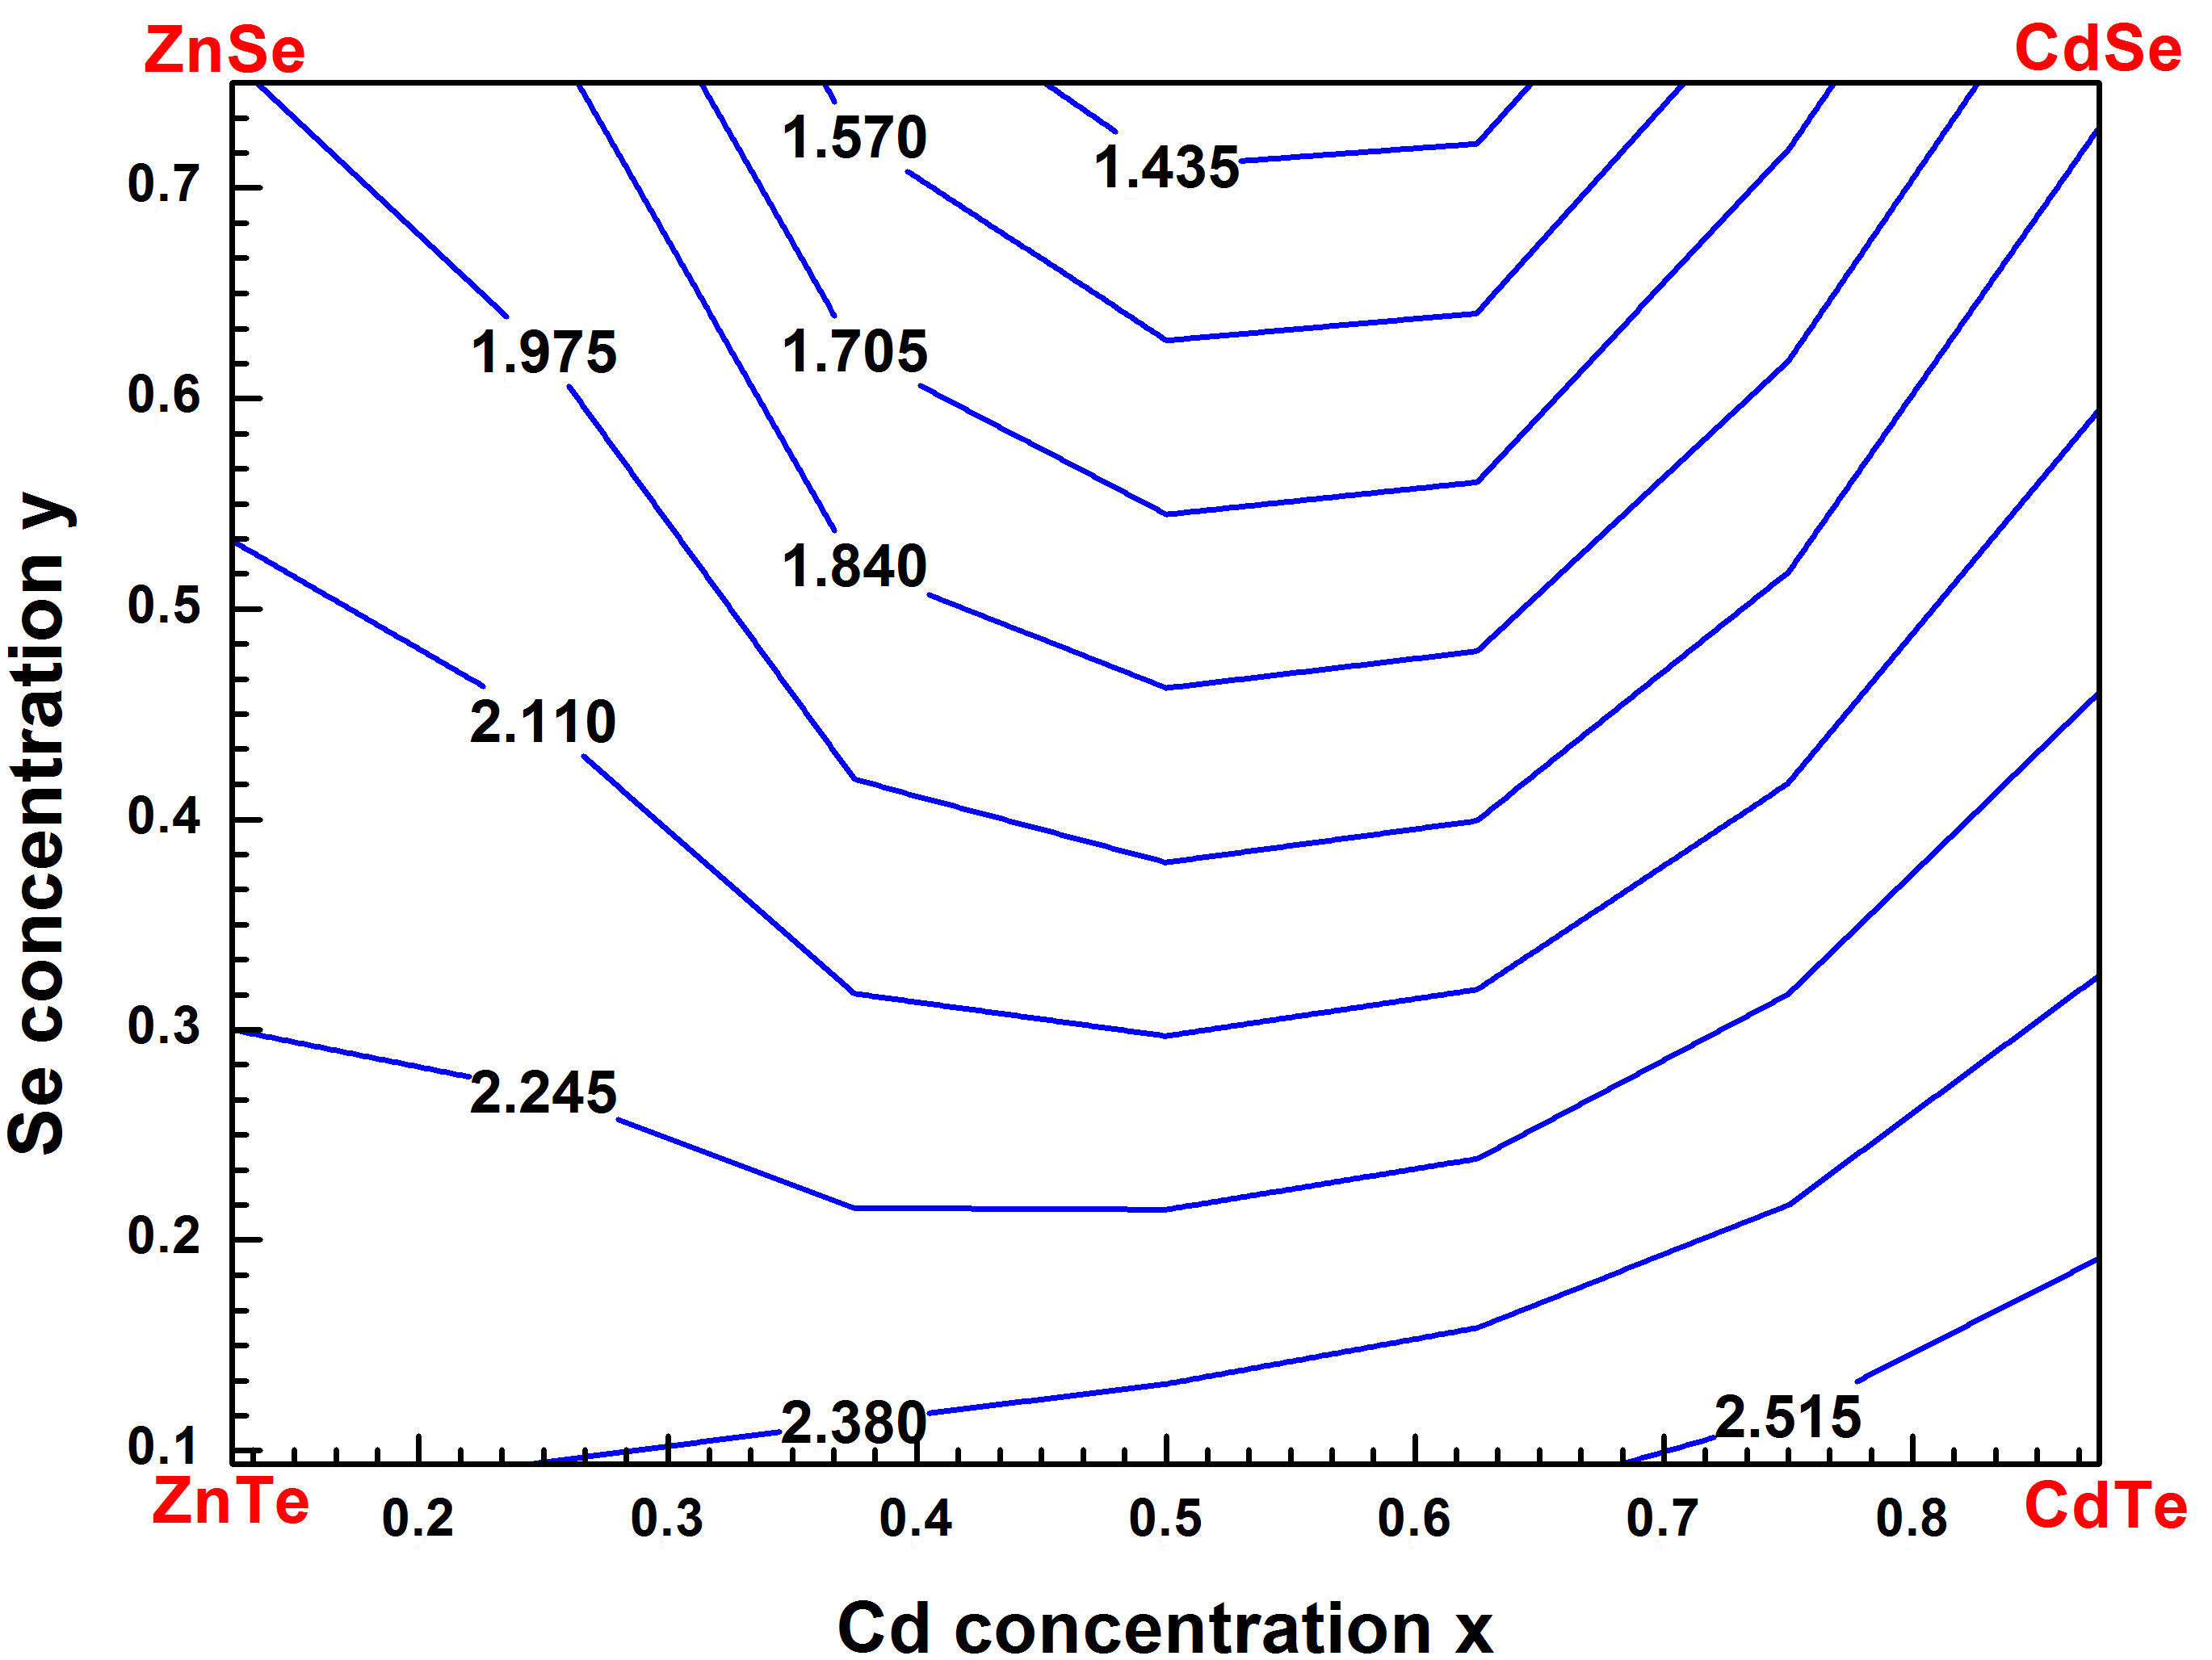
FIGURE 6 Energy band gap contour lines for Zn 1−x Cd x Se y Te 1−y quaternary alloys matched to ZnTe with TB-mBJ method.
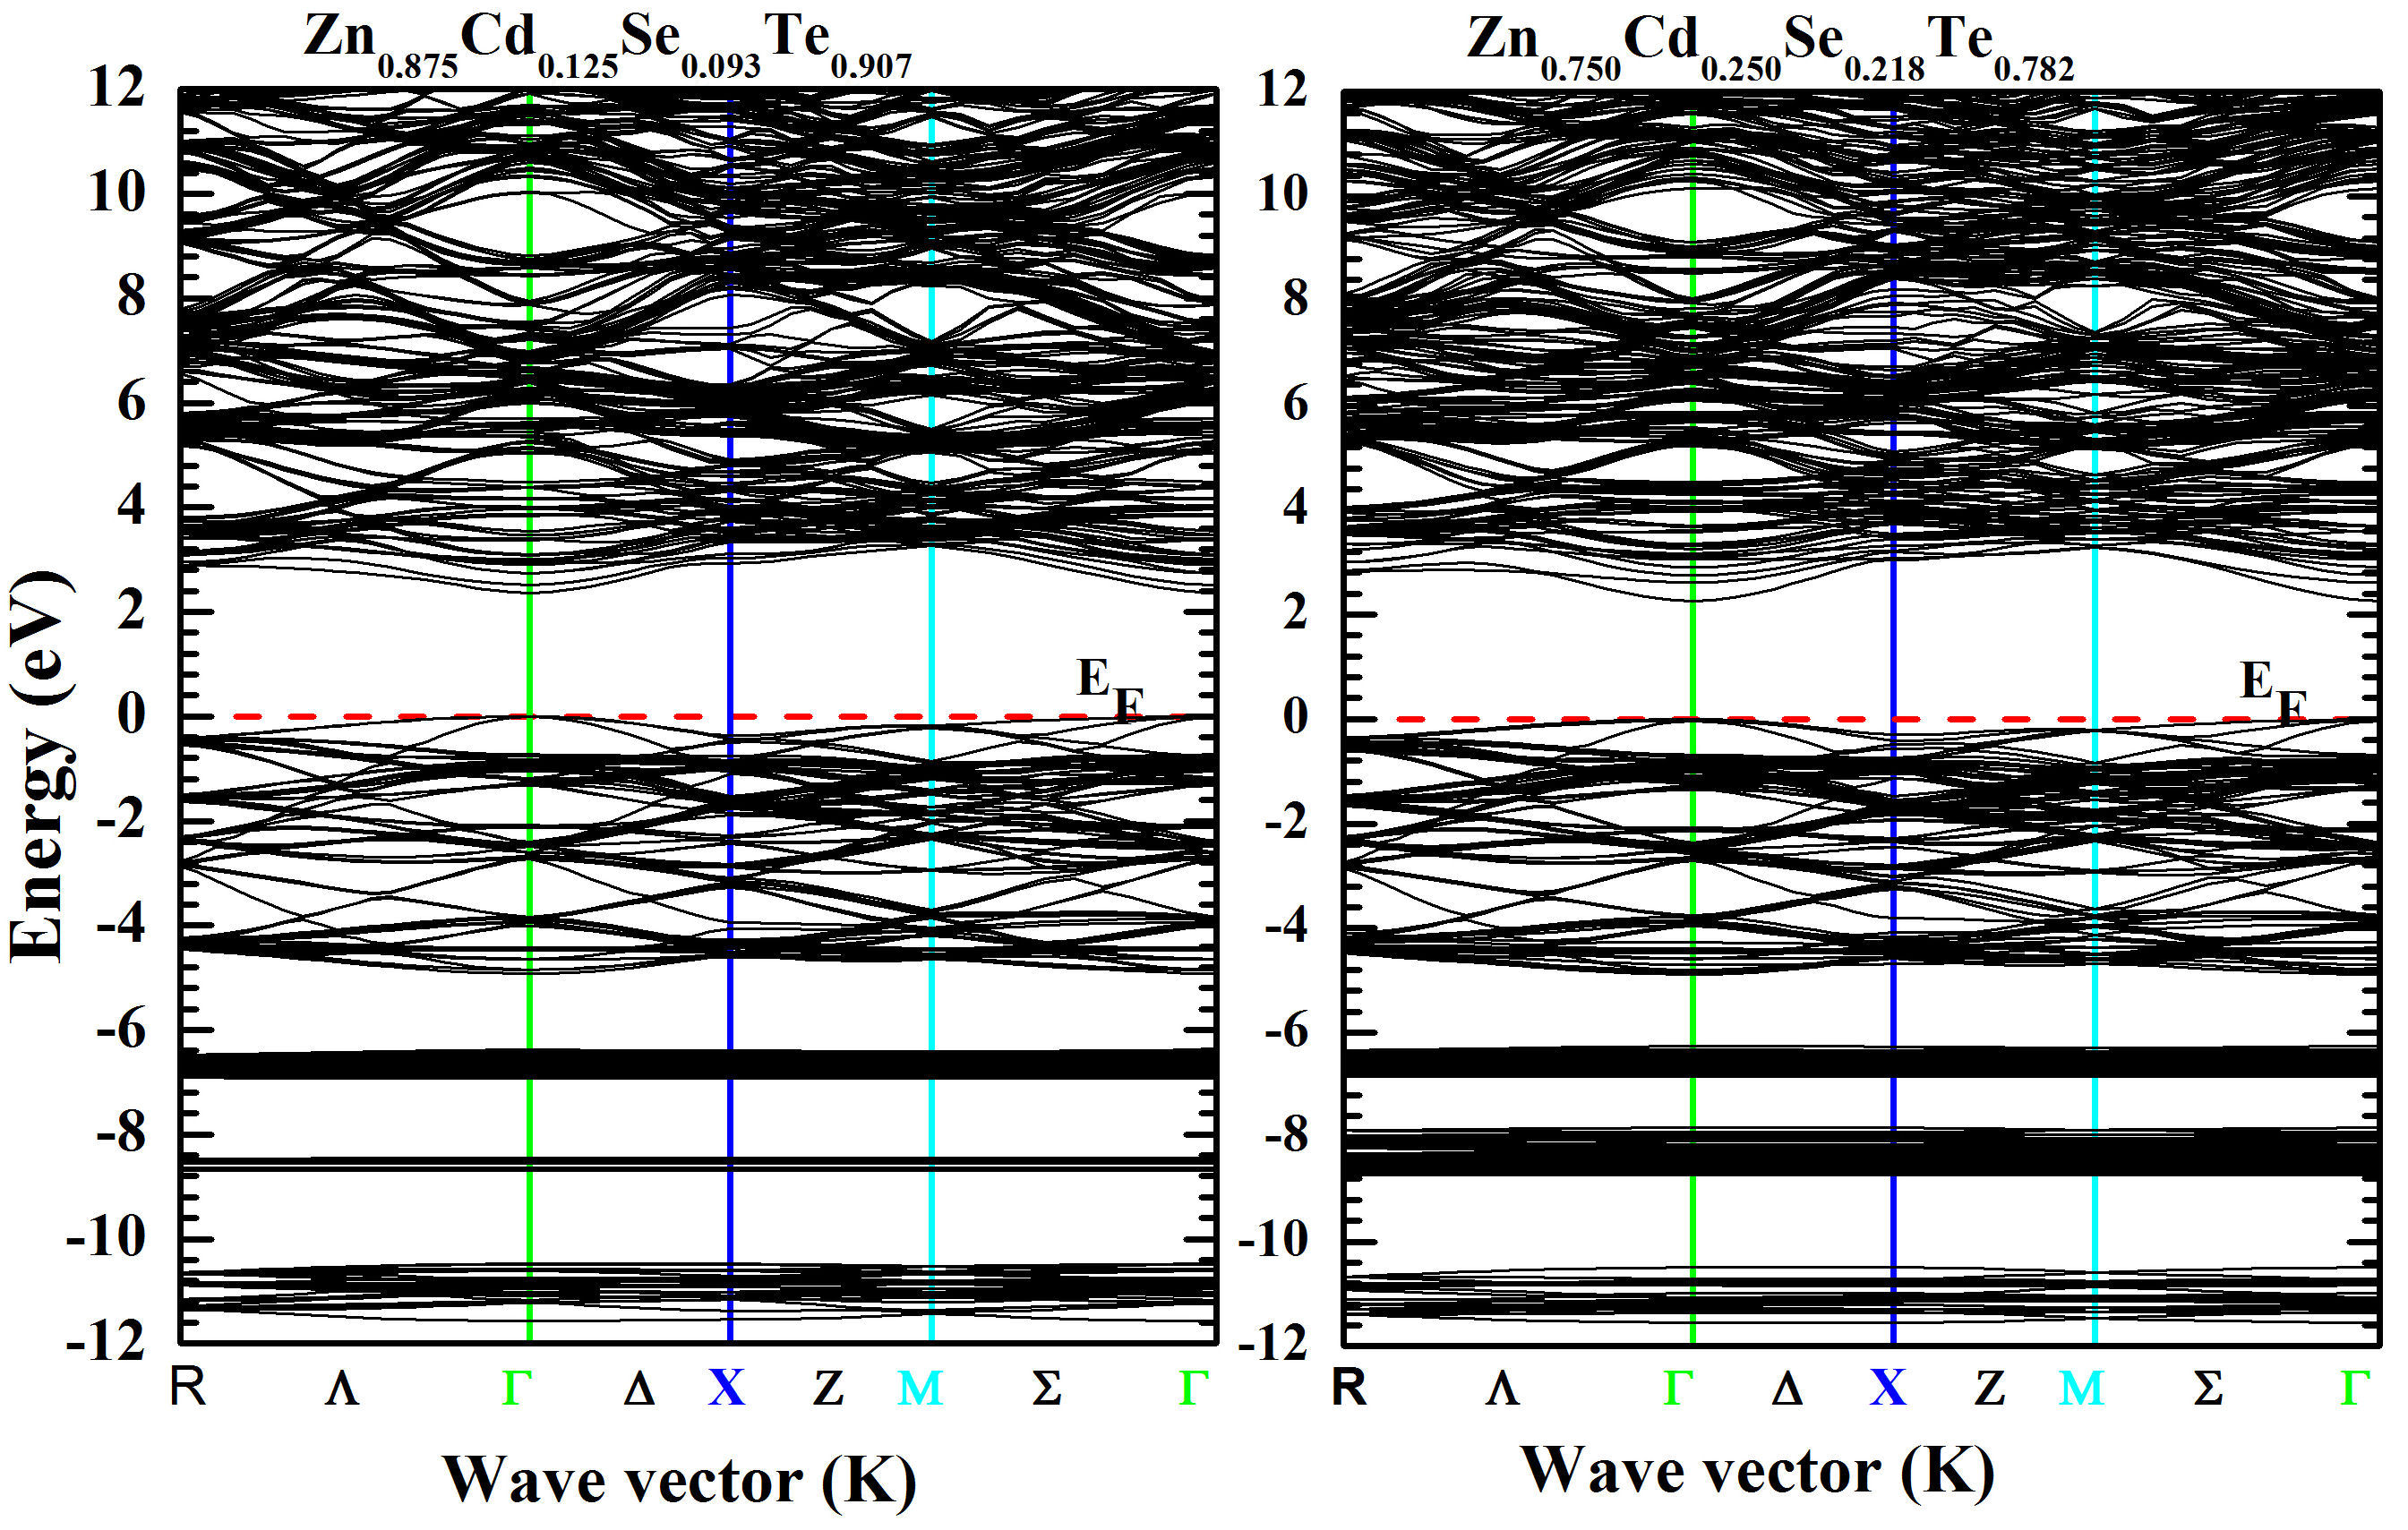
FIGURE 7 Band structure calculated for Zn 0.875 Cd 0.125 Se 0.093 Te 0.907 and Zn 0.750 Cd 0.250 Se 0.218 Te 0.782 with TB-mBJ method.
3.3. Optical properties
The rest of our work will be devoted to studying the optical properties of Zn 1−x Cd x Se y Te 1−y quaternary alloy. The calculations were performed at the equilibrium lattice constant of Zn 1−x Cd x Se y Te 1−y with x (0.250 ≤ x ≤ 0.875) using TB-mBJ approach. This method has an essential role in optical applications [33]. On the other hand, using the FP-LAPW method, Abt et al. [34] and Ambrosch-Draxl and Sofo [35] have detailed the procedure of optical properties calculation for semiconductor alloys. From the complex dielectric function dependent on the frequency ε(ω), several optical parameters of semiconductor materials can be deduced. The cited function is composed of two terms as follows:
where ε 1(ω) and ε 2(ω) present the real and imaginary part of the dielectric function, respectively. The ε 2(ω) values are determined directly from the electronic structure calculation through the joint density of states and the maximum matrix elements between the occupied eigenstates [2,36-38]:
where M, f i , and ω are the dipole matrix, Fermi distribution function, and the frequency of the incident photon, respectively. Thus, knowing ε 2(ω), we can then calculate ε 1(ω) using the Kramers-Kroning [39]: relation expressed as:
where p is the principal of the integral value. The knowledge of a dense mesh of eigenvectors [22] allows to determine the optical parameters. Thus, in our study, we have used 172kpoints in the irreducible part of the Brillouin zone. The halfwidth Lorentzian broadening was set to 0.1 eV, and the simulated material structure has a cubic symmetry. Moreover, other interesting optical parameters related to the dielectric function can be calculated [40,41]. Among these parameters, we limit our study to the refractive index n(ω), the extinction coefficient k(ω), the absorption coefficient α(ω) and the reflectivity R(ω), which are defined by the following relationships [2,42]:
where ω and λ present the angular frequency and the light in vacuum wavelength, respectively. In this work, the variations of the real and imaginary parts of dielectric functions ε 1(ω) and ε 2(ω), versus the incident photon energy were computed with TB-mBJ method for Zn 1−x Cd x Se y Te 1−y with different concentrations x(0.250 ≤ x ≤ 0.875). The low energy limit of the real part ε 1(ω) is defined as the static dielectric constant ε 1(0). In Table III are summarized the calculated ε 1(0) values and the peaks values in the dielectric function ε 2(ω) for the Zn 1−x Cd x Se y Te 1−y quaternary alloy. In Figs. 9 and 10 are shown respectively, the variations of the real and imaginary parts of dielectric functions ε 1(ω) and ε 2(ω) , versus the incident photon energy on the range of (0-20eV) for Zn 1−x Cd x Se y Te 1−y with x(0.250 ≤ x ≤ 0.875). The peak values (E 1,E 2,E 3) of the dielectric imaginary part function ε 2(ω) based on photon energy are derived from Fig. 9 and resumed in Table III. These energy peak values illustrate the electronic crossing of the valence band to the transmission band. Generally, we remark the same behavior of ε 2(ω) for both Cd concentrations. E 0 is defined as the threshold energy of the dielectric function and determines the direct optical transitions between the highest valence band (HVB) and the lowest conduction band (LCB) at Γ point. E 2 and E 3 peaks move to lower energies while E 2 peaks shift towards lower energies. On the other hand, E 1 and E 3 peak sizes decrease with the increase of Cd concentration while E 2 peak increases with increasing of x concentration. Referring to Table III, it is observed that the ε 1(0) value decreases with increasing of Cd concentration for the Zn 1−x Cd x Se y Te 1−y quaternary alloy. We also note from Fig. 10 that the real part ε 1(ω) increases for the photon energy values between 2 and 7 eV with two peaks E 0 and E 1, equal to 5 and 7 eV, respectively. Then ε 1(ω) decreases sharply with the energy increasing from the value of 7 eV and reaches its minimum for the energy value of 10 eV.
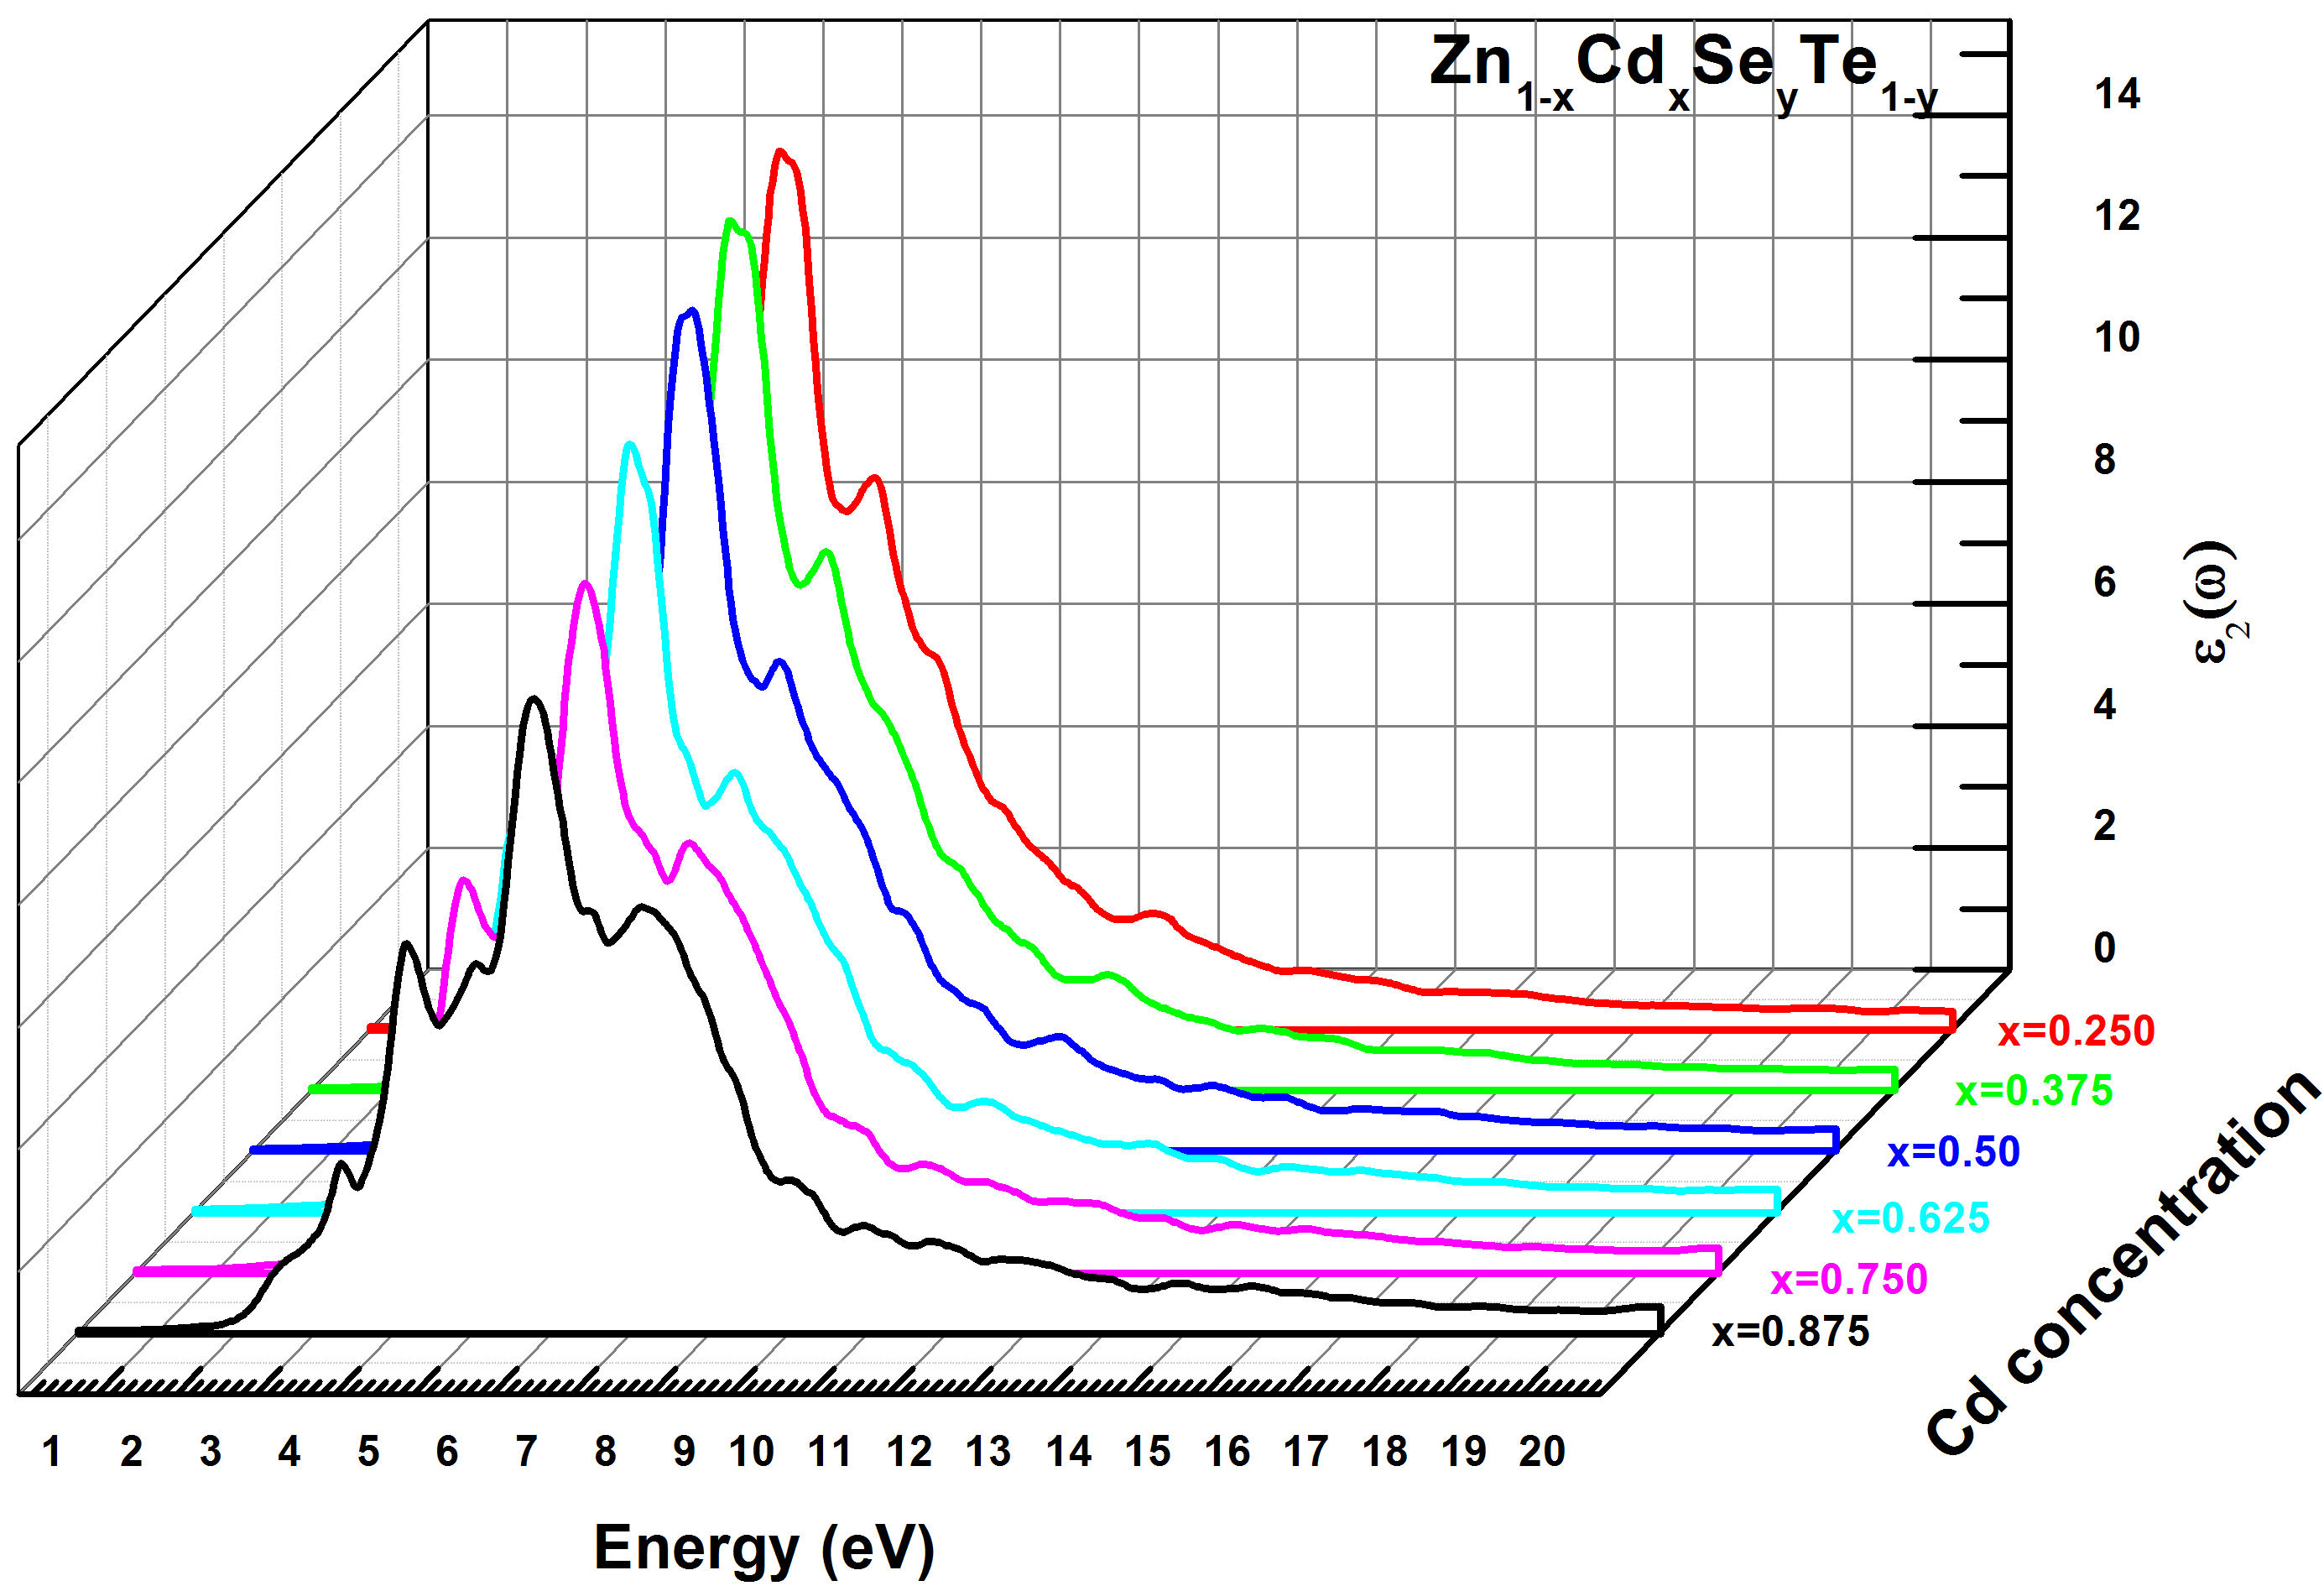
FIGURE 9 Imaginary part of the dielectric function ε 2(ω) for Zn 1−x Cd x Se y Te 1−y alloys using TB-mBJ method.
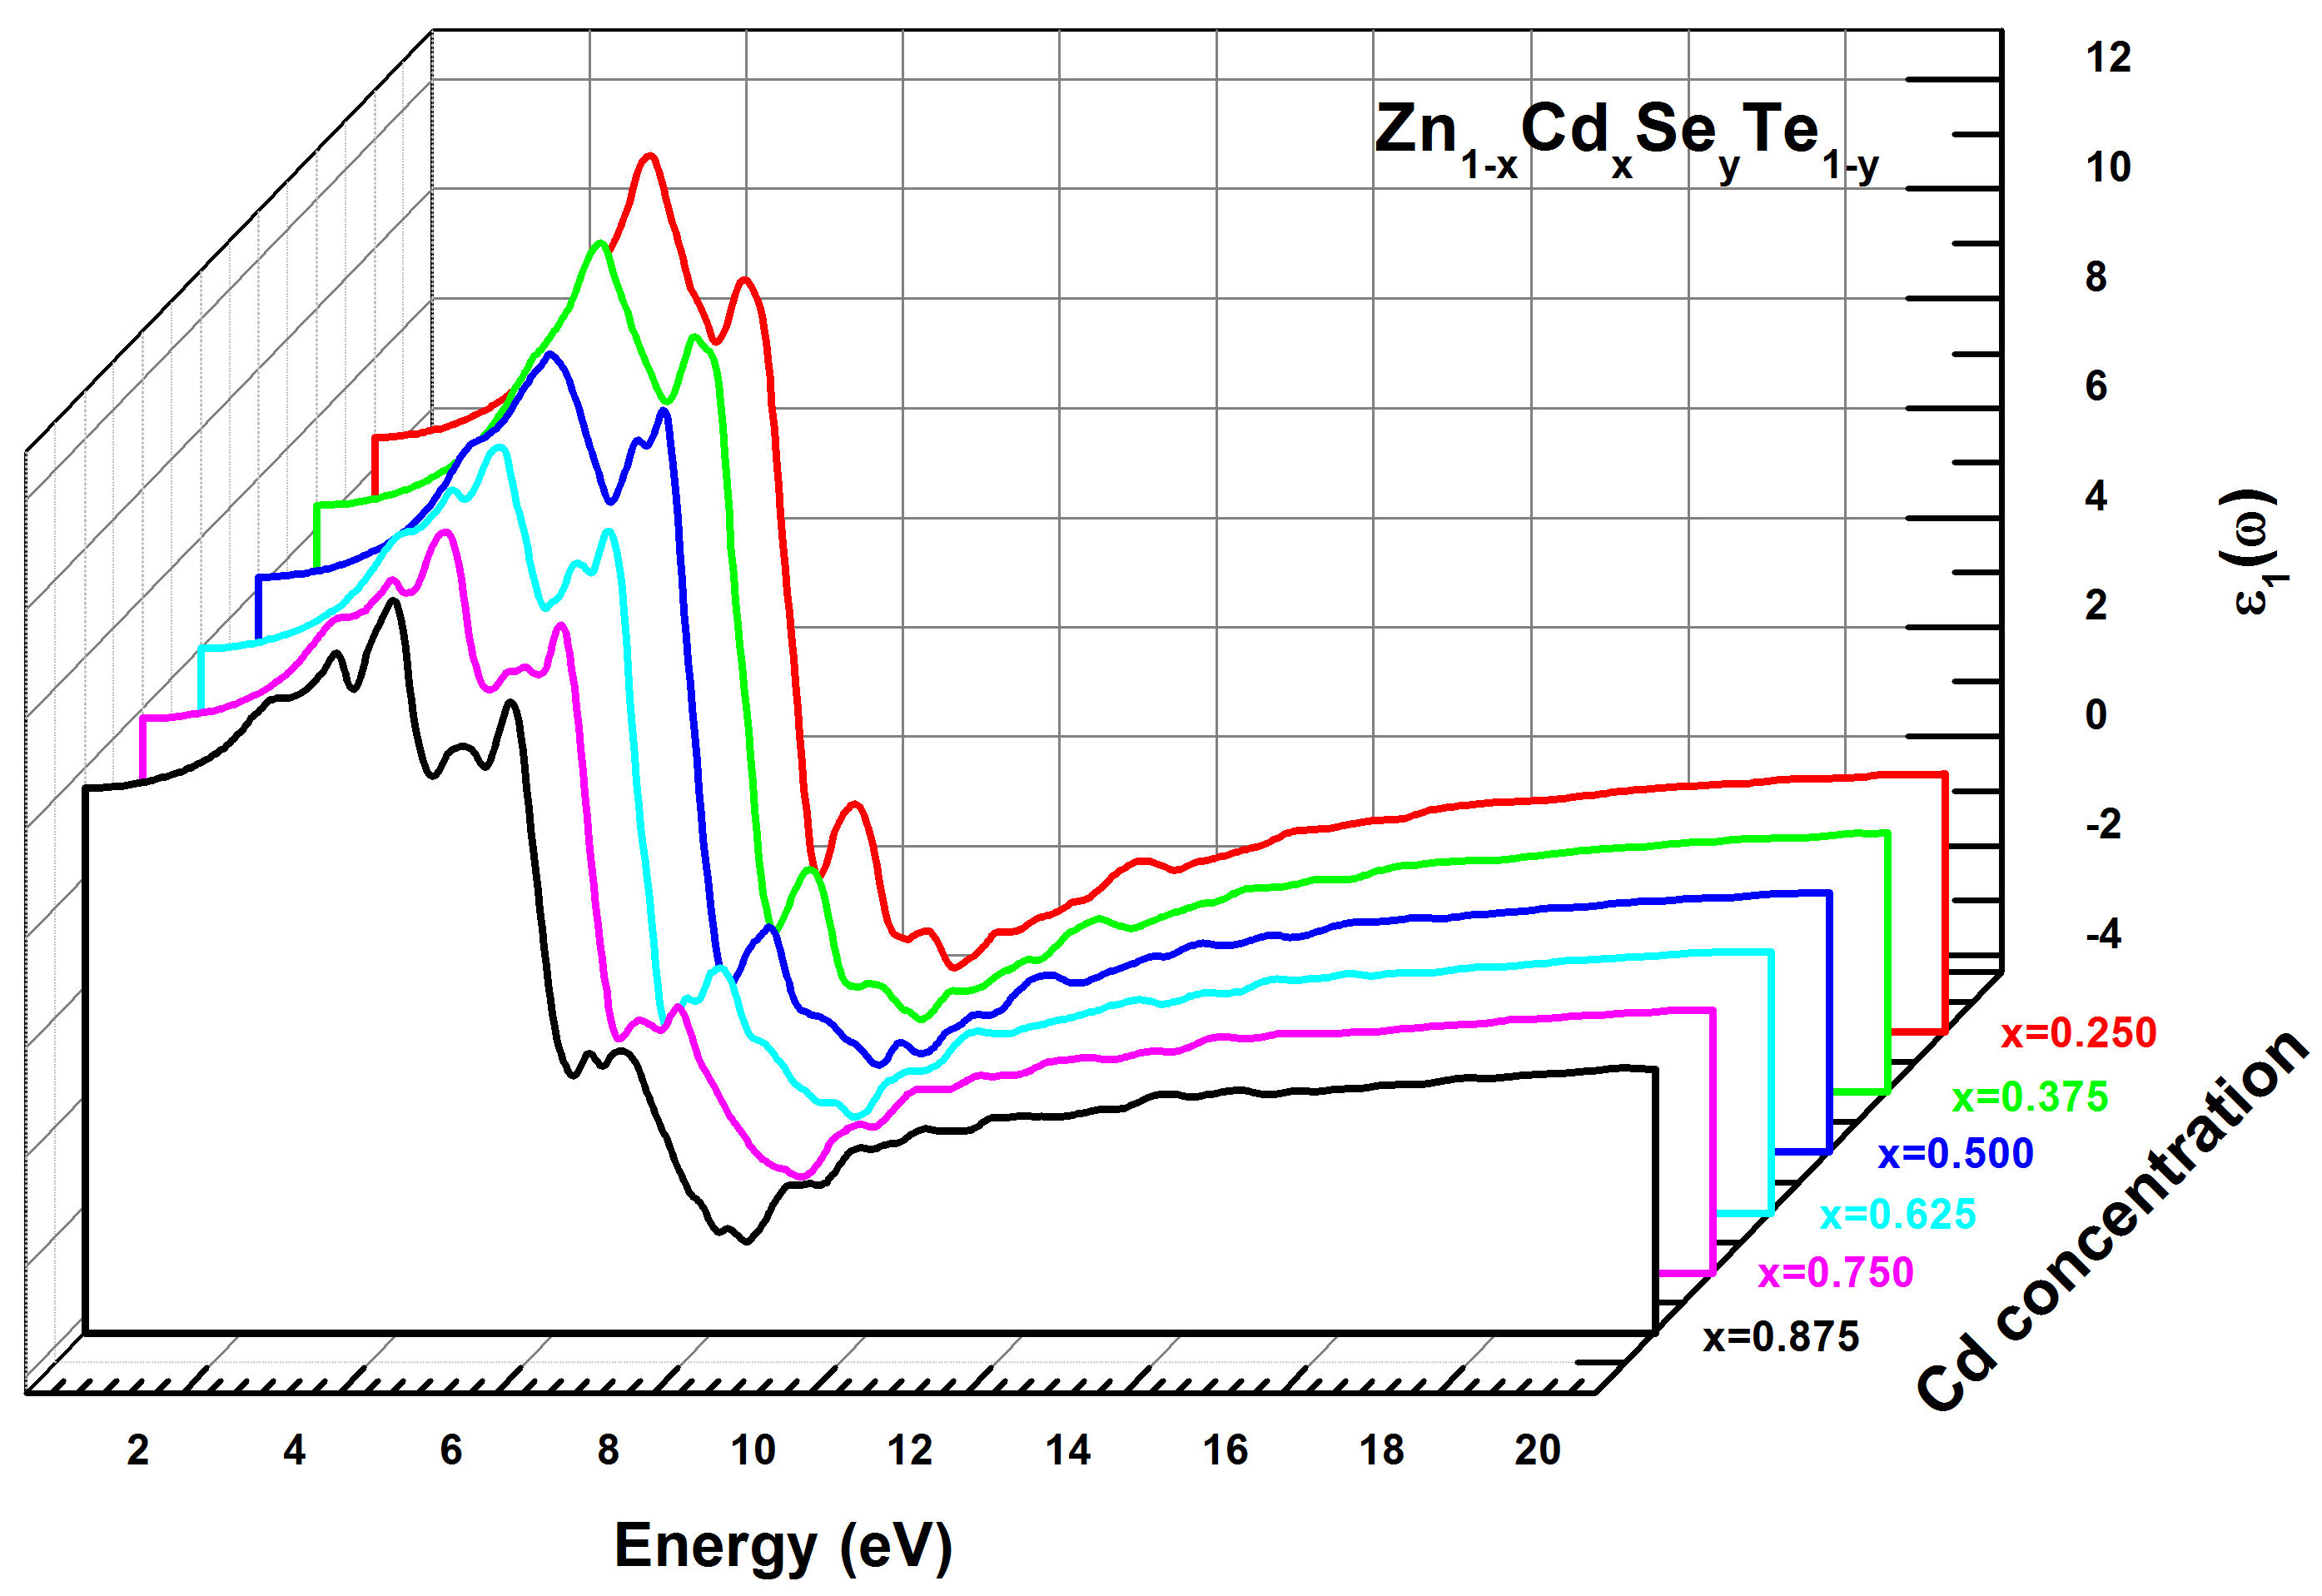
FIGURE 10 Real part of the dielectric function ε 1(ω) for Zn 1−x Cd x Se y Te 1−y alloys using TB-mBJ method.
TABLE III Calculated critical points of the peaks (eV) in the dielectric function ε 2(ω) and the static optical parameter ε 1(0) for Zn1−x Cd x Se y Te1−y quaternary alloys with TB-mBJ method.
| Compound | This work | Other work | Experiment | ||||||||
| E 0 | E 1 | E 2 | E 3 | ε 1(0) | E 1 | E 2 | E 3 | E 1 | E 2 | E 3 | |
| Zn 0.750 Cd 0.250 Se 0.218 Te 0.782 | 2.237 | 4.293 | 5.231 | 6.400 | 6.564 | - | - | - | - | - | - |
| Zn 0.625 Cd 0.375 Se 0.312 Te 0.688 | 2.257 | 4.364 | 5.306 | 6.522 | 6.421 | - | - | - | - | - | - |
| Zn 0.500 Cd 0.500 Se 0.437 Te 0.563 | 2.150 | 4.395 | 5.580 | 6.706 | 6.204 | - | - | - | - | - | - |
| Zn 0.375 Cd 0.625 Se 0.531 Te 0.469 | 2.008 | 4.263 | 5.546 | 6.858 | 6.002 | - | - | - | - | - | - |
| Zn 0.250 Cd 0.750 Se 0.656 Te 0.344 | 1.967 | 4.179 | 5.715 | 7.040 | 5.799 | - | - | - | - | - | - |
| Zn 0.125 Cd 0.875 Se 0.750 Te 0.250 | 1.954 | 4.163 | 5.573 | 7.199 | 5.639 | - | - | - | - | - | - |
The refractive index (n) was computed at the equilibrium lattice constant. The results performed with the TBmBJ method are exhibited in Table IV. The spectral curves of the refractive index n(ω) for Zn 1−x Cd x Se y Te 1−y alloy are presented in Fig. 11 and show that the critical points of n(ω) change with the variation of the direct bandgap value (E g ). The refractive index n(ω) increases with E g between 0 and 4.0 eV, then reaches its maximum value in the energy range (4.5−6 eV).
TABLE IV Calculated refractive index (n) versus the concentration (x) for Zn1−x Cd x Se y Te 1−y quaternary alloys with TB-mBJ method.
| Compound | This work | Other work | Experiment | |
| n | n | n | ||
| Zn 1−x Cd x Se y Te 1−y | x | |||
| 0.250 | 2.562 | - | - | |
| 0.375 | 2.534 | - | - | |
| 0.500 | 2.490 | - | - | |
| 0.625 | 2.450 | - | - | |
| 0.750 | 2.408 | - | - | |
| 0.875 | 2.374 | - | - |
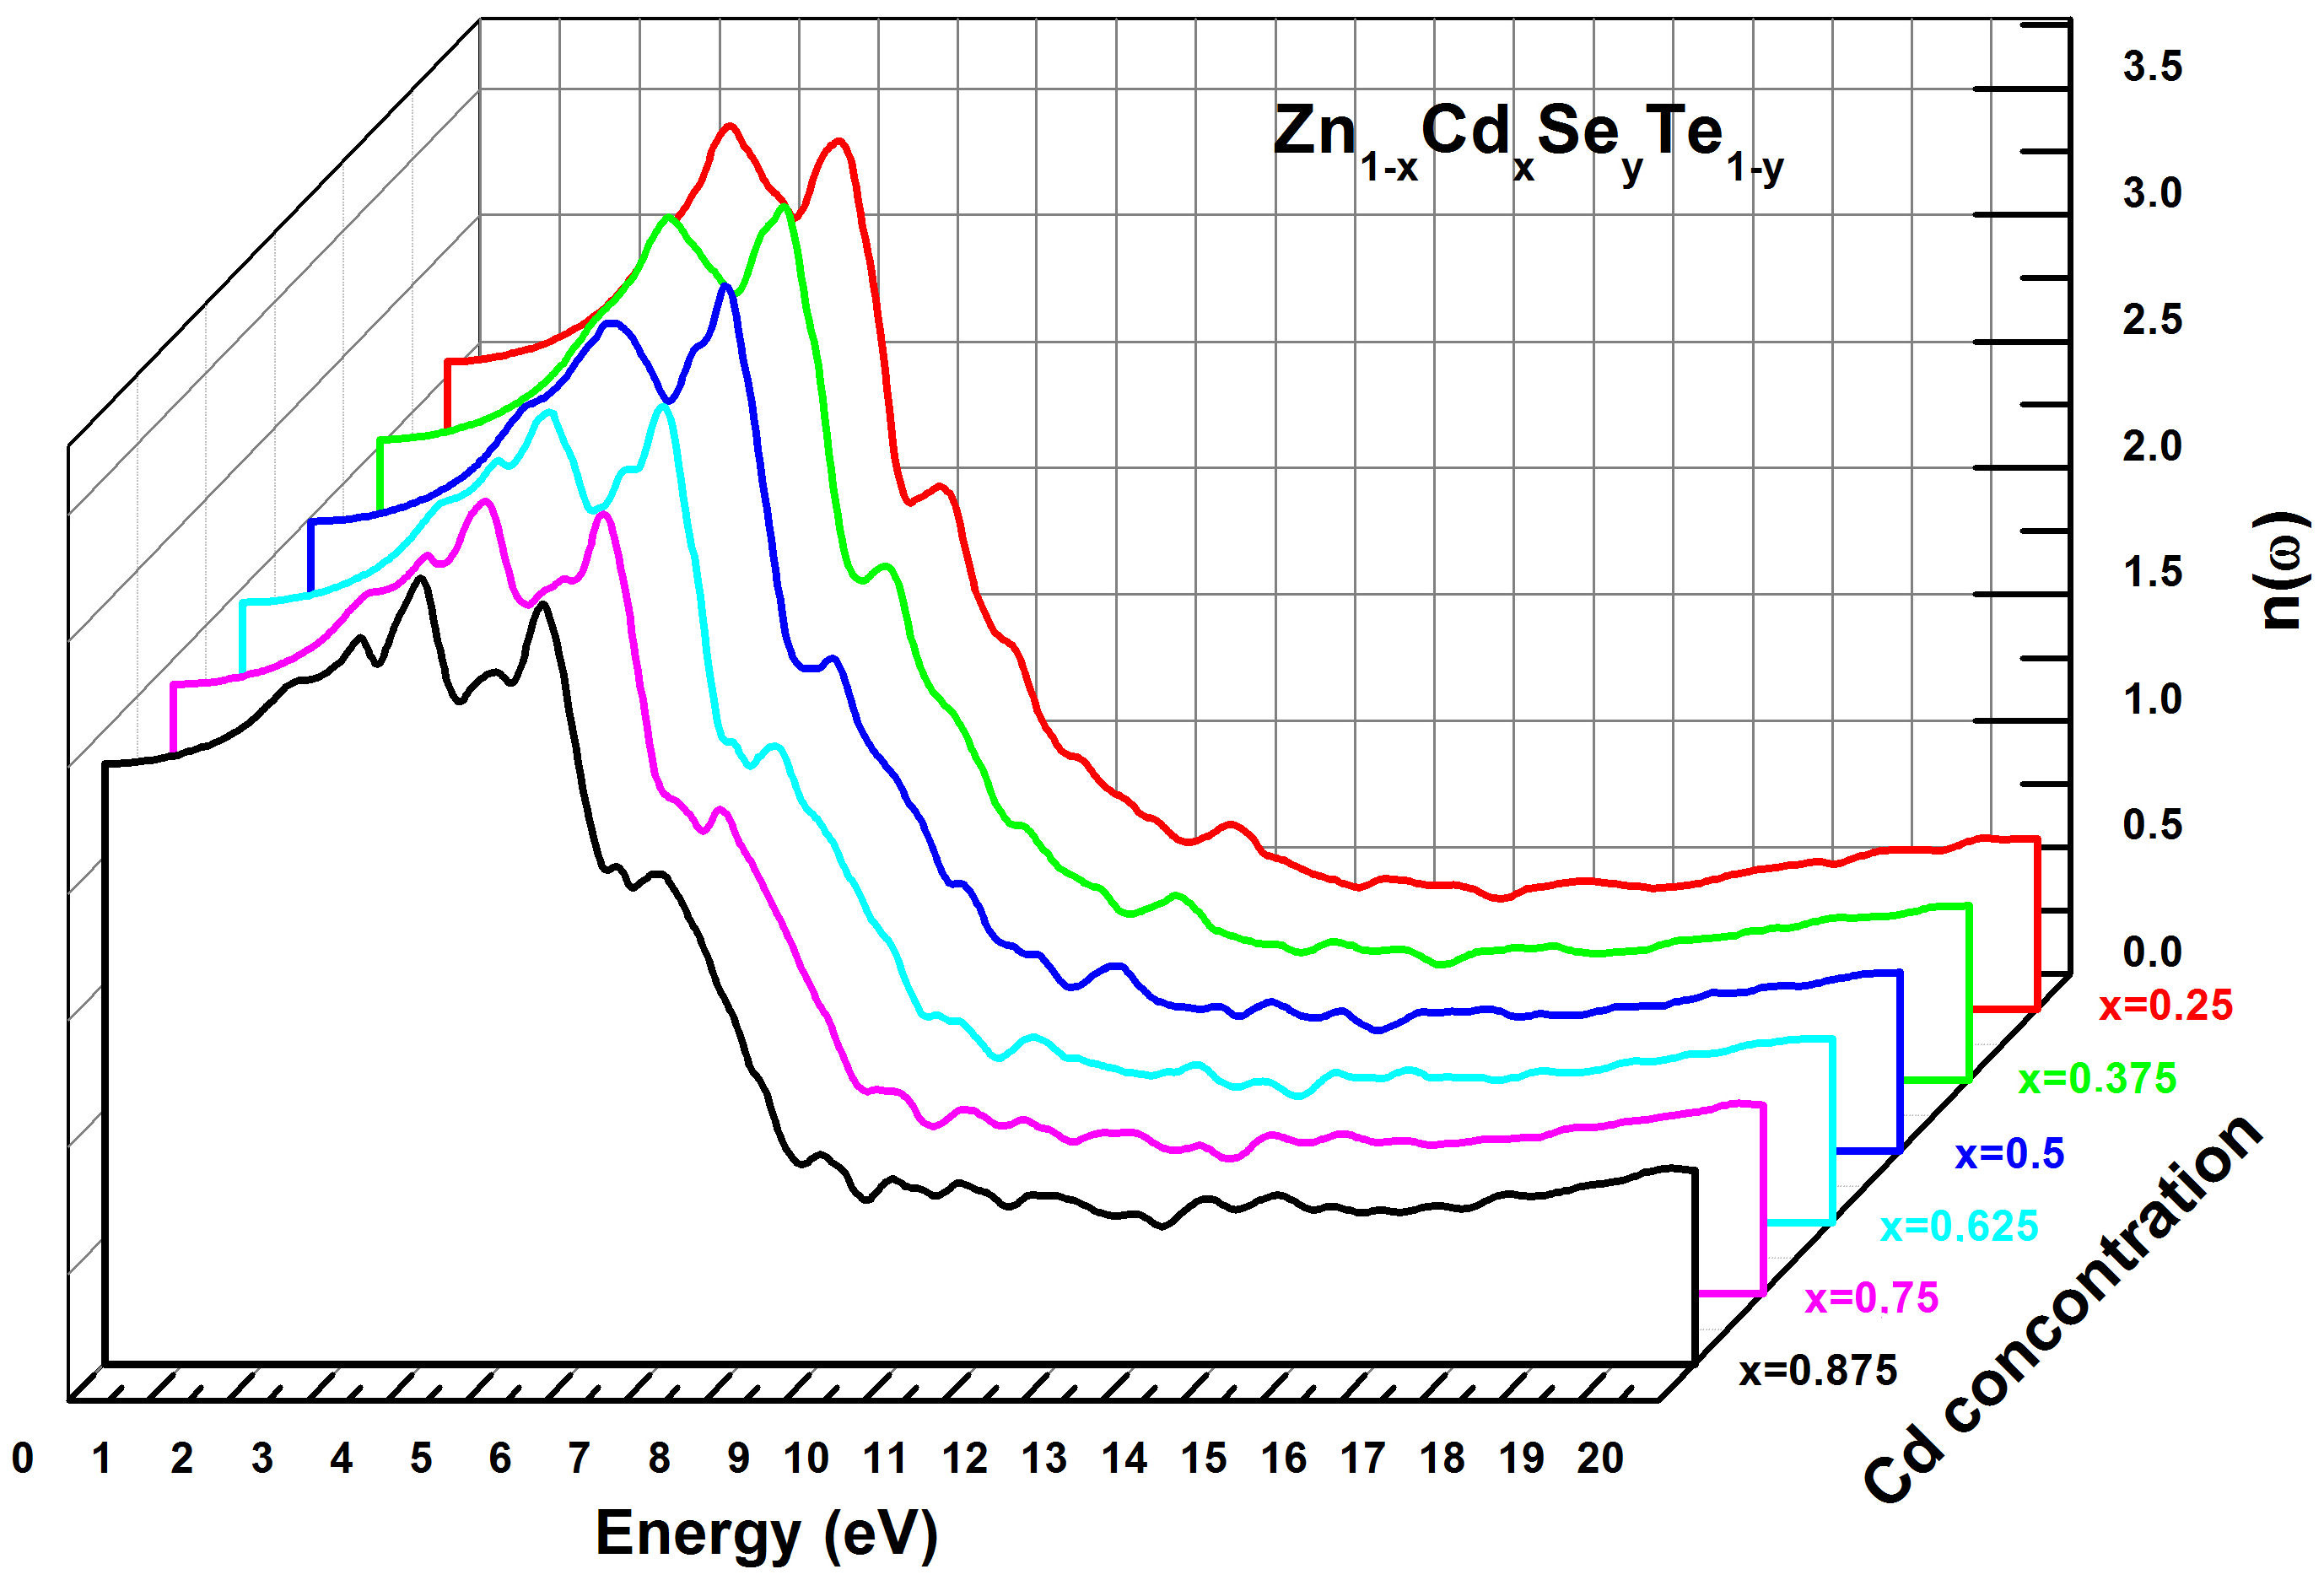
FIGURE 11 Calculated refractive index n(ω) for Zn 1−x Cd x Se y Te 1−y quaternary alloys using TB-mBJ method.
For energy values between 6 and 10 eV, n(ω) decreases progressively. The minimum value of n(ω) is obtained for E g > 10 eV. Also, the variation of the refractive index (n) versus the concentration (x) was studied and presented in Fig. 12, which indicates that (n) varies linearly and decreases with increasing Cd concentration (x). By extrapolating the calculated refractive index n(x) to a polynomial equation, a bowing parameter (b = −0.025 eV) was obtained, as shown in the following relation:
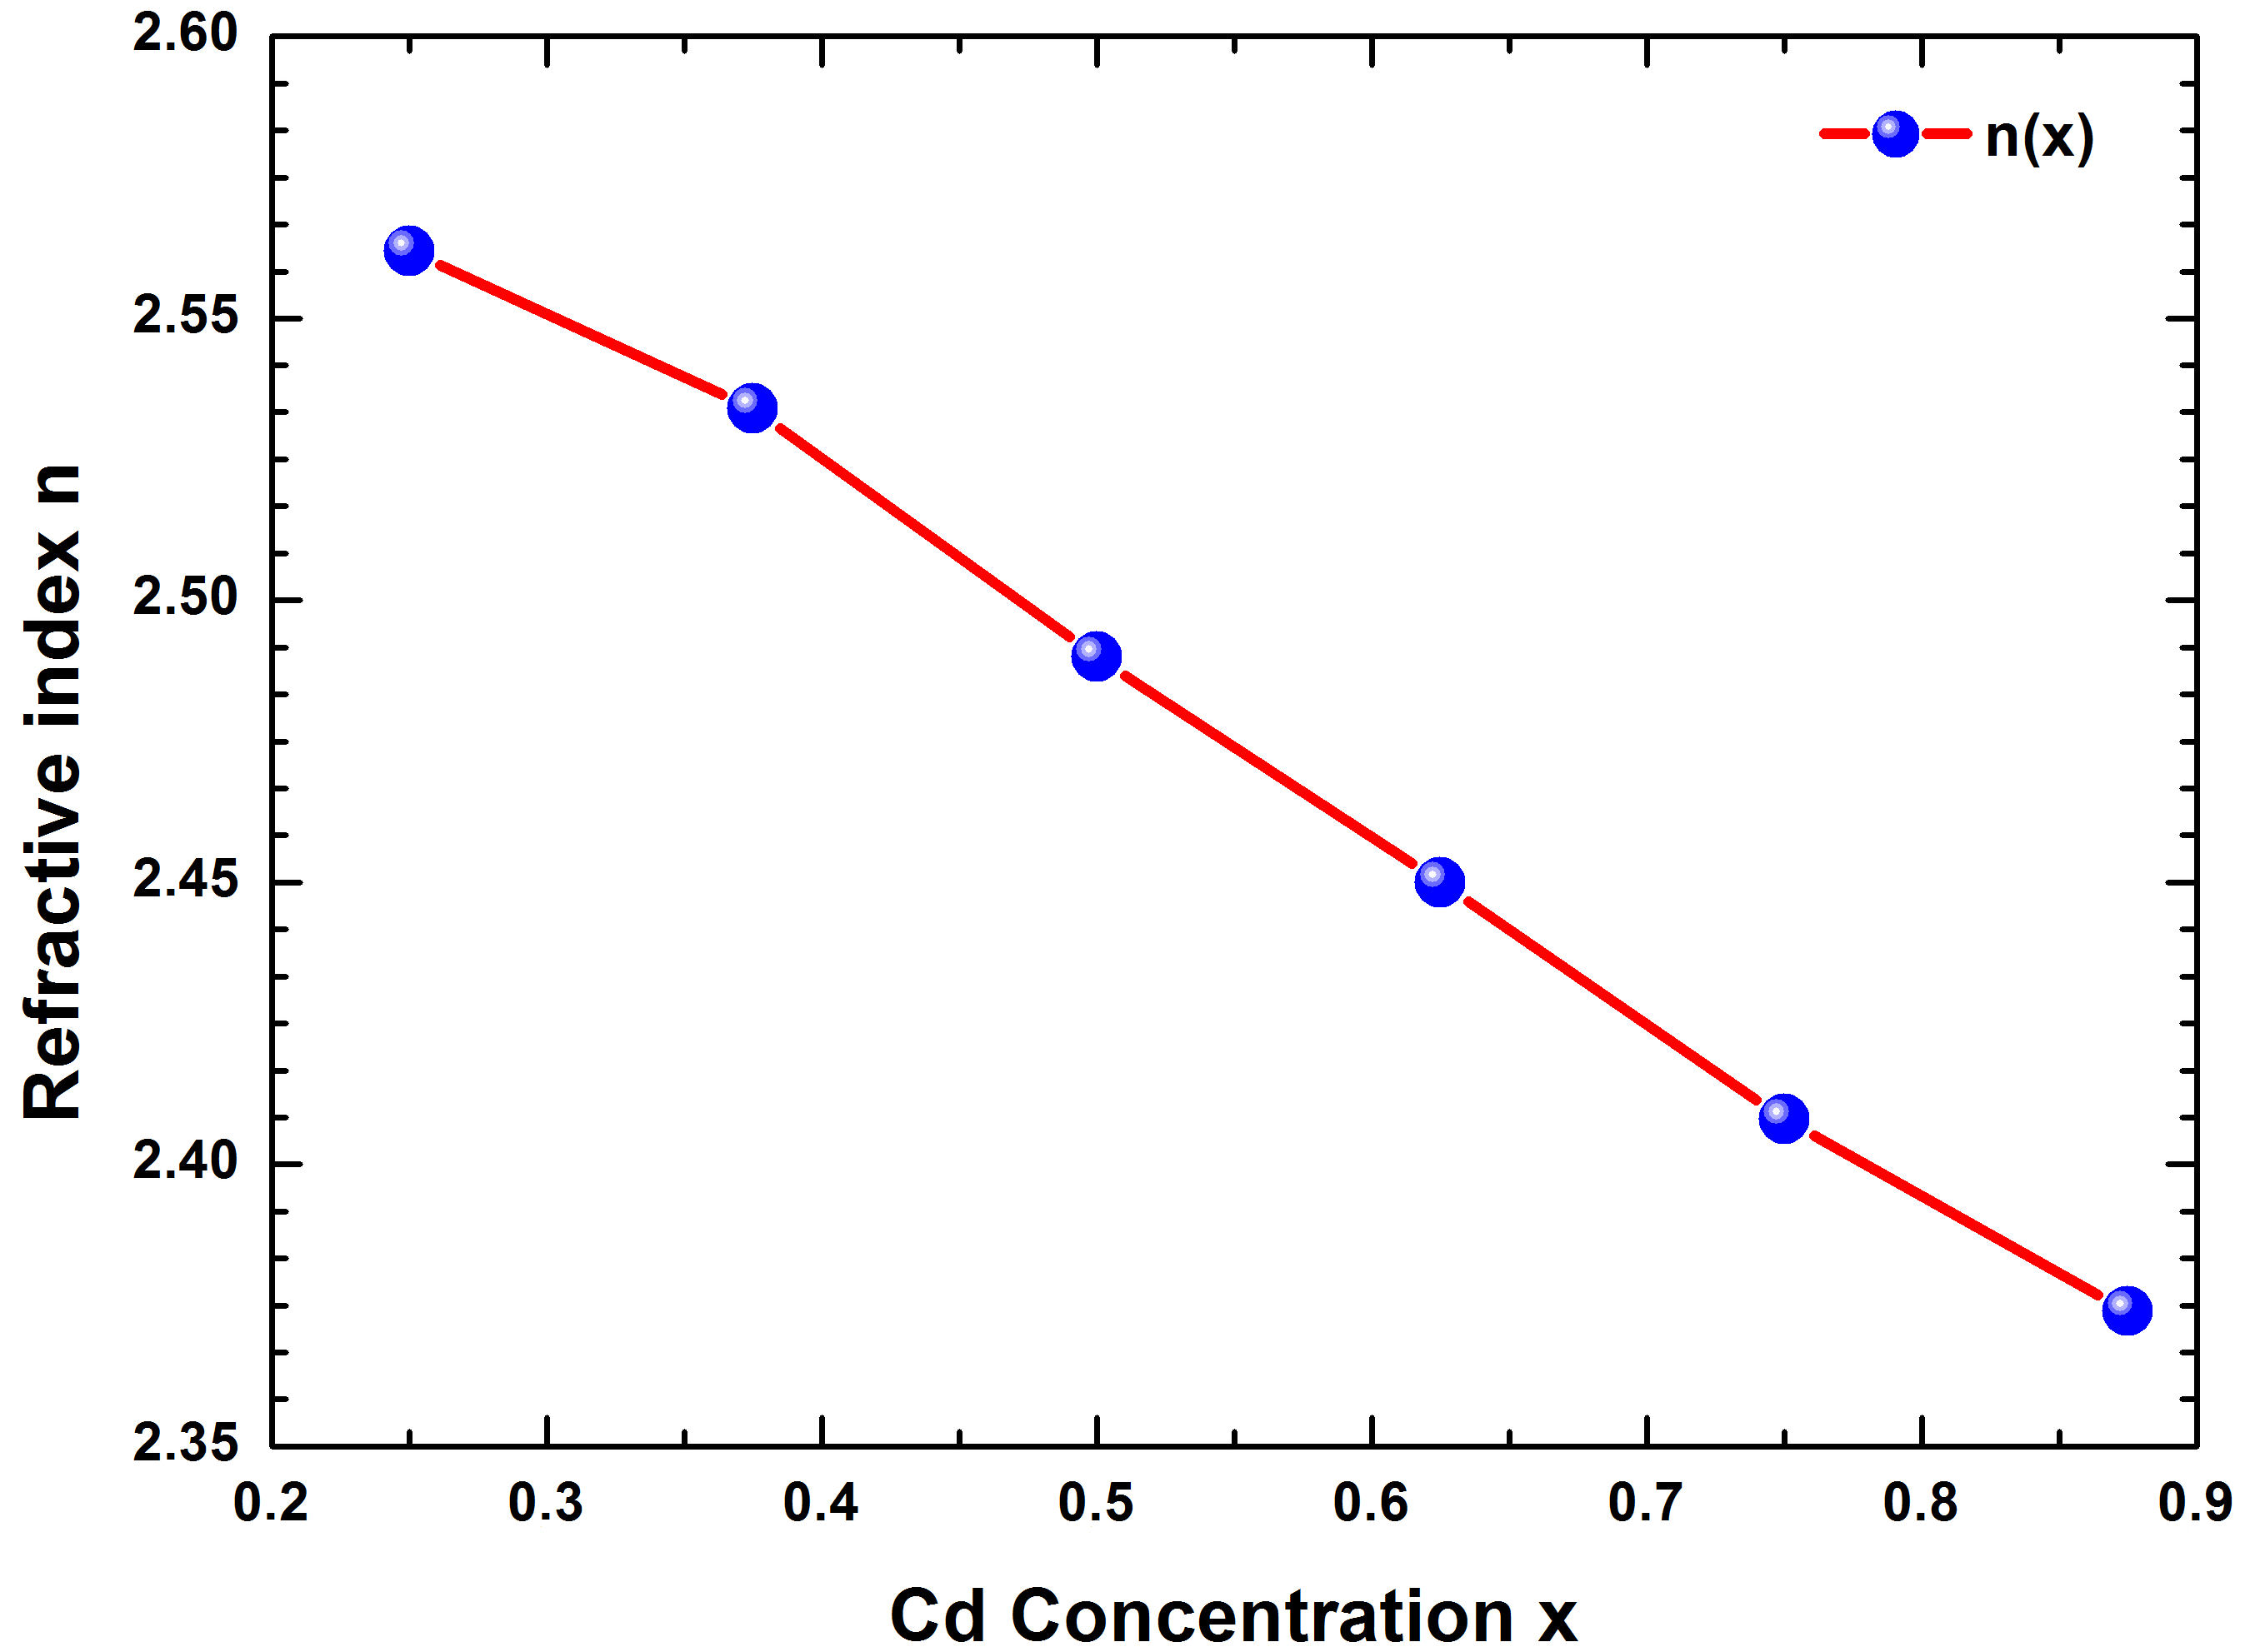
FIGURE 12 Refractive index (n) of Zn 1−x Cd x Se y Te 1−y quaternary alloys versus the concentration (x) with TB-mBJ method.
As described in previous expressions of optical properties showing the relationships between the dielectric constant, the extinction, and absorption coefficient, hence we have simulated this last parameter α(ω) for the Zn 1−x Cd x Se y Te 1−y quaternary alloy. In semiconductor materials, the absorption phenomena manifest itself when the photon energy of the incident beam is higher than E g (hγ > Eg), leading the electrons excitation from the valence band (VB) to the conduction (CB). The calculated absorption coefficient α(ω) for Zn 1−x Cd x Se y Te 1−y quaternary alloy is plotted in Fig. 13. Thus, we remark a sharp variation of α(ω) occurring approximatively in the photon energy range (2−10 eV). More specifically, in low energies (2 − 7 eV), the absorption coefficient increases rapidly and then decreases strongly for energies included in the interval (7−10 eV). The lowest values of α(ω) were obtained for higher energies (Eg > 15 eV).
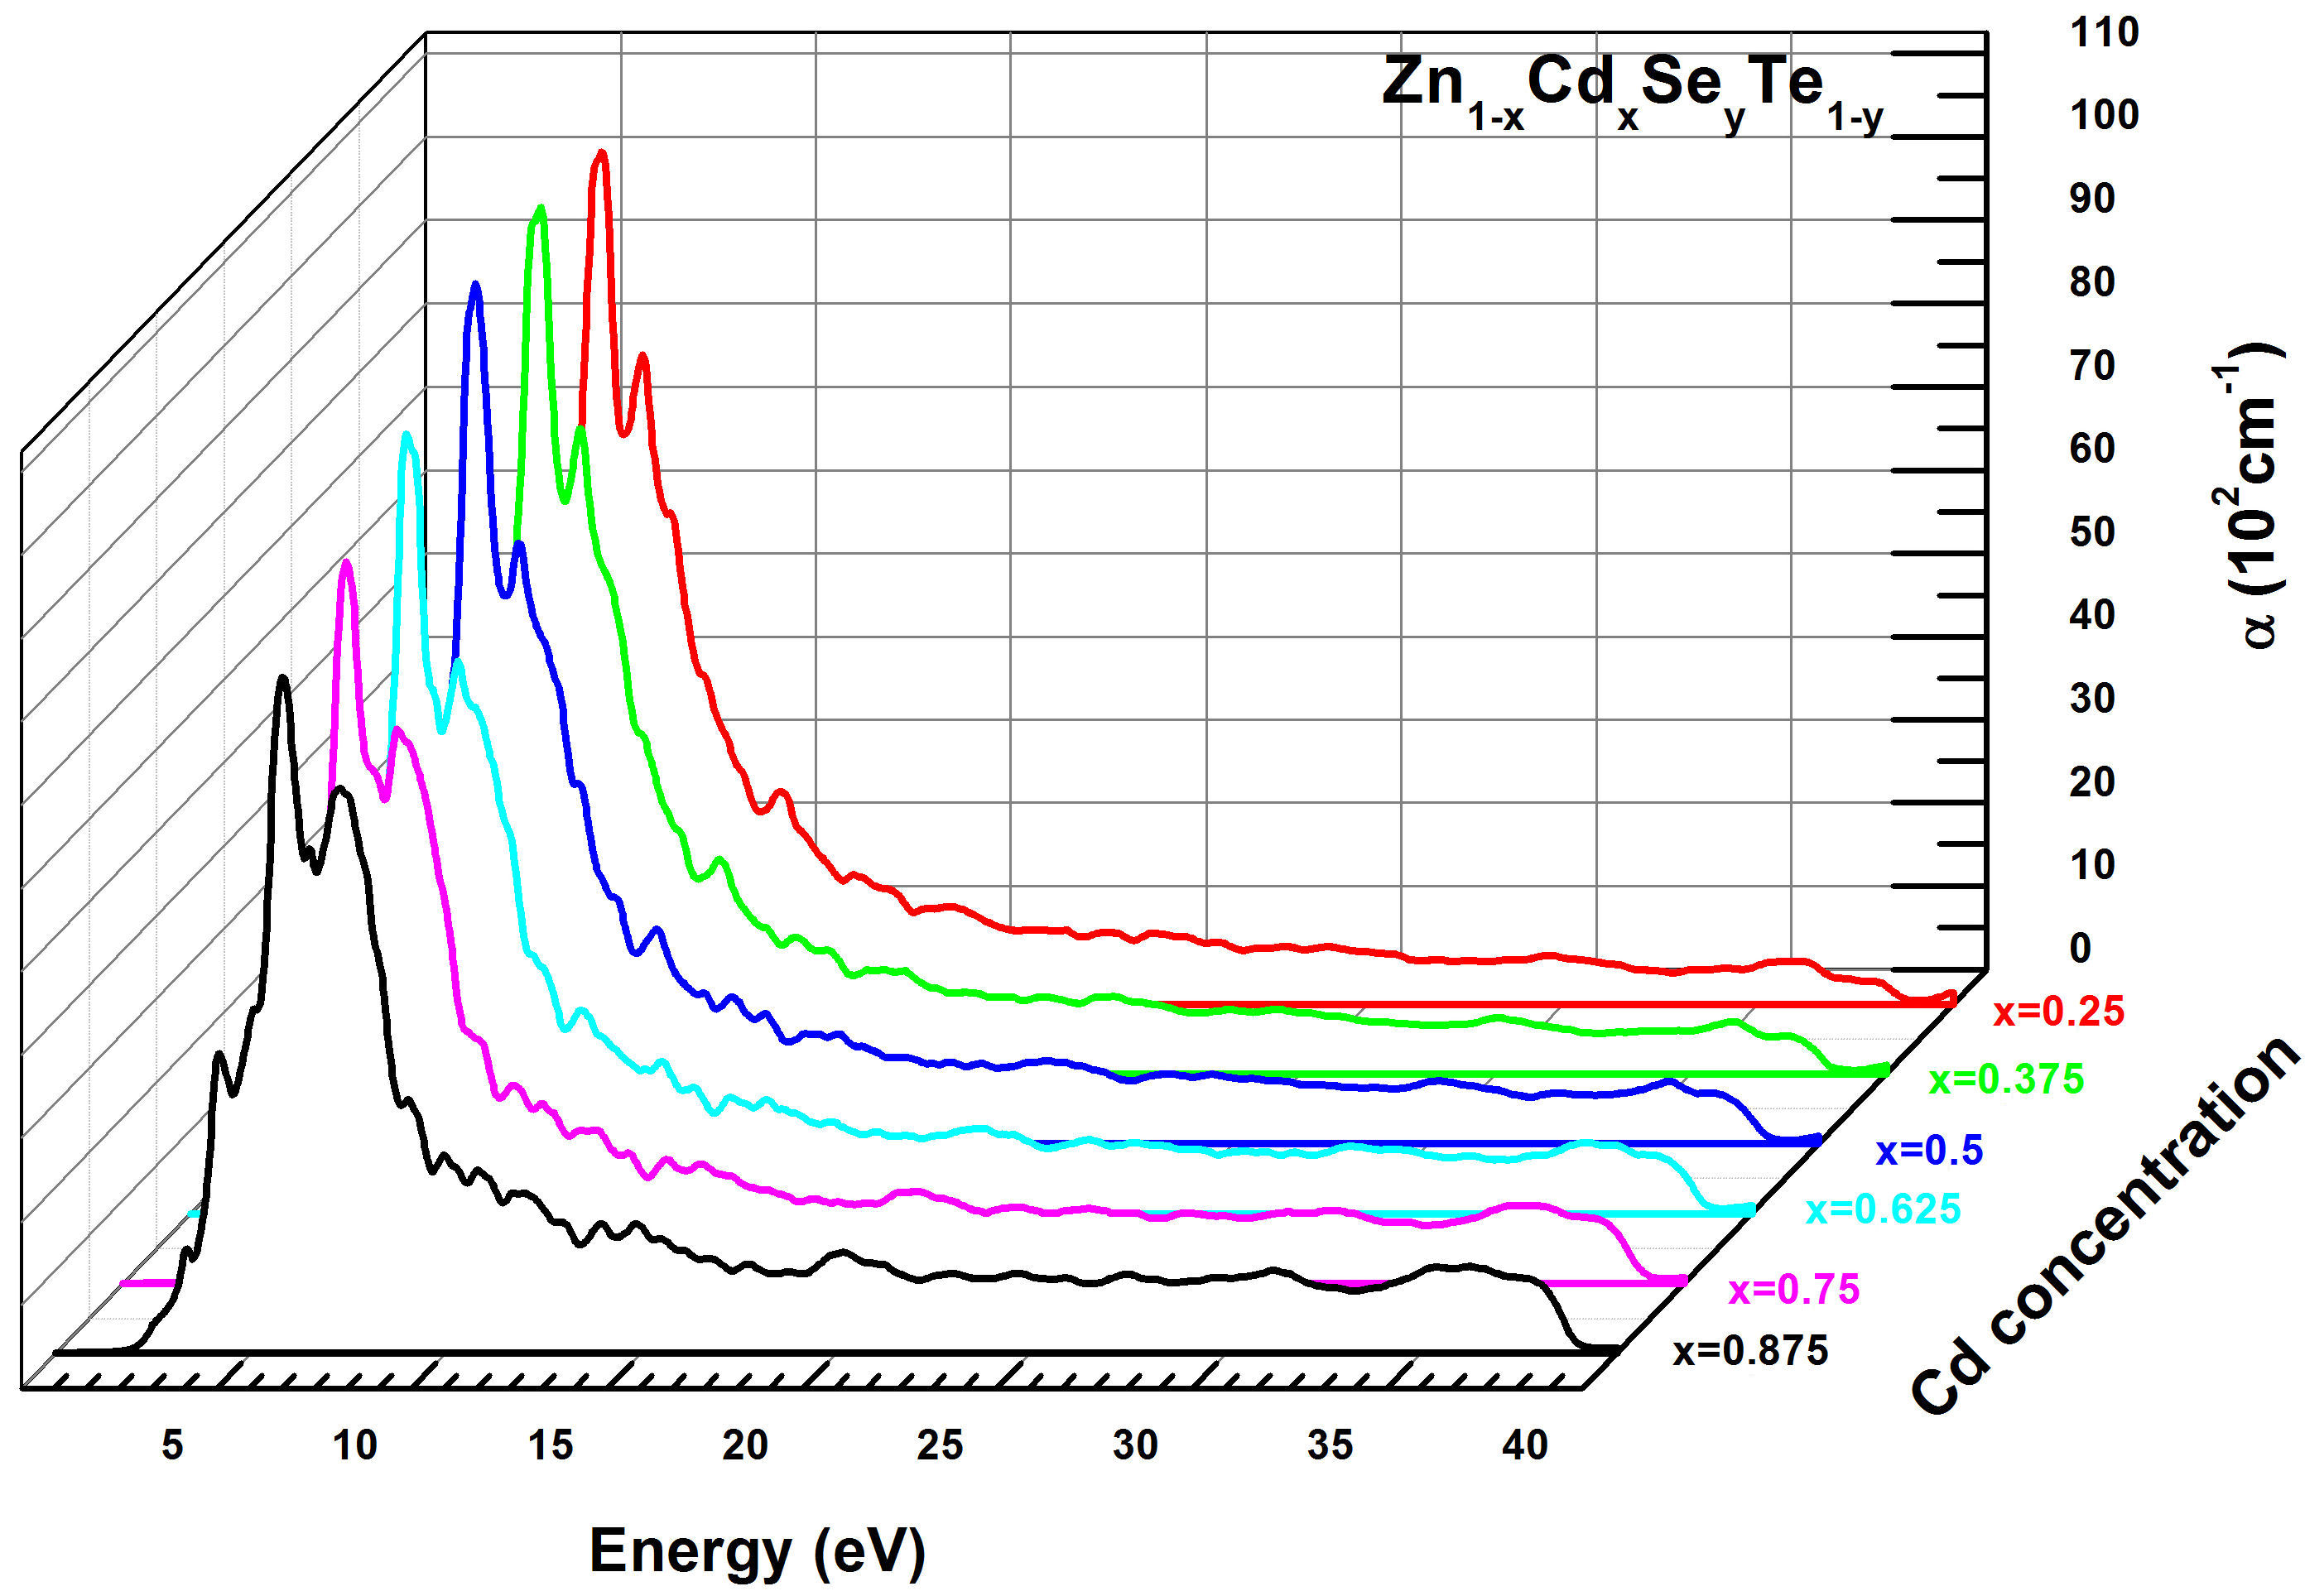
FIGURE 13 Calculated absorption coefficient α(ω) for Zn 1−x Cd x Se y Te 1−y quaternary alloys using TB-mBJ method.
The extinction coefficient k(ω) was determined using the same method and conditions as the refractive index for Zn 1−x Cd x Se y Te 1−y quaternary alloy. Figure 14 exhibits the curves of the extinction coefficient k(ω), which increases quickly in the energy range (2 − 6.5 eV) and decreases for (Eg > 8.0 eV). We note that the maximum values of k(ω) correspond to the minimum values of ε 1(ω) for the same energy interval. On the other hand, we observe that k(ω) is larger in the energy gap around (6 − 10 eV). This is an interesting criterion for the fluorescence phenomenon. The last parameter studied in this paper is the reflectivity R(ω) for Zn 1−x Cd x Se y Te 1−y alloy that was simulated using the TBmBJ method. The corresponding results are shown in Fig. 15, which indicates that the maximum reflectivity R(ω) occurs for photon energy values within a range of (4.2 − 12.0 eV). In addition, R(ω) declines rapidly for higher energy (E > 15 eV). According to the literature, the maximum reflectivity is related to the resonance plasmon that appears in the visible-ultraviolet area.
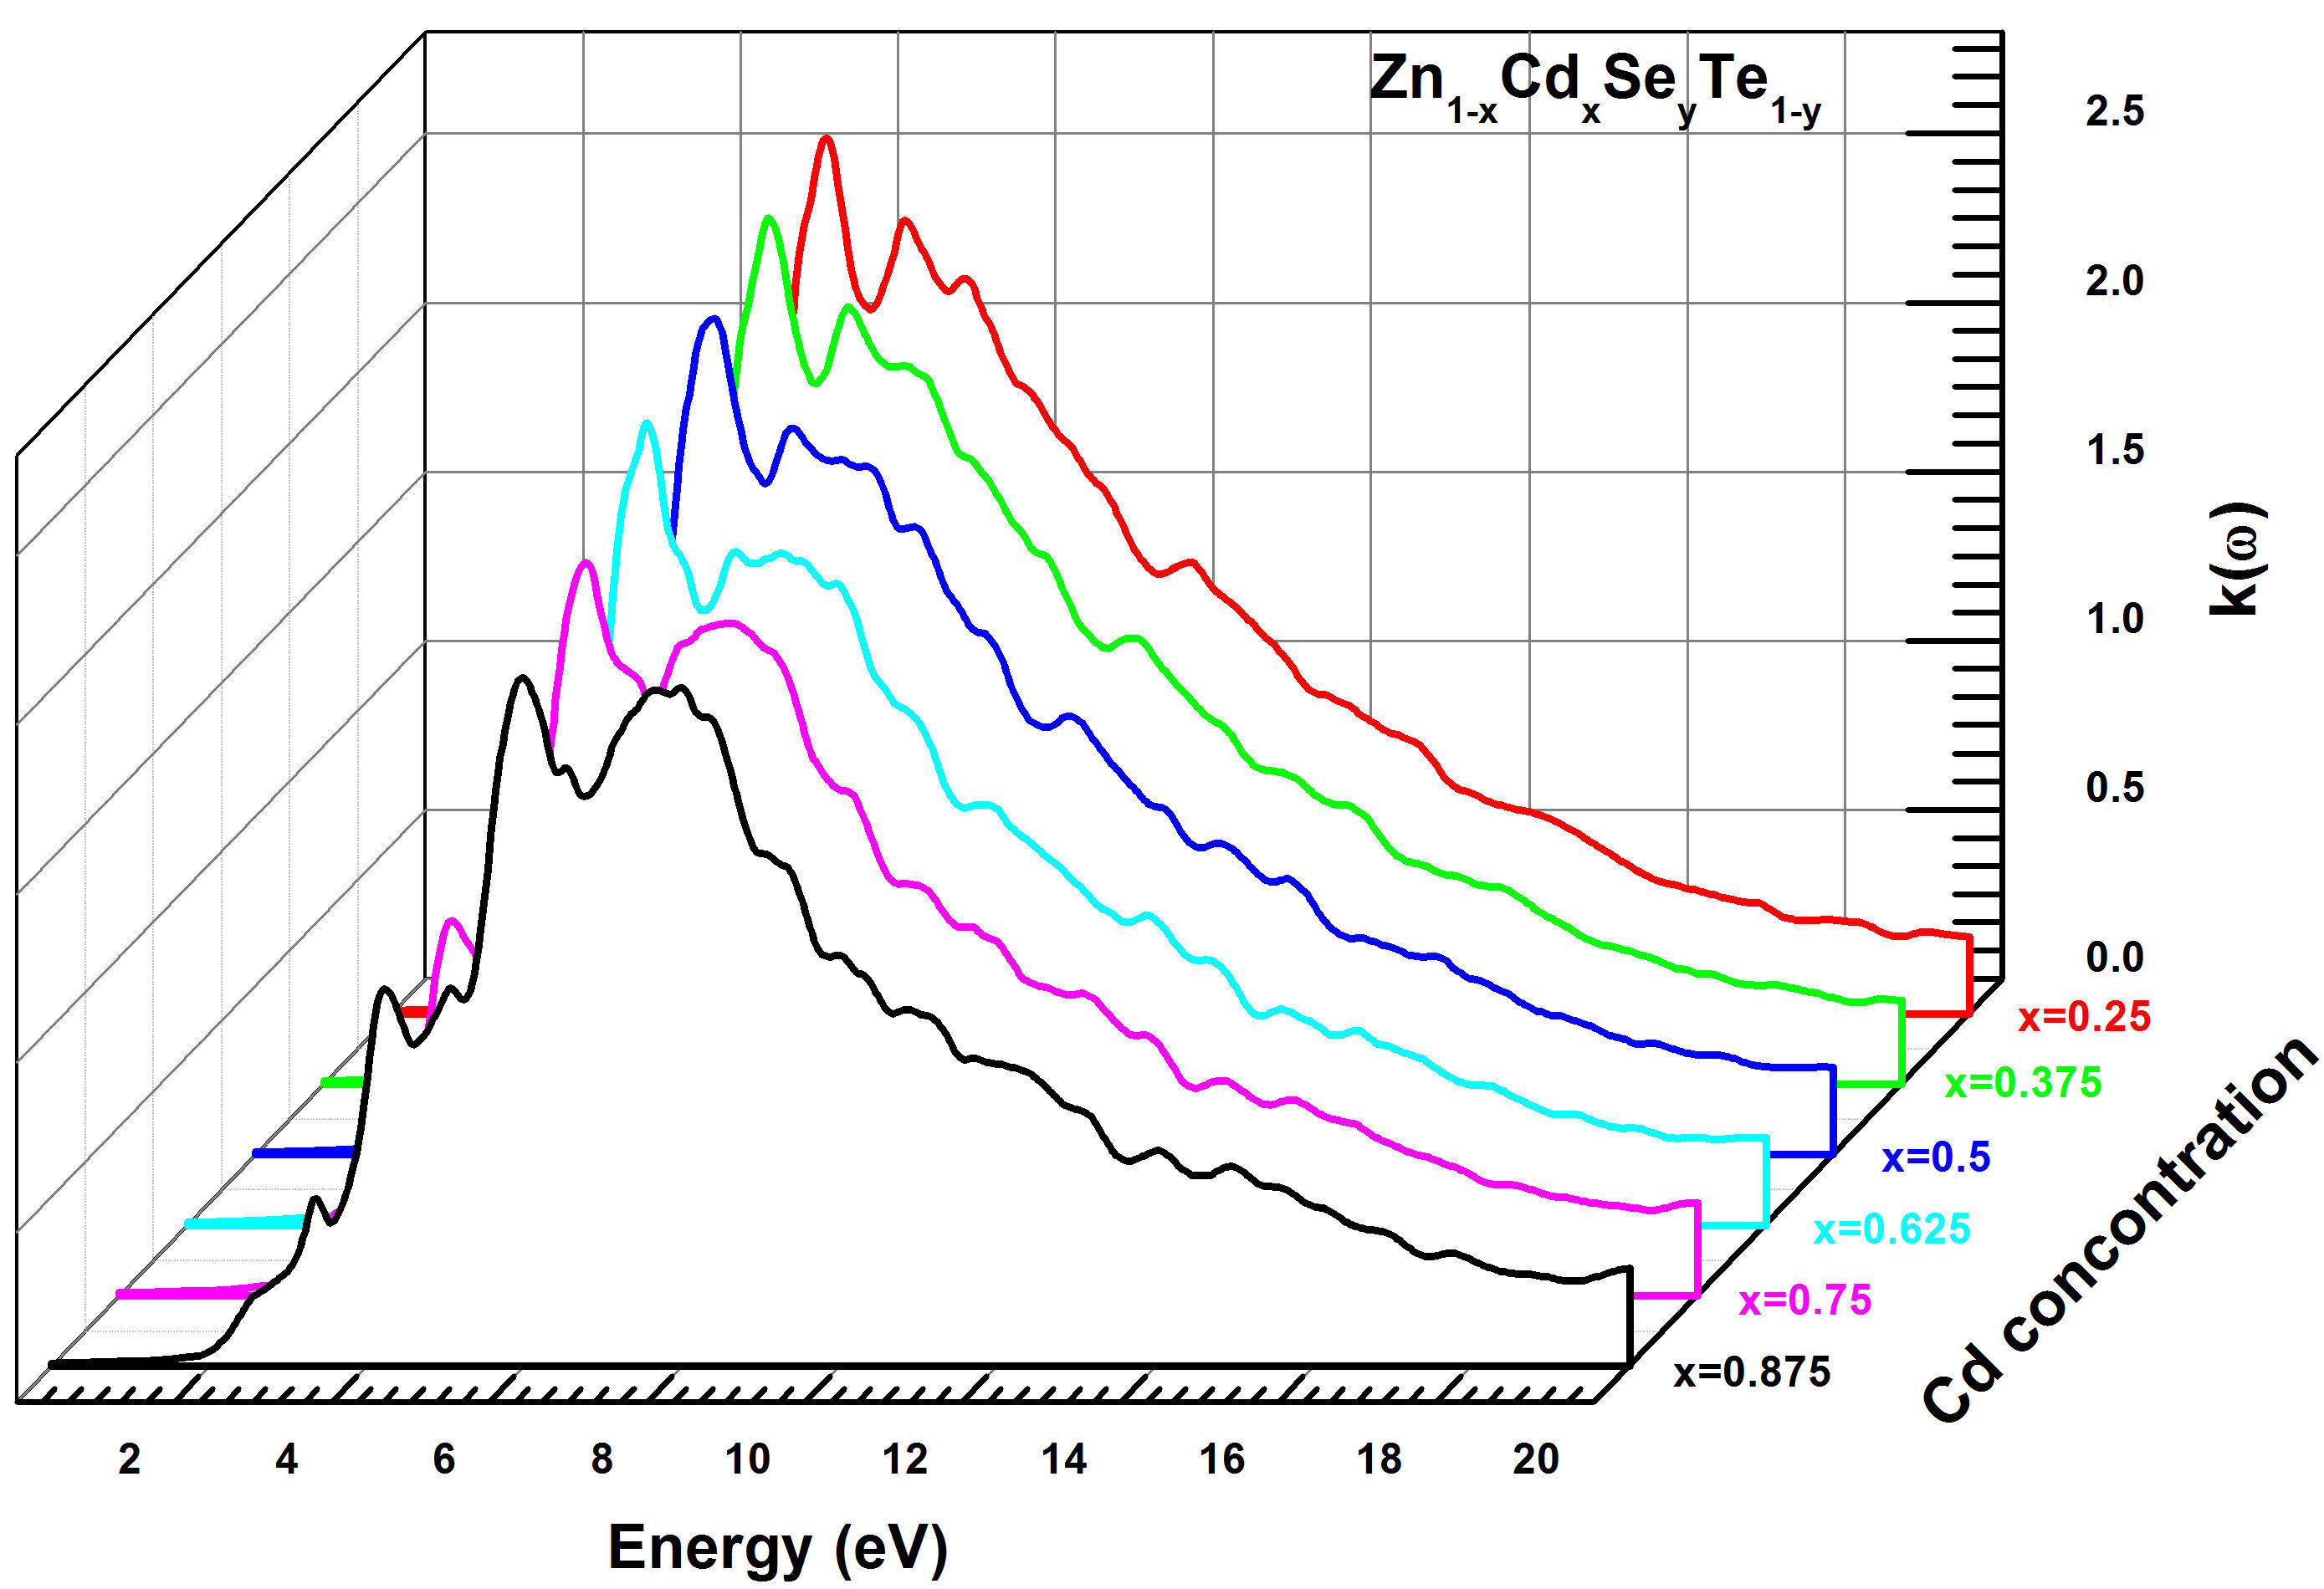
FIGURE 14 Calculated extinction coefficient k(ω) for Zn 1−x Cd x Se y Te 1−y quaternary alloys using TB-mBJ method.
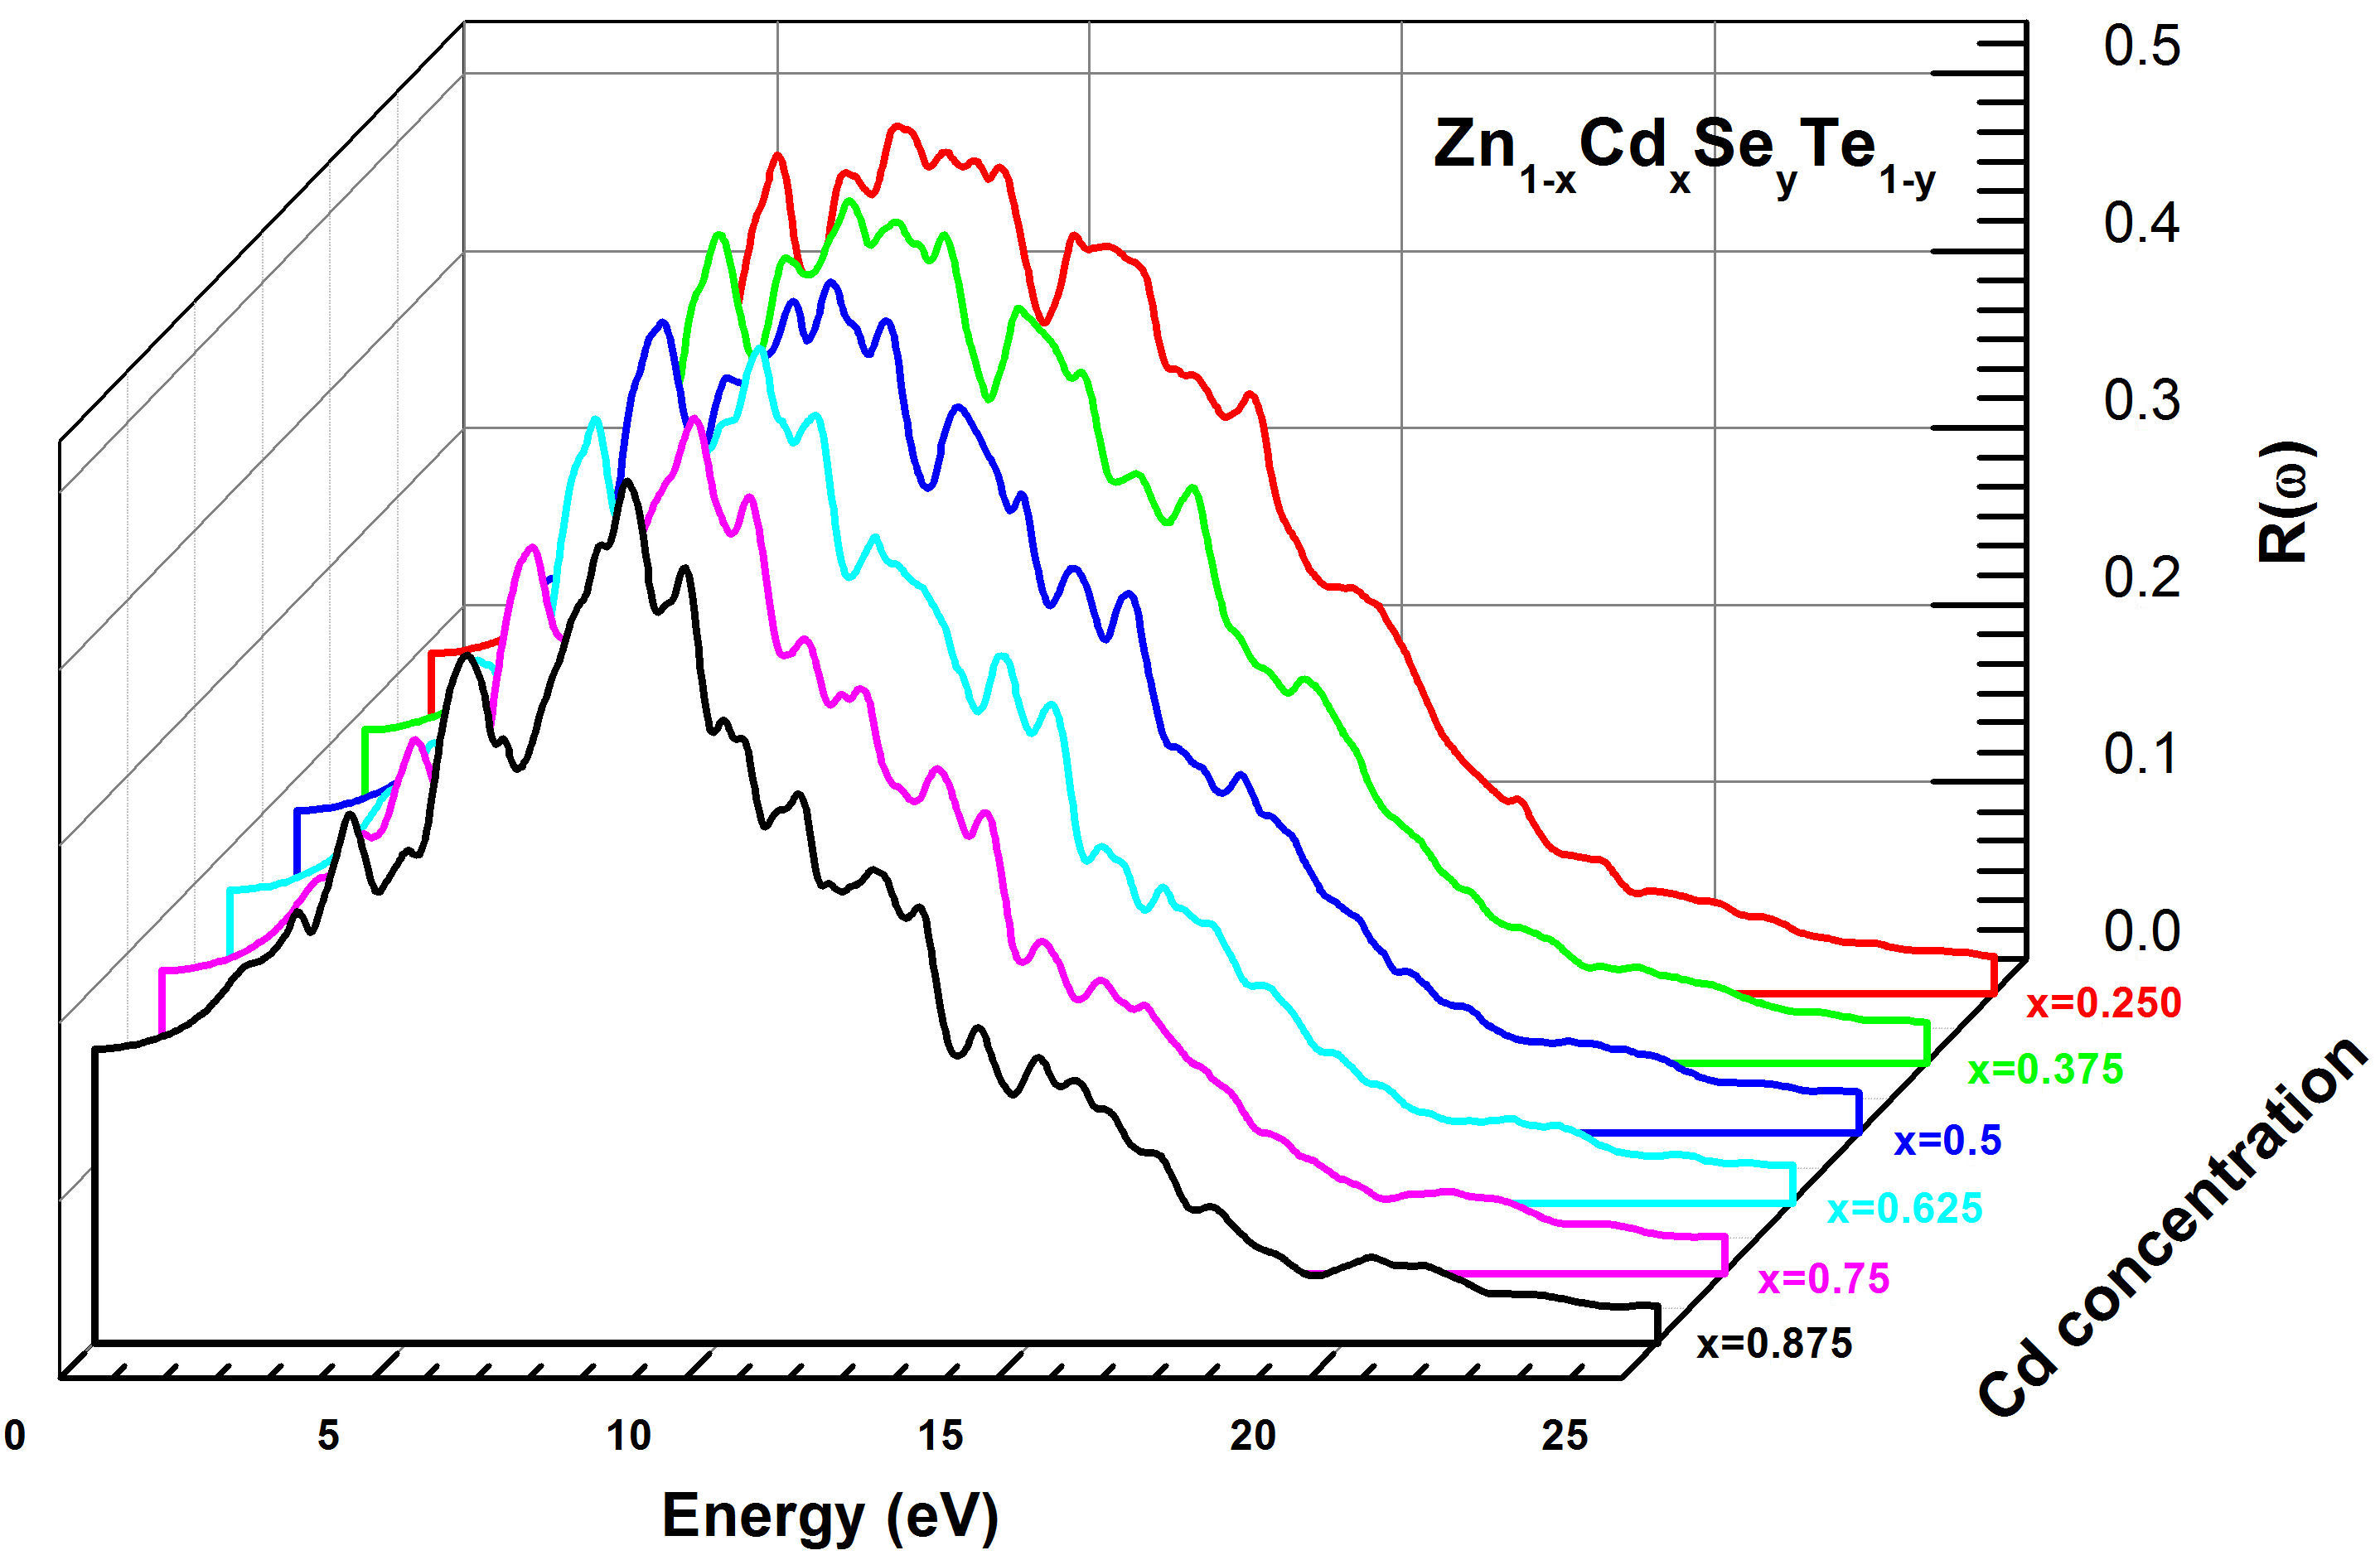
FIGURE 15 Calculated reflectivity R(ω) for Zn 1−x Cd x Se y Te 1−y quaternary alloys using TB-mBJ method.
The referenced work [20] presents many similarities in objectives and methodologies to the present work. Both studied the same quaternary alloy using the Wien2k code with PBE and the approximation mBJ. On the other hand, Vegard’s law and the same principle were used to calculate the optical properties. In our work, an improved (2 × 2 × 2) model cell was chosen, and calculations were performed with PBEsol and the approximation TB-mBJ rather than (1×1×1) model cell, PBE and mBJ method used in [20], respectively. This work uses another range x (0.125 ≤ x ≤ 0.875) for equating the parameter to ZnTe. Globally, the quaternary alloys studied in both works present the same behavior. Our results and those of reference [20] are consistent with each other and have similarities in particular as regards the energy gap Eg(x), real and imaginary part of the dielectric function ε 1(ω) and ε 2(ω), and the refractive index n(ω). Finally, the results obtained in the present paper confirm that ZnTe is a suitable substrate for the growth of zincblende Zn 1−x Cd x Se y Te 1−y quaternary alloys as suggested in [20].
4. Conclusion
To summarize, we have performed the FP-LAPW method within DFT to study the structural, electronic, and optical properties of Zn 1−x Cd x Se y Te 1−y quaternary alloys matched to ZnTe as a function of the Cd composition. For the binary compounds, the computed structural parameters using the GGA-PBEsol approach, as well as the calculated energy gap with LDA and TB-mBJ methods, are found to be in good agreement with experimental data and other previous works. The variation of lattice constant, bulk modulus, and energy gap for Zn 1−x Cd x Se y Te 1−y quaternary alloys on the concentration x(0.125 ≤ x ≤ 0.875) are seen to be almost linear. It should be noted that the direct nature of the bandgap in the binary compounds is well preserved in the studied quaternary alloys. The effects of the Cd concentration and photon energy on the optical properties of Zn 1−x Cd x Se y Te 1−y quaternary alloys were also predicted. Specifically, the refractive index (n) varies linearly and decreases with increasing of Cd concentration. On the other hand, n(ω) change with the variation of the direct bandgap value (Eg) and reaches its maximum value in the energy range (4.5 − 6.0 eV). In addition, the Zn 1−x Cd x Se y Te 1−y quaternary alloys show strong absorption in the energy range (5.0 − 10.0 eV). Moreover, the extinction coefficient k(ω) is larger in the energy gap (6.0 − 10.0 eV), which corresponds to the interval of the minimum value part of the dielectric function ε 1(ω). The obtained results regarding the studied properties of the Zn 1−x Cd x Se y Te 1−y quaternary alloys are found to be reasonable and show that related quaternary is a promising candidate for optoelectronic applications. Our computed results for the Zn 1−x Cd x Se y Te 1−y quaternary alloys should be expected as a reference for future works due to the lack of experimental and theoretical data using the FPLAPW calculations for the quaternary of interest.


 nueva página del texto (beta)


