1 Introduction
In a general term, the stability and/or instability of a star is determined by the magnitude of its adiabatic index
In massive stars, however, electron-positron pairs are produced as a result of high energy photons in their core [1,6-13]. And the energy needed to create the rest mass of these pairs reduce the adiabatic index to less than 4/3 [11], as mentioned earlier. Meanwhile, the different magnitude of the adiabatic index could make the star unstable, or, in general terms, term, the stability of a star is affected by the decrease in its adiabatic index [2]. Once any collapsing star enters the electron-positron pair-production region (Fig. 4), it becomes destabilized by the pair-production through a decrease in the adiabatic index [14]. One significant role of pair-production (inside the core of massive stars) is its effect on the instability and subsequent explosion of the stars, which occur during the advanced nuclear burning stages of evolution. In general, when the abundance of degenerate electrons and positrons in centres of massive stars are comparable to each other, there exists a region (Fig. 4) in the temperature-density plane where the adiabatic index is lower than 1.33. The adiabatic exponents and their derivatives are, therefore, a major event in stellar evolution, ranging from the stellar formation, pulsation, convection to core collapse and supernova explosion. In particular, the adiabatic derivatives (exponent and temperature gradient) measure the thermodynamic response such as the expansion and/or compression, characterized by dynamic instability as well as convection instability of stars [3,15,16]. Similarly, the behaviour of a star after it is adiabatically expanded or compressed depends on the numerical value of the adiabatic index
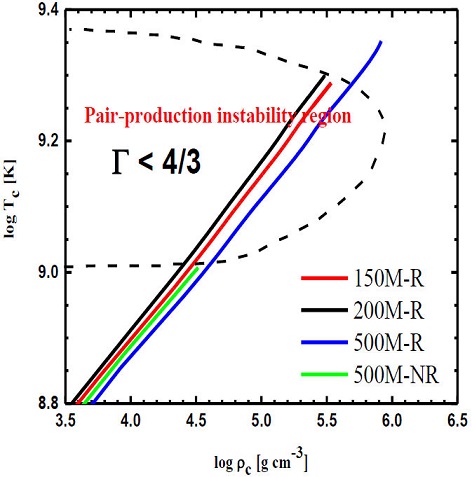
Figure 4 Tracks of rotating 150
This paper is organized as follows: in Sec. 2, we describe the method of the model constructed and numerical input Physics. In Sec. 3 the results of the pair-production adiabatic quantities affecting the massive stars are presented. Finally, Sec. 4 is devoted to summary and conclusion.
2 Methodology and input physical parameters
The progenitor models are taken from the published grids of very massive stellar models computed with a Hydrostatic Geneva stellar evolution code using both rotation and non-rotation effects with Solar Metallicity (SM), Small Magellanic Cloud (SMC) and Large Magellanic Cloud (LMC) [23]. The Geneva code (GENEC) has been used for most massive stars observed today and in recent developments. It includes the prescription for rotation and magnetic fields in it [26]. However, the results of those grids predicted that stellar models for 150
Table I Model properties at the start of pair-production. The properties shown (from left to right) are the initial mass, rotational velocity, metellicity, age, and mass loss. The sixth column corresponds to the final mass, followed by central density, temperature, ZAMS effective temperarure, and luminosity. The rest of the columns are the major contributor of the chemical abundance in central mass fractions from which the pairs are created. Another chemical abundance of less impact is omitted in this table, only for the purpose of simple tabulation.
| M |
Veq Kms-1 |
Zini |
Age × 106 (yr) |
Mass loss |
Mfin |
ρc [g cm-3&93: |
Tc [K] |
Teff [K] |
L |
Γedd |
12C × 10-2 |
14N × 10-22 |
16O × 10-01 |
20Ne × 10-02 |
|---|---|---|---|---|---|---|---|---|---|---|---|---|---|---|
| 150 | 102.54 | 0.002 | 3.20 | -4.06 | 107 | 4.51 | 9.02 | 5.34 | 6.80 | 0.91 | 6.45 | 0.00 | 8.18 | 9.57 |
| 200 | 063.46 | 0.002 | 2.89 | -4.19 | 129 | 4.39 | 9.01 | 5.32 | 6.89 | 0.92 | 6.13 | 6.47 | 8.12 | 9.88 |
| 500 | 000.06 | 0.006 | 2.39 | -4.22 | 75 | 4.60 | 9.01 | 5.38 | 6.63 | 0.88 | 7.62 | 0.44 | 8.19 | 8.50 |
| 500 | 000.00 | 0.006 | 2.18 | -4.29 | 95 | 4.49 | 9.00 | 4.84 | 6.78 | 0.97 | 7.19 | 3.51 | 8.18 | 8.58 |
We use an electron-positron equation of state (EoS) table that computes the thermodynamic properties of the fundamental species such as electrons and positrons. The input of the routines are the central mass fractions of the individual compositions, the average charge per isotope and its average nucleons number, under a particular central temperature (K) and density (g cm-3). The result of this routine gives rise to many physical properties ranging from pressure and specific thermal energies to adiabatic quantities like adiabatic index and specific heat capacities of the species involved. The equation of state chosen for this work is HELM-EoS which is developed and described by Timmes and Swesty [28]. This choice of EoS is made due to its accuracy, speed and thermodynamic consistency [28,29]. We modelled this EoS such that the central mass fractions of the 14 isotopes are read one after the other with their respective and individual mean nucleon number, mean charge per isotope at a particular central temperature and density as input quantities in the EoS routines.
3 Results and discussion
In Table I, the Eddington limit
There are several factors that affect these values, for example, in Fig. 1 the Eddington factor in rotating models depends on the metallicity of the star such that increasing the metallicity reduces the
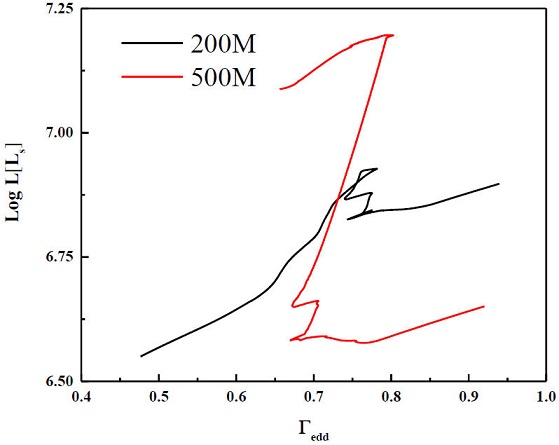
Figure 1 Eddington parameter for rotating 200
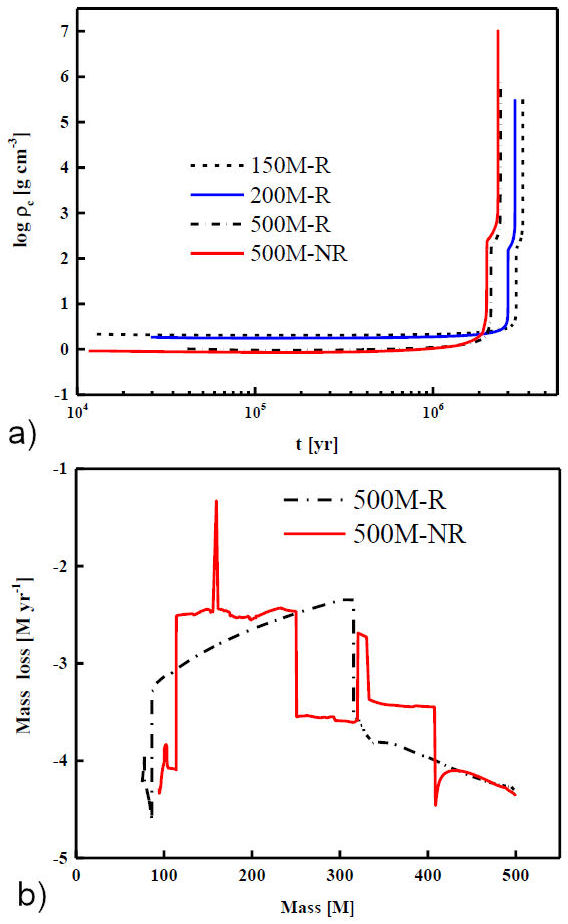
Figure 2 Top panel shows the time evolution of the central density with time in a year, for the models (under consideration). The dotted line is for 150
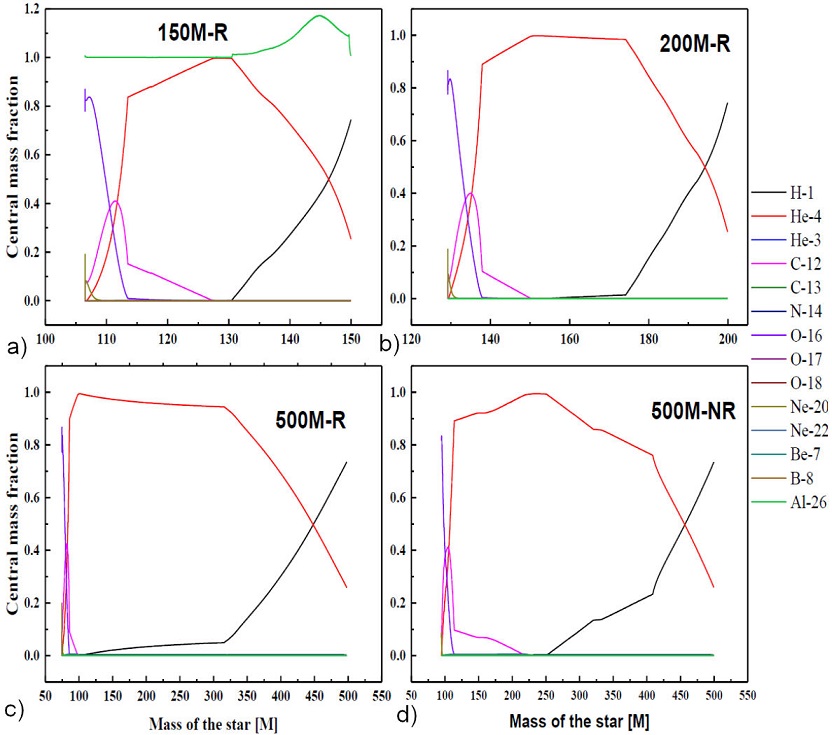
Figure 3 Chemical abundance within the center of 150
In Fig. 4, the evolution of the central density and temperature of the models is shown. The region enclosed by dashed-line represents where the adiabatic index is less than 4/3. When enough mass of star lies inside this region, it becomes unstable. All the models under consideration became unstable and the instability proportionally increases within the pair-production region. The non-rotating model experienced the least instability by raising to a maximum central temperature
In the center of massive stars, many processes occur, particularly, at a high temperature and relatively low density. One such important process is the photon disintegration into electron-positron pairs when the photon energy (hv) is higher than the rest-mass energy of the pairs
Table II Adiabatic quantities at minimum and maximum temperatures in the center of massive stars with respect to selected isotopes which remain after production of electron-positron pairs. The R and NR represent rotating and non-rotating models, respectively.
| Adiabatic Quantity |
13C | 18O | 8B | |||||||||
|---|---|---|---|---|---|---|---|---|---|---|---|---|
| 150 |
200 |
500 |
500 |
150 |
200 |
500 |
500 |
150 |
200 |
500 |
500 |
|
| Cv | 1.91E4 | 1.94E4 | 3.30E03 | 2.58E4 | 3.08E4 | 3.93E4 | 7.80E3 | 2.96E3 | 6.26E14 | 9.52E14 | 1.12E15 | 5.40E15 |
| 1.80E4 | 1.89E4 | 2.93E3 | 2.52E4 | 2.89E4 | 3.82E4 | 6.85E3 | 2.91E3 | 5.85E14 | 9.25E14 | 9.78E14 | 5.30E15 | |
| Cp | 1.65E12 | 1.93E12 | 8.88E10 | 2.04E12 | 2.53E12 | 3.99E12 | 2.42E11 | 5.91E10 | 7.37E22 | 1.35E23 | 9.95E22 | 5.96E23 |
| 1.67E12 | 2.19E12 | 1.43E11 | 1.97E12 | 2.68E12 | 4.49E12 | 3.64E11 | 5.88E10 | 6.03E22 | 1.19E23 | 7.14E22 | 5.58E23 | |
| γad | 1.23 | 1.23 | 1.24 | 1.23 | 1.23 | 1.23 | 1.23 | 1.25 | 1.22 | 1.23 | 1.23 | 1.24 |
| 1.28 | 1.28 | 1.30 | 1.23 | 1.28 | 1.28 | 1.30 | 1.25 | 1.28 | 1.30 | 1.28 | 1.23 | |
| Δad | 1.30 | 1.31 | 1.31 | 1.31 | 1.30 | 1.31 | 1.31 | 1.31 | 1.30 | 1.31 | 1.30 | 1.31 |
| 1.27 | 1.27 | 1.28 | 1.31 | 1.27 | 1.27 | 1.28 | 1.31 | 1.27 | 1.27 | 1.28 | 1.31 | |
3.1 Heat capacities
The heat capacities of the progenitor models are found to decrease when the central temperature and density increases within the pair-production region. Thus, the central temperature required for the explosion and collapse of the massive star is only achieved at a small amount of heat within the pair-production region. In the following sections, the dynamics of heat capacity in all the considered models under consideration is discussed.
3.1.1 150
The heat capacity in the pair-instability region is independent of the composition. In Fig. 5, the behaviour of the heat capacity with respect to constant pressure in the instability region is demonstrated. At the onset of the pair-production, the compressed star speedily rise the temperature of the instability region until it starts to produce more electron-positron thermal energies. As a result of this, the region becomes completely disturbed by many thermal processes and the quantity of heat required to raise the temperature slowly reduce the density of the pair-production. The manifestation of this dynamics is that the star cools down immediately after the pair-production is ignited by subsequent neutrino energy-loss which induces the explosions.
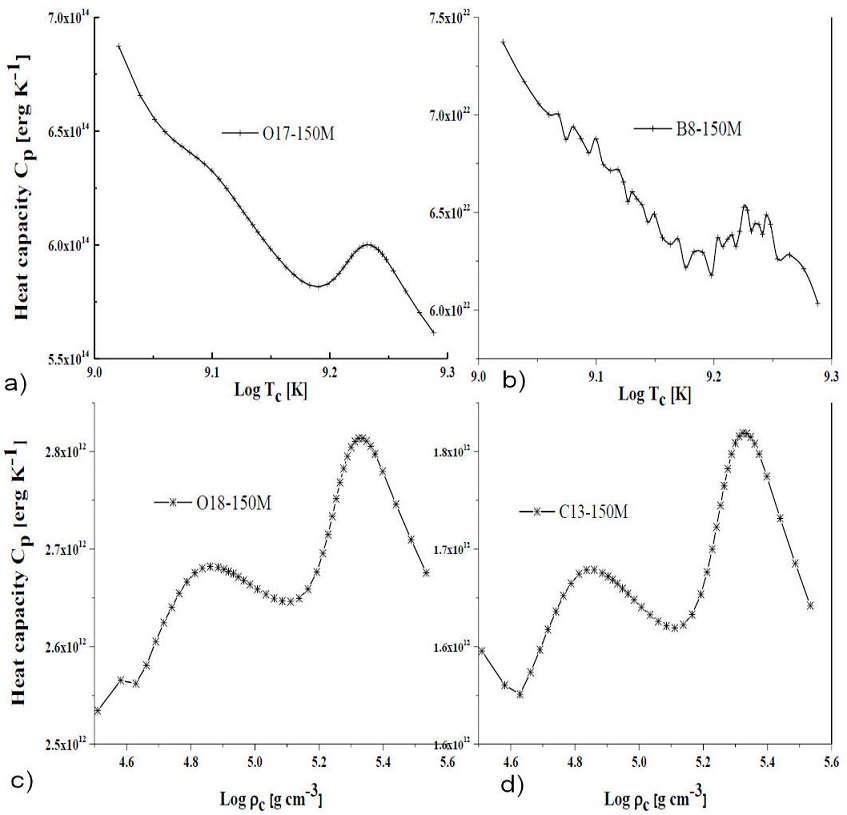
Figure 5 Heat capacity at constant pressure due to pair-production for the 150
3.1.2 200
While the heat capacity at constant volume shows similar dynamics for different central mass fractions, it, however, differs in magnitude. In Fig. 6 the heat capacity with respect to temperature and density is shown over different central mass fractions.
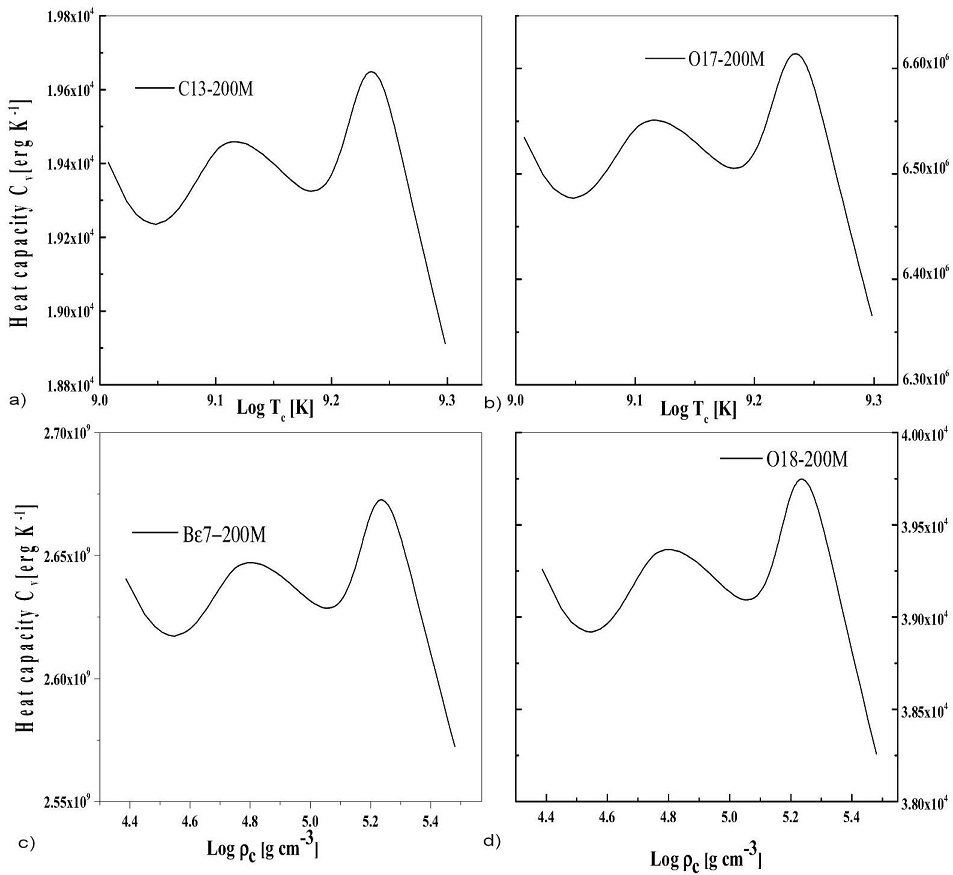
Figure 6 Heat capacity at constant pressure due to pair-production for the 150
However, it is observed that the quantity of heat required to raise a unit temperature necessary for the pair-production is very small. This also follows the same physical argument with the previous 150
3.1.3 500
The heat, at constant volume and pressure, is, however, independent of the chemical abundance within the instability region, and is steadily uniform at the final mass of the explosion. In Fig. 7 and 8, the manifestation of this physical behaviour is shown. These figures compare the rotating and non-rotating models. The rotation affects the nucleosynthesis of the stellar evolution, and in the pair-production region, temperature and density play key roles in the instability of the region. The nuclear burning affects not only the heat capacity, but the rotatios as well.
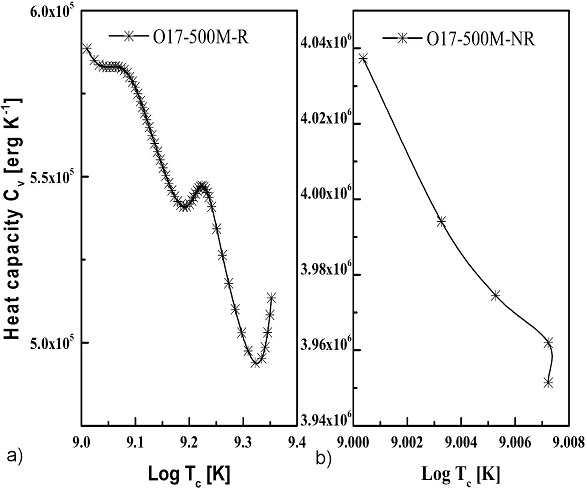
Figure 7 Evolution of specific heat capacity with the temperature at constant volume for rotating (left) and non-rotating (right) 500
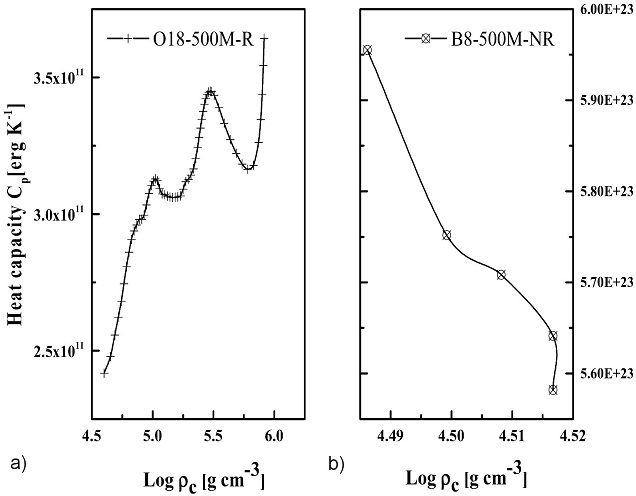
Figure 8 Evolution of the specific heat capacity with density at constant pressure for rotating (left) and non-rotating (right) 500
In Fig. 9, it can be seen that, as the mass loss increases in the rotating models, the heat capacity slows down so that it induces the central temperature and density for the production of the pairs and subsequent annihilations and explosion of the stars. The non-rotating model experienced greater heat capacities and has the lowest mass loss which led the star further away from the pair-production region. This also confirms that the non-rotating models are not good for pair-production, due to the fact that most of the mass of the non-rotating model is lost to heat, and therefore the star must collapse before it explodes.
3.2 Adiabatic index
The adiabatic index
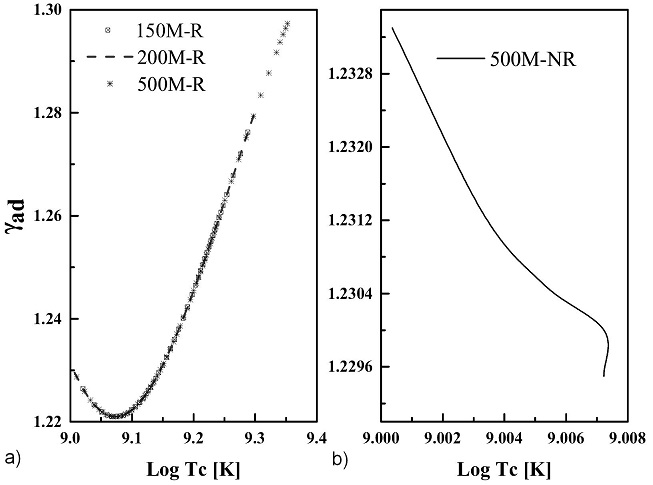
Figure 10 Effects of pair-production instability on the adiabatic index. The M represents the mass of the star in
This adiabatic index is, however, related to dynamical stability of stars. It describes whether the star is dynamically unstable when the pressure average of
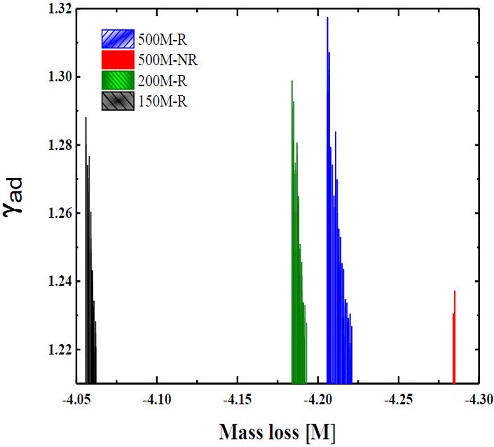
Figure 11 Adiabatic index with respect to a mass loss for 150
However, the final mass of a star reduces the adiabatic index within the region such that the star could finally explode as PISN. In Fig. 10, the effects of the electron-positron pairs, in which the adiabatic indices are less than 4/3 are plotted as a function of temperature, within the instability region. in the figure, we show that the adiabatic index due to the pair production is almost independent of the nuclear burning taking place in the instability region, as predicted by Rakavy and Shaviv [12]. This adiabatic index which represents the pressure derivatives creates disturbance in the region and is fundamentally positive with temperature for all the rotating models but negatively decrease in the case of the non-rotating, as can be seen in Fig. 11. This scenario, in the rotating model, keeps the instability in the region and the star produces more pairs which later annihilate into neutrinos. Therefore, the pair production leads to a dynamical instability which is responsible for the rapid explosion of the star immediately after the production of the electron-positron pairs. Meanwhile, the sudden decrease of the adiabatic index in the non-rotating model and its quick collapse is basically due to its low mass loss and less oxygen core mass that is necessary for the pair production.
3.3 Adiabatic temperature gradients
The temperature gradient
4 Summary and conclusion
It was predicted that 150 and 200


 nueva página del texto (beta)


