1 Introduction
Since the 1970s sources of entangled photon pairs are an important pillar in quantum optics. On the one hand they enable to probe the foundations of quantum mechanics and, on the other, they are a cornerstone in the development of novel quantum technologies. Time-correlated photon pairs were firstly generated by inducing spontaneous parametric down conversion (SPDC) in non-linear crystals [1]. This was subsequently followed by observing quantum entanglement for the first time in photons emitted by atomic gases subjected to a four-wave mixing (FWM) process [2]. In addition to serving a broad span of basic research during several decades, experimental methods based on these two non-linear processes play an important role in the second quantum revolution, the on-going development of technologies that is set to change - even - daily life paradigms [3].
With SPDC, researchers have invented techniques yielding an outstanding feedback between science and technology. Several of those methods are now the platform for both exploring the laws of quantum physics and for developing applications of quantum optics such as cryptography and metrology [4]. The role of FWM as a main character in quantum optics and its applications is spread in history. After subsequent experiments establishing methods for testing the Bell inequalities [5], this non-linear process attracted back major attention after the proposal by Duan, Lukin, Cirac and Zoller for building a quantum repeater based on atomic gases [6]. Such repeater has not yet been achieved, however, the challenging quest for it has engaged researchers in the development of long-lived and efficient quantum memories [7,8], and the generation of photon pairs that can - in principle - be tailored by means of the exquisite control over the atomic states provided by precision spectroscopy.
Motivated by the creation of hybrid quantum systems [9,10], time-correlated photon pairs were generated from cold atoms in a seminal work by Kuzmich et al. [11]. Their potential as a narrowband source of photon pairs suitable for interacting with atoms and thus, for creating quantum systems, was thereafter demonstrated [12]. In this context, it is desirable to generate photons that can excite specific dipole lines connecting predetermined atomic states, and to generate photons in the telecommunications regime. In this way, one would be able to imprint information into a quantum memory and simultaneously send it far away through optical fibers. In principle, this can be achieved with several diamond schemes of transitions within the rich electronic structure of the alkali elements [13] (see Fig.1).
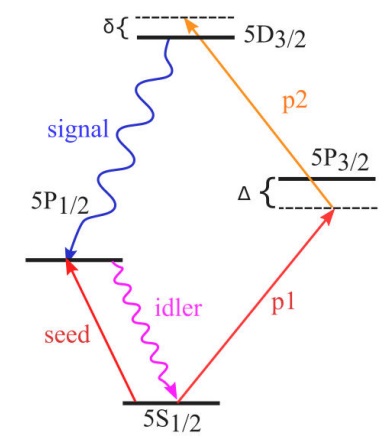
Figure 1 Simplified schematics of the FWM diamond configuration implemented in our experiments. It involves a ladder transition followed by a cascade decay in the
Photons generated by FWM in laser-cooled atoms have naturally a bandwidth comparable to the decay rate of their states (in the order of a few MHz). Using electromagnetically induced transparency it is possible to achieve bandwidths below one MHz [14]. A bandwidth of 20 MHz has been reached by inducing FWM on the diamond scheme without optically filtering the generated light [15]. It can be further narrowed below 8 MHz by introducing a resonant cavity [16]. In setups of this kind, it is possible to generate photonic Bell states; entanglement of linear momentum [17,18] and orbital angular momentum [19] has also been observed between the signal and idler counterparts. These states are directly related to the atomic degrees of freedom and the dynamics induced by the FWM process. Therefore, they are controllable with the characteristics of the laser beams pumping the non-linear process.
Within this context, we present our experimental setup for generating photon pairs from cold atoms as well as measurements of the coherence of the photons to show that it is, indeed, a narrowband and bright source of non-classical light. The remainder of this article is organized as follows. In Sec. 2 we describe a theoretical framework of FWM in atoms, from which the phase matching conditions are derived. This is followed by a model of the cascade decay useful in the description of the generated bi-photon state (Sec. 3). Next, in Sec. 4, we describe in detail the experimental setup. There, we emphasize basic concepts of the applied methods, and describe technical aspects particular to our machine and its essential experimental protocols. In Sec. 5 we show the experimental results and their analysis. From their second-order crossed-correlation function we estimate the coherence time of the idler as heralded by the signal photons. With this time we compute the spectral brightness of our source for typical experimental conditions. Following that, we verify the chaotic time statistics of the signal and idler photons in terms of the corresponding auto-correlation measurements. We then use both results to evaluate the Cauchy-Schwartz inequality, showing a strong violation. Finally, in Sec. 6, we conclude the reported work and give an outlook toward our research interests.
2 Four-wave mixing in atoms
Four-wave mixing is possible in center-symmetric media, such as an atomic gas. Figure 2 illustrates its implementation in a cold atomic gas within a magneto-optical trap (MOT). The pump beams
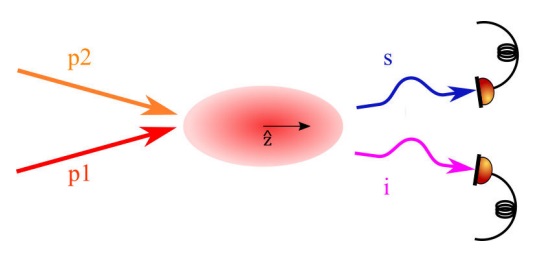
Figure 2 Generic schematics of FWM in cold atomic gases. Two pump beams,
The stimulated atomic transitions come along with isotropic spontaneous parametric emission of photons. However, a proper phase relationship between the interacting waves guarantees constructive addition of the amplitude contributions from different locations and emission times inside the atomic gas. Both processes can be described in terms of the electric susceptibilities: isotropic spontaneous emission in terms of first order susceptibility
inside the material. In this case the polarization acts as a source of quantum light at the signal or idler angular frequencies (
with
where
In the interaction picture, the relevant effective Hamiltonian of the atomic system, whose properties are encoded in the susceptibility
here
for linear momentum and
for energy. Equation (5) relates the direction of the generated photons with that of the pump beams. In this case all are co-linear.
3 Coherence of the generated quantum states
The time statistics of the photon pairs can be evaluated with the second-order correlation function
which describes the probability of a pair of photodetection events with
The second-order correlation function may be built from the spontaneous decay of a single atom from a second excited state [21]. Although this model does not account effects yielded by the ensemble, it has turned out useful for investigating the generated time-frequency entanglement within the cascade emission scheme [31] and it is useful to make a basic coherence analysis of the generated quantum states, see Section 5.
For a cascade decay of a single atom, resulting in a two-photon state
where
is the transition amplitude from the two-photon state
In the next paragraphs an expression of
3.1 Heralding effect
For quantum information applications, it is important to know when a single photon is likely to be detected. Photons emitted in cascade facilitate this due to the intrinsic delay between photons of each pair. This can be evaluated from their second order correlation function which can be calculated by solving the evolution equation of the atom, idler and signal electromagnetic field state,
Instead of solving the Maxwell-Bloch equations, we assume a simplified scheme where just the atomic states participating in the cascade transitions are involved [21]. This scheme considers a single atom, it does not describe the pumping procedure, and incorporates the electromagnetic environment effects on the atomic states through the decaying rates. The relevant atom- electromagnetic field state is expressed as
For the FWM configuration in Fig 1, the first term of this equation corresponds to the atomic second-excited state
where
are the analogous to Rabi frequencies for single photons; they are defined in terms of the dipole transition matrix element
One can solve for the coefficients
is obtained. The decay rate
From the first equation
is obtained trivially. The second coefficient
is readily derived by inserting this solution into the corresponding equation and integrating; plugging this solution of
the other two coefficients vanish,
The probability amplitude given by Eq. (9) can now be evaluated for the asymptotic steady state
Assuming a continuous vacuum spectrum, the correlation amplitude
with
where
where
and
In Eq. (20
with amplitude
and
This treatment involves a single atom, it does not account for collective effects. However, corrections to this scheme can be estimated from effective decay rates [24] as described in 4.2.1.
4 Experimental setup
Two laser frequencies are required for cooling atoms and another three different frequencies are employed to induce FWM in the atoms. All of them are stabilized by common saturation absorption spectroscopy techniques. The core of this setup is a standard MOT of
4.1 Laser system
As shown in Fig. 3, the laser system is built in a modular fashion. Each gray box represents an optical arrangement that has been setup on a breadboard made of granite with the optical posts attached to it with instant glue. As reported in [25], we found this to be a convenient solution because it allows building compact optical setups that remain stable for years.
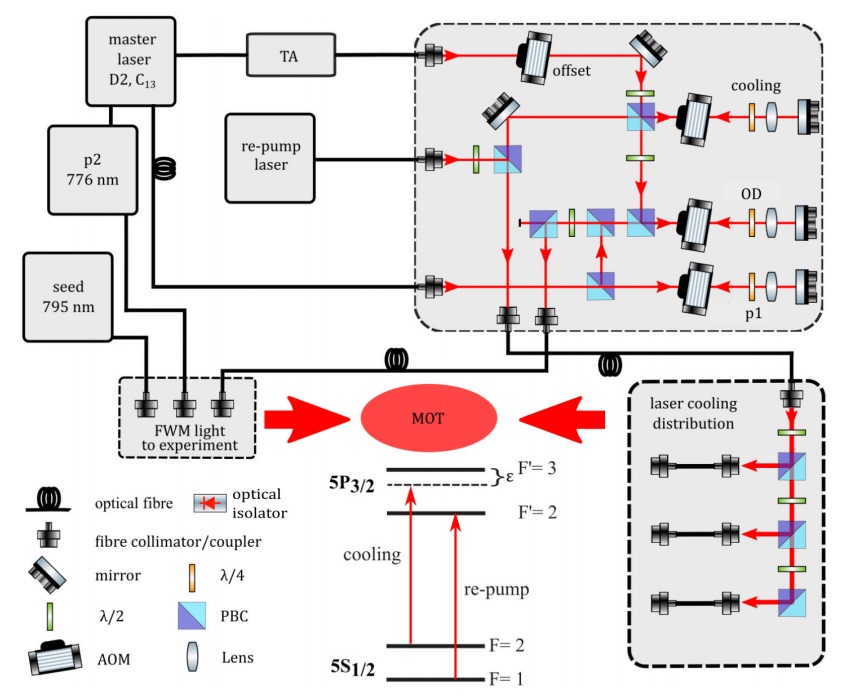
Figure 3 Block diagram of our experiment. The master laser is located at the left, top corner. It delivers frequency-stabilized light to seed our tapered amplifier (TA) for laser cooling, a small portion of its light is further tuned to prepare the
The master laser is located at the left, top corner of Fig. 3. It emits light locked to the crossover between the 5S
4.1.1 Two-photon spectroscopy
The
Figure 4a) shows a schematics of our two-photon spectroscopy setup. About 3 mW of the master laser light is delivered to it through the optical fiber IF. The frequency of this beam is shifted by
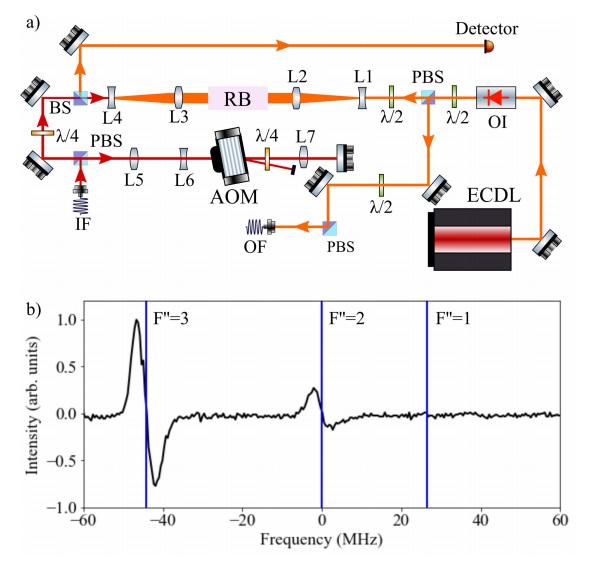
Figure 4 Schematics of the two-photon spectroscopy setup a) and error signal obtained with it b). The red beam depicts light at 780 nm for exciting the first step of the ladder; the orange beam represents the second photon, at 776 nm. IF indicates the input fiber of the 780 nm beam and OF indicates the output fiber of
as required for saturated absorption spectroscopy. This beam is then sent through the cell as the pump with horizontal polarization.
The p2 light is generated by a cateye ECDL [29] (MOGLABS, CEL002). Its frequency is scanned across all the hyperfine levels of the 5D
Modulating the frequency of the pump beam also modulates its interaction with atoms inside the spectroscopy cell. This facilitates to derive the saturation signal assisted with a servo-loop circuit and a low-pass filter [30], yielding a 20 mV peak-to-peak error signal in this case. This is a factor of 15 smaller than typical traces probing D lines with saturation absorption spectroscopy. Heating the spectroscopy cell enhances the obtained signal, making it suitable for locking a laser with standard electronics. Two power resistors of 10
4.2 Vacuum system and MOT
As depicted in Fig. 5, the vacuum system has six elements only. Its simplicity grants full optical access and enables to reach ultra-high vacuum (UHV). The science cell (1) is an octagon made of quartz with windows anti-reflection coated for 780 nm light. The top and bottom windows have a 1.375 in diameter whereas the diameter of the lateral windows is 1 in. This cell is connected to a CF30 cube that holds all the vacuum system (2). Its vertical branch runs upwards towards a hybrid ion-sublimation pump [NEXTorr D 100-5, (3)]. Lastly, (Fig. 4) is a tee connecting a four-conductor feedthrough (5) and a UHV valve (6). The feedthrough connects independently two Rubidium dispensers and the valve is used for plugging the system to a pumping station for building vacuum from atmospheric pressure. With this system it is possible to reach pressures below 10
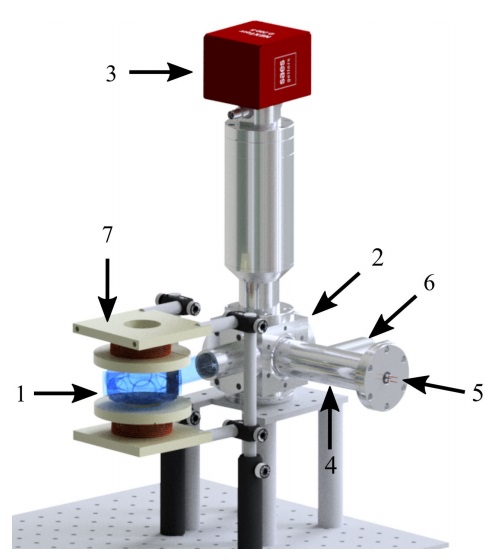
Figure 5 Render of our vacuum system. The components are: (1) science cell, (2) CF30 cube, (3) vacuum pump (NEXTorr D 100-5), (4) tee, (5) feedthrough for Rubidium dispensers, (6) UHV valve and (7) MOT coils.
Figure 5 also shows the MOT coils (7). They have 13 layers, with 9 windings each, of 13 AWG wire. The coil formers were 3D printed and designed to preserve full optical access to the science cell. Once arranged in an anti-Helmholtz configuration this coils generate a magnetic quadrupole field with axial gradients up to 30 Gcm
4.2.1. Optical density
Collective quantum-optical phenomena depend upon the amount of emitting atoms. For the light generated via FWM this is determined by the number of atoms simultaneously interacting with both pump beams. A direct way to find out this number is by measuring
The absorption of a near-resonance laser beam traveling through an atomic sample is described by the Beer’s Law,
where
In Eq. (23),
Substituting Eq. (24) into Eq. (22) and integrating along
where
To measure
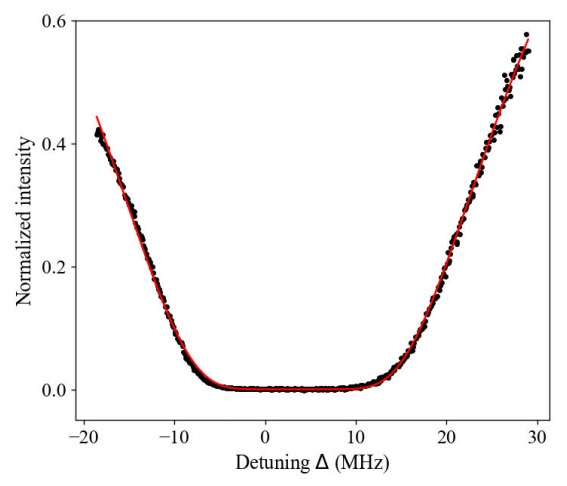
Figure 6 Normalized intensity
The optical density of a MOT mostly depends on: (i) the detuning
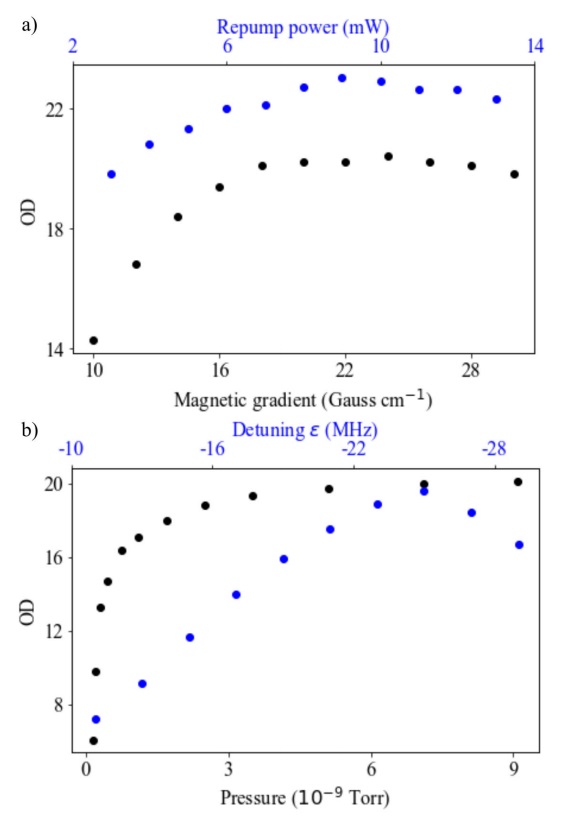
Figure 7 Dependency of
The blue dots in Fig. 7b) illustrate
From the data shown in Fig. 7 one can conclude that
4.3 Control and DAQ
Many atomic physics laboratories around the world have developed their own control system according to their experimental needs. One can find online examples ranging from completely open source [34] to semi-open source [35] and closed systems [36]. They all have two common fundamental characteristics: parallelism in the input/output signals and the ability to transport high speed 50
In order to design our control system we thought of two generically different experimental sequences: (1) The most relevant parameter of the MOT to our current research interests is
To achieve parallelism the core must have the complete sequence information before outputting any signal. For this to be possible it requires to access a physical memory device (RAM or ROM), storing the control sequence previously sent by the control host, a PC in our case, see Fig. 8. The time needed to deliver information from the host to the core, usually referred to as communication time, must be considered if multiple sequences are to be exported. It is typically in the order of hundreds of milliseconds; normally the core takes a few nanoseconds to access the device memory. This time should also be taken into account for the duty cycle repetition accuracy. Based on the number of digital and analog channels, and speed demands to carry out experiments, we selected the LabJack T7 [37] as the core of our control system.
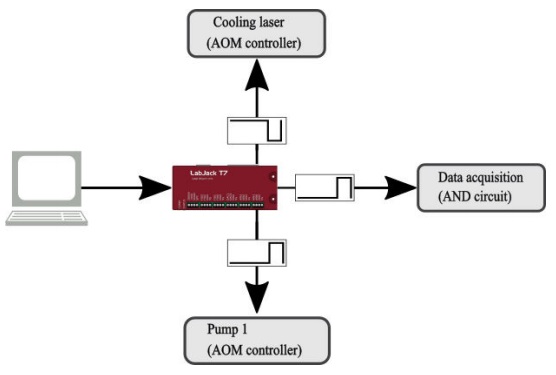
Figure 8 Block diagram of our control system. The experimental sequences are programmed in a PC. This information is sent to the chosen core, a LabJack T7 card, which in turn sends the coordinating signals to the experimental devices and the data acquisition system, see Sec.4.3.2.
4.3.1 Using a LabJack T7
The LabJack T7 is an inexpensive DAQ card with 23 digital input/output channels, 2 analog outputs, and a 32 kB RAM memory card. It can be a good solution if its technical limits are well understood. Throughout developing this control system we tested its information management capacity and its time resolution.
The digital channels are driven by 23 registers of one bit each;
The LabJack’s RAM memory has 16-bit outputs (words) [38] therefore its core must create information packets of this size. In consequence all output registers (digital and analog) are connected to the RAM through a 16-bit buffer. Thus, all control sequences must be created using a 16-bit word convention. For example, if we had four 16-bit words in the RAM memory the first word could be used to drive the first 16 digital outputs (considering there are in total 23 digital outputs), the second word could drive the remaining 7 outputs (ignoring the remaining 9-bits), and the last two words would drive an analog output (given the fact that each analog output have a 32-bit resolution, it requires two 16 bit RAM words to be completely defined). Every access to a different RAM word has to be done in a different time slot, therefore only a 16-bit parallelism is achievable in the LabJack.
The time resolution of the Labjack’s internal clock is 10
The T7 has a D-sub output that we used for wiring to the experimental setup by building a BNC terminal board [39]. Its output currents are low for driving 50 Ohm loads. Thus we built this board with a high speed buffer (Texas Instruments LMH6559) embedded on each channel. A two-rail power supply was used to bias the output buffers. The standby current consumption of all the buffered outputs is 500 mA. We wrote in Python a software to communicate a PC with the DAQ card. Its code and libraries are based on the vendors basic language, they are available in [39].
4.3.2 Data acquisition
Data acquisition for this experiment is also driven by a combination of commercial and home made instruments and software. It uses up to four avalanche photodiodes (APD, ID120-500-800) gated by AND circuits to a time-to-digital converter (id800TDC). The generated information is handled by an application written in Python. All APDs were calibrated through their bias voltages and operating temperatures. The quantum efficiency was set equal for all of them by adjusting individually the bias voltage whilst detecting a specific light intensity and wavelength. The operating temperatures were adjusted to
4.4 Pumping and detection
Four-wave mixing happens inside the science chamber that is located at the center of the schematics on Fig. 9, where the arrangements for the final preparation of the pump light and for the collection of the photon pairs are also depicted.
The three FWM beams,
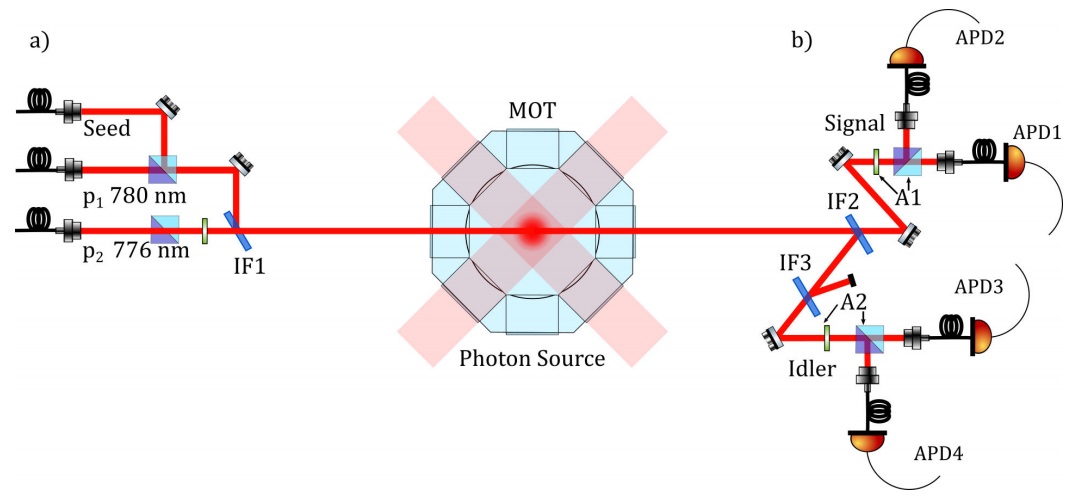
Figure 9 Schematics of the experimental setup to measure the time statistics of the photon pairs and their correlations in polarization: a) is the optics arrangement to collimate and combine the pump beams toward the center of the MOT and; b) is the optics for photon collection. The interference filter IF2 just transmits light with the signal frequency whereas IF3 transmits just idler photons and reflects all the pump beams remainders. Both output ports A1 and A2 couple each polarization component of the generated photons to an APD.
IF2 (LL01-780-25) allows just photons with the signal wavelength to pass through; IF3 (LL01-808-25) transmits the idler photon wavelength only. This array also filters the remainders of pump light in the photon flux that would appear as noise in our data. As depicted by Fig. 9b), both the signal and idler channels (A1 and A2) consist on a
Light sources at 762 nm and 795 nm are required to align the signal and idler photons because both channels are filtered in frequency. The two outputs of the signal channel A1 are aligned by enhancing the FWM process with the seed beam [41]. This enables detecting 762 nm photons with a simple CMOS camera, which serves as the reference to couple these photons to the fibers of APD1 and APD2. Fibers leading the idler photons to APD3 and APD4 are aligned with the seed laser beam itself as the reference. Thus we typically reach a 70
The optical setup illustrated in Fig. 9b) has been designed for measuring the signal and iddler crossed correlations and the auto-correlations of each channel. Bi-photon correlations are measured by adjusting the
A number of figures of merit have been designed to evaluate the generation of photon pairs. For this work we chose the coincidence rate since it is important for increasing the correlation histogram and the spectral brightness of the photon source (see Sec. 5). This parameter is optimized by a detuning
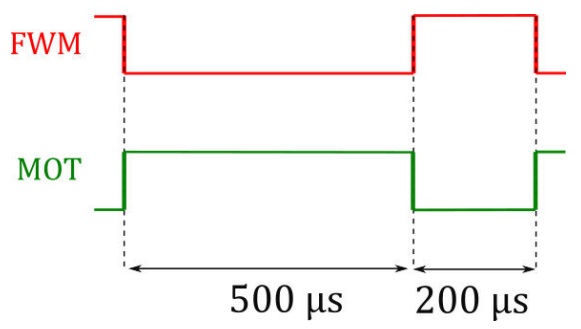
Figure 10 Experimental duty cycle optimizing the coincidence rate of photon pairs in our setup. It consists on a 500
5 Measured coherence properties
With the setup described above we recorded the detection statistics of the photon pairs. Its behaviour is predicted by their second-order crossed-correlation function (which was derived in Sec. 3), and the auto-correlation function of each channel. With the former we were able to estimate the coherence time of the heralded idler photons and thus, the spectral brightness of our source. A brief theoretical discussion of the expected behavior of the auto-correlation functions
5.1 Crossed- correlation function: coherence of the heralded photons
From Eq. (21) is reasonable to assume that the measured crossed-correlation function should fit
where
is the number of accidental coincidences. It is given by the coincidence rate expected from two uncorrelated random sources;
We fit the experimental data to the degree of second-order coherence, which is obtained by normalizing Eq. (26)
To make a more realistic model, one needs to introduce the noise probability distribution
with a width
Coincidence histograms are obtained as explained in Sec. 4. Since FWM is pumped with two beams with orthogonal, linear polarization the signal beam is measured on transmission and the idler beam is measured on reflection from their corresponding PBS (Fig. 9). In this way, the accidental coincidences are attenuated by approximately one-third. For the experimental results here presented the parameters of the pump beams are those given in Sec. 4.4 except that, in this case, the two-photon detuning
Figure 11 shows the experimental data (black dots) for typical cross-correlation experiments in our setup. The dotted red curve is a fitting of Eq. (31) to these results leaving
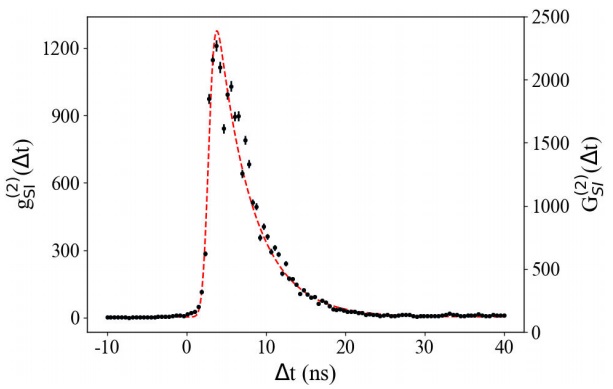
Figure 11 Cross-correlation histogram (black dots) as a function of the time delay between the signal and the idler photons. The right axis scales for the raw data whereas the left displays values for the normalized histogram. The red curve is a fit with (31). The best fitting parameters are
We use two separate estimates of the accidental coincidences
The measured coherence time of the heralded idler photons corresponds to a bandwidth of
The spectral brightness of a quantum light source is likely to become a determining parameter to achieve control over the interaction of its photons with atoms. It is given by
5.2 Auto-correlation functions: coherence properties of each channel.
Since the FWM process is induced on many atoms, each decay channel is a source of photons with chaotic origin. One can find their coherence properties through the treatment shown in Sec. 3.1, or by recalling that the first order correlation function of each atomic relaxation is given by the Fourier transform of its Lorentzian spectrum
where
by
indicating an expected sharp time symmetry due to the absolute value in the exponent with an exponential decay with rate
To fit this data, the detectors noise was also assumed Gaussian. Its convolution with Eq. (34) is
These experiments were performed by implementing a Hanbury Brown-Twiss interferometer at each output channel, A1 and A2, depicted on 9b). The photon flux of each one was evenly split at the PBS. Both reflecting and transmitting outputs were coupled into single-mode fibers and sent to their own APD.
The black dots in Fig. 12 display typical coincidence histograms for the signal (a) and idler (b) photons; the dashed, red curves are fitted to these data with Eq. (35). All the experimental parameters were set the same as for the cross-correlation plots except that the two photon detunings were
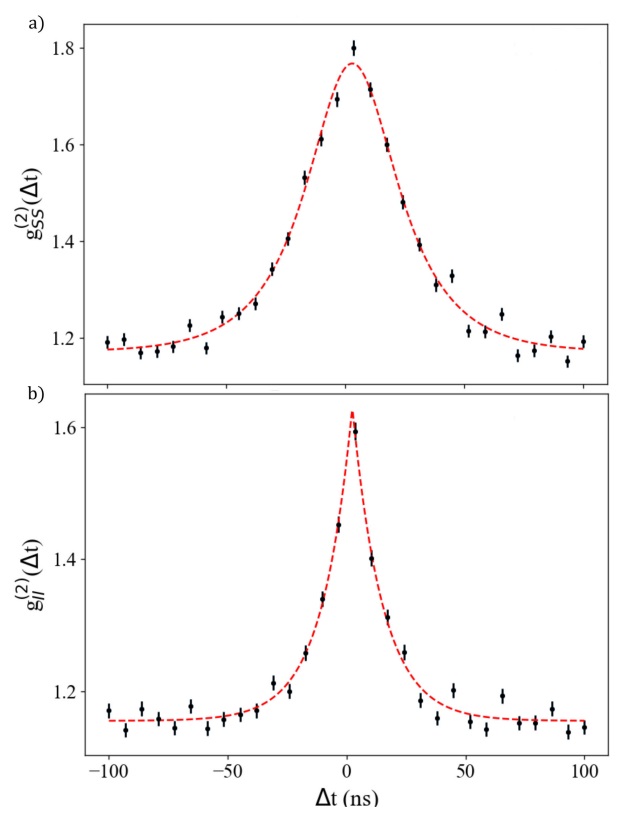
Figure 12 The black dots are the normalized autocorrelation histograms for a) signal and b) the idler photons. As expected, the auto-correlation
It is illustrative to point out the differences between these observations and the behaviour predicted for ideal detection. According to Eq. (34) the auto-correlation should present a maximum equal to 2 at the time zero. Neither the signal nor the idler maximum reach this value because the APDs quantum efficiencies are lower than 100%. Furthermore, it was found that
Table I Fit parameters
|
|
|
|
|
|---|---|---|---|
|
|
|
|
|
|
|
|
|
|
The coherence time
5.3 Non-classicality
A vector analysis of the classical electromagnetic field, based on the Cauchy-Schwartz inequality, predicts that [45]
where
6 Conclusion and outlook
This article presented our source of photon pairs generated from cold atomic Rubidium samples. The employed experimental methods and techniques were described in detail. The idler photons have a heralded coherence time of 4.4
The reported results are a basic coherence characterisation of the generated photons pairs. Further insight is possible by replacing the presented model, which is purely atomic and is based on the equation, by a mathematical treatment of the Lindblad type. With the later is possible to systematically calculate atomic collective effects on the generated light, and to describe the bi-photon states in terms of their variables, as polarization and angular momentum. This would give a suitable guide for further experimental research seeking to achieve control over the generated quantum states with the valuable help of atomic spectroscopy.
Our source is bright and the generated light has a bandwidth suitable for interacting with atoms. Tailoring the bi-photon states would allow us to modulate this interaction with precision. The achievement of these goals would broaden the possibilities for building complete quantum systems of time-correlated photon pairs with atoms. One of several potential possibilities in such kind of system is to imprint and read memories using the bi-photons as the flying messengers of quantum information. This is the scientific pathway that we have chosen for building an experimental scenario where exciting research on quantum information and its applications, like telecommunications and cryptography, can take place.


 nueva página del texto (beta)


