1. Introduction
Nanomaterials have significant physical and chemical properties compared to their bulk materials. In particular, over the past decades, semiconductor quantum dots (QDs) have received considerable attention among research communities due to their widespread use in optoelectronic devices1-4. When QDs are subjected to electric energy or light, they emit light of a specific wavelength, which can be tuned by changing the size, shape, and material composition of the QDs5. Therefore, the properties of QDs vary drastically depending on the size, shape and material. Moreover, QDs express the physical properties between bulk semiconductors and sub-atomic molecules. Extensive technological advances have also been found in light-emitting devices6, solar cells7, quantum computing8 and biomedical imaging9 due to the idiosyncratic tunable properties of QDs.
A practical understanding of the concept of quantum confinement effect is one of the biggest challenges. However, this study can provide a better understanding of the physics behind the quantum confinement effects. One of the basic explanations for understanding the physics behind quantum mechanics is ‘particle in a box’.
Currently, lead (Pb) and cadmium (Cd) based semiconductor nanostructures are well explored due to their attractive properties and simple fabrication technique. Lead and cadmium are heavy metals. The high toxicity of lead and cadmium-based QDs and legislative regulations are major barriears to their widespread use. In this scenario, zinc and tin-based QDs are considered as potential alternatives to conventional QDs. Considering the luminescence applications of zinc and tin-based QDs, they are environmentally friendly and cost-effective due to their less toxicity and high abundance. Also, these materials exhibit strong absorption across the electromagnetic spectrum. Hence, they are commonly used in sensors, bio labeling, optoelectronics devices, catalysis and many other interesting technical applications10-12.
The energy bandgap is an important intrinsic physical property of a solid material. In general, all materials can be classified into three types depending on the amplitude of the measured bandgap, i.e., (i) a material with the negligible energy bandgap is classified as conductor, (ii) a material with large bandgap is called an insulator, and (iii) a material with intermediate energy bandgap is classified as semiconductor13. Therefore, the energy bandgap plays an important role in altering the optical and electrical properties of nanostructured semiconductors. Significant work has been reported on photoluminescence, ultraviolet-near-infrared, and X-ray photoemission spectroscopies of semiconductor nanostructured material14-16. However, the theoretical determination of the energy bandgap about the semiconductor nanostructure provides undeniable insight. Many theoretical models have been reported, but further improvements toward completeness in the shape and size-dependent semiconductor nanostructures are always needed.
Since the energy bandgap depends on the quantum confinement effect of the charge carriers, it is important to provide a method for estimating this magnitude. Theoretical methods for estimating the energy bandgap of QDs are the Brus model (by effective mass approximation approach), the hyperbolic model and the cohesive energy model. It is possible to achieve results with good accuracy with these models and it is consistent with the experimental values. Therefore, with these models we can predict wavelength and energy bandgap. It will be useful to fabricate QDs with appropriate wavelength and energy bandgap based on their applications. The objective of this study is to compare three different theoretical methods used to determine the bandgap energy by changing its size. The theoretical prediction of zinc and tin-based chalcogenide semiconductor QDs such as ZnS, ZnSe, ZnTe, SnS, SnSe and SnTe is carried out.
2. Theoretical framework
The following models relate the bandgap energy to the dimension of the QDs. However, when experimental data is not available, it can be difficult to determine the value of these variables from theoretical models.
2.1. Brus model
The energy level formation in semiconductor nanomaterials is unique due to the quantum confinement effect. The “Brus model” is one of the most familiar theoretical models that allows for a relatively simple analytical relationship between material size and energy bandgap17,18.
Quantum mechanics describes a particle in a box model, i.e., a particle that moves freely in a small space surrounded by unpassable obstacles. The simplest model is a one-dimensional system in which the mass of a particle is confined to the length of a box from which it cannot escape. This quantum mechanical system is related to the particles in a box and allows physics students to use quantum mechanics to solve real life problems. Here, the equation is used to obtain the wave function and energy levels of a particle trapped in a one-dimensional box without approximations. The confinement energy of particles in a one-dimensional box19 is given as
where, m is the mass of the particle, L is the length of the box and n is the quantum number. The above equation shows that the energy of the particles is measured as a result of fulfilling the boundary conditions imposed on the system. However, the minimum energy of the particle is at n=1, i.e., the minimum energy of the particle is not zero, but corresponds to:
In QDs, the electron and the hole, like a particle in a box, move freely inside the dot but cannot move out. Therefore, QDs are real life particles in a box. Particles have been used in a model to study the effect of quantum confinement on their properties due to the similarities of QDs. However, some compensation has been made for their discrepancies. First, there are two particles (electron and hole) within quantum dots rather than one particle in a box. Second, QDs are geometrically spherical rather than a square, so the length of the box L changes with radius R, and third, the masses of the electron and the hole are replaced by their effective masses due to their interaction with the crystal lattice19.
The confinement energy of electrons in QDs is as follows:
and thus, the ground state confinement energy of electrons in QDs is
However, the electrons in QDs do not move in a vacuum unlike a particle in a box, but rather within a bulk semiconductor crystal. Therefore, the energy gap of the bulk accounts contributes to the baseline energy of the system. The energy gap of the QDs is the energy gap of the bulk semiconductor and the confinement energy of both electrons and the holes, related by
This equation expresses the relationship between the radius (R) and the bandgap energy of the nanomaterial E g (QD). The constants related to the material are: Eg (bulk), the energy bandgap of the bulk material; me* is the effective mass of the excited electrons and mh* is an effective mass of the excited holes, respectively.
2.2. Hyperbolic band model
In general, there are some important reasons for the inadequacy of the Brus model for quantitative interpretation of quantum confinement effects in nanocrystals. The primary reason is the breakdown of the effective mass approximation when the crystal size decreases. As the crystal size decreases, the motion of the electrons and holes differs qualitatively from that of the bulk material. Therefore, the concept of the effective masses of these charge carriers, in a sense, leads to the contact of electrons and holes with the bulk crystal lattice of a semiconductor crystal, which simply breaks down when the motion is strongly confined. The effective mass approximation is actually equal to the parabolic band approximation, i.e., the energy surfaces of the parabolic form ℏ2k2 / (2m*) is considered. Such an approximation is, of course, valid near k = 0 (i.e., near the center of the Brillouin zone), but not at the whole k-space20,21.
The Brus model is an inference of infinitely large energy outside the spherical nanocrystal, which contains electrons and holes. In other words, the nanocrystal surface is impregnable by electron and holes. It is explained that the particles are confined in a spherical box with infinitely high “walls”. Such an approximation is, undoubtedly, when charge-carrying objects such as electrons and holes are questionable, rather a crude one.
The hyperbolic band model is developed on two main approximations. According to the first approximation, the lowest (in energy sense) lattice excitation of a binary type semiconductor is assumed to contain charge transfer from anion to metal cation at the cost of energy equal to the bulk band gap. The intrinsic second approximation of this model is that the hyperbolic band model takes into account only two corresponding bands to calculate the energy bandgap at the relevant point of the Brillouin zone (related to the band gap) correspond to the maximum occupied valence band and the lowest unoccupied conduction band. Coulomb corrections for overall band gap shift are considered small and are ignored in this model. Based on the previous assumptions, the following analytical formula for size-dependent band gap energy E(R) as obtained in the hyperbolic band model. The main improvement of the hyperbolic band model with respect to the Brus model is that the former may be due to the electron and hole band non-parabolicity. Within this model, hole and electron bands are hyperbolic, but they approach parabolic behavior at the point of the Brillouin zone. The hyperbolic band model has the effective mass of electrons (me*) inside the semiconductor and the effective mass of holes (mh*) outside the semiconductor20. By ignoring the Coulomb modifications of the overall bandgap energy shift, the following equation for size dependent energy bandgap was obtained20,21.
where Eg (QD) and Eg are the energy bandgap of the semiconductor nanomaterial and the bulk crystal, respectively.
2.3. Cohesive energy model
The third model used in this work is the cohesive energy model. The cohesive energy is one of the most important properties of semiconductor nanomaterials. A theoretical model for exploring the effects of size dependent cohesive energies of free and cluster nanoparticles is based on the principles of thermodynamics.
The cohesive energy of semiconductor solids is the energy required to break all the bonds associated with one of its molecules. The total cohesive energy of a nanomaterial is defined as the energy produced by the contribution of surface atoms and inner atoms, which are given below,
where, E0 is the cohesive energy of the bulk semiconductor per atom, N represents the number of surface atoms and n is the total number of atoms of the nanosolid. Therefore, (n - N) represents the total number of inner atoms in the nanomaterial. The solution of the above-mentioned equation for QDs is expressed in the Ref.22. The following equation is used to study the bandgap energy variation of semiconductor QDs at different sizes.
where D represents the diameter of the nanosolid and d is the diameter of an atom.
3. Theoretical parameters
Based on the literature, the parameters used for the analysis are shown in Table I.
Table I Parameters of different elements.
| Parameters | Value | Literature |
|---|---|---|
| Energy bandgap for ZnS, ZnSe and ZnTe | 3.68eV, 2.82eV and 2.39eV | 23,24 |
| Energy bandgap for SnS, SnSe and SnTe | 3.68eV, 2.82eV and 2.39eV | 25-27 |
| Effective mass of electrons for ZnS, ZnSe and ZnTe | 1.71mo, 0.21mo and 0.15mo | 28-30 |
| Effective mass of holes for ZnS, ZnSe and ZnTe | 3.04mo, 0.6mo and 0.8mo | 28-30 |
| Effective mass of electrons for SnS, SnSe and SnTe | 0.49mo, 0.41mo and 0.16mo | 31,32 |
| Effective mass of holes for SnS, SnSe and SnTe | 0.55mo, 0.48mo and 1.24mo | 31,33 |
mo-mass of electrons at rest
4. Results and discussion
Three approximation models have been used to analyze the decrease in energy bandgap with increasing size of QDs. The results obtained are reported with available experimental data and compared in Figs. 1-6.
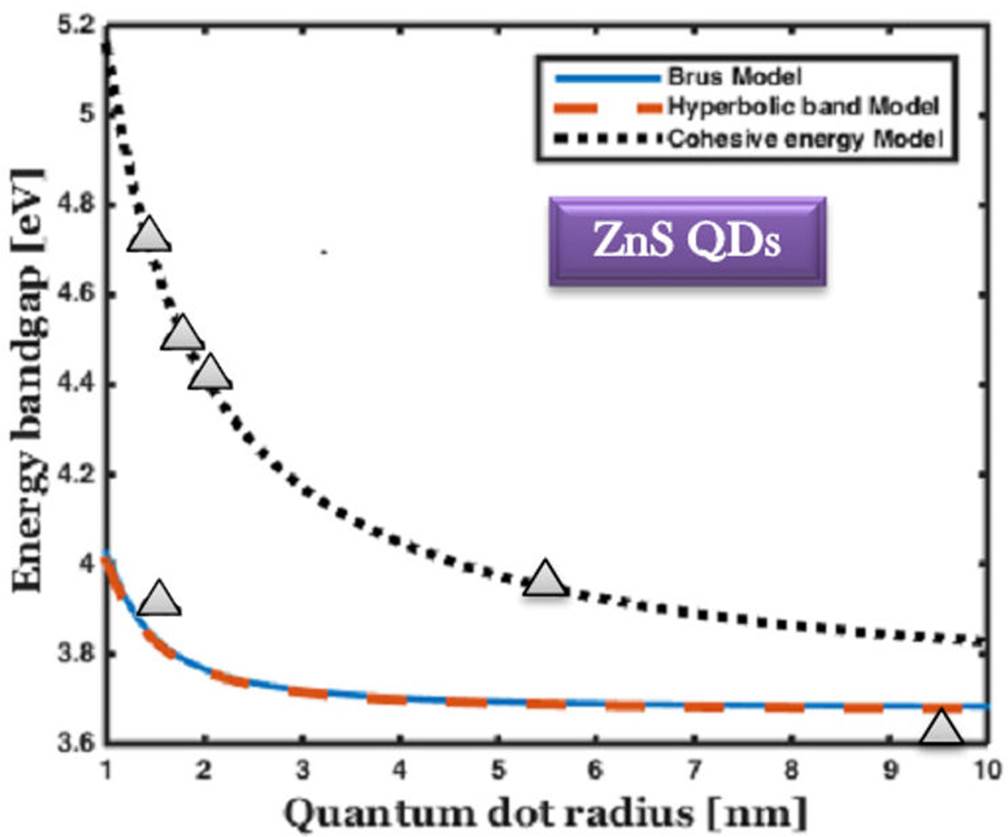
Figure 1 The comparison of bandgap energy variation of ZnS QDs with respect to the size of QDs, and the experimental results are marked by solid triangle 34-38.
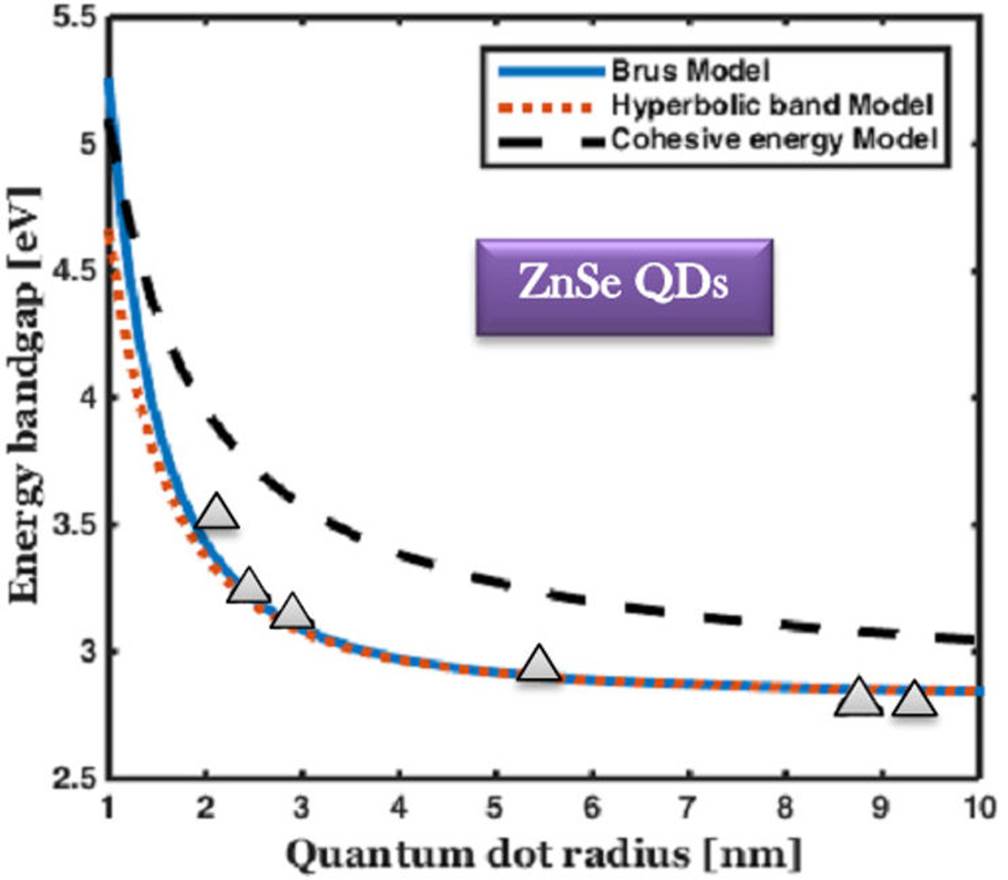
Figure 2 The comparison of bandgap energy variation of ZnSe QDs with respect to the size of QDs, and the experimental results are marked by solid triangle 39-44.
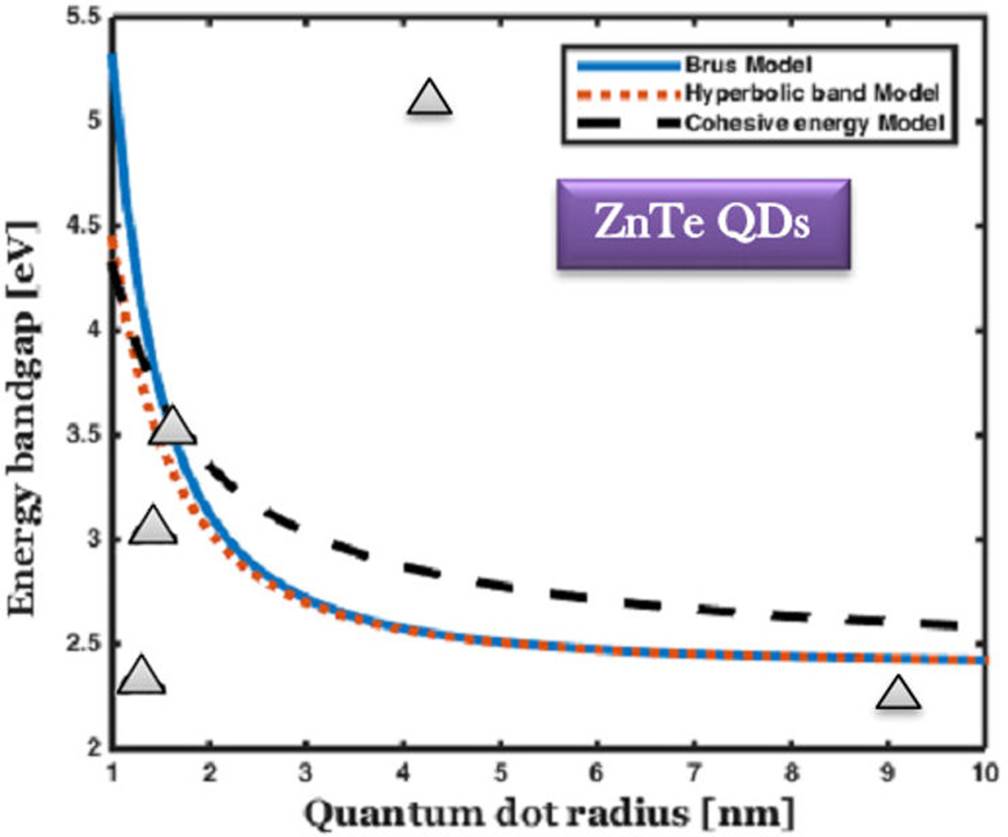
Figure 3 The comparison of bandgap energy variation of ZnTe QDs with respect to the size of QDs, and the experimental results are marked by solid triangle 45-48.
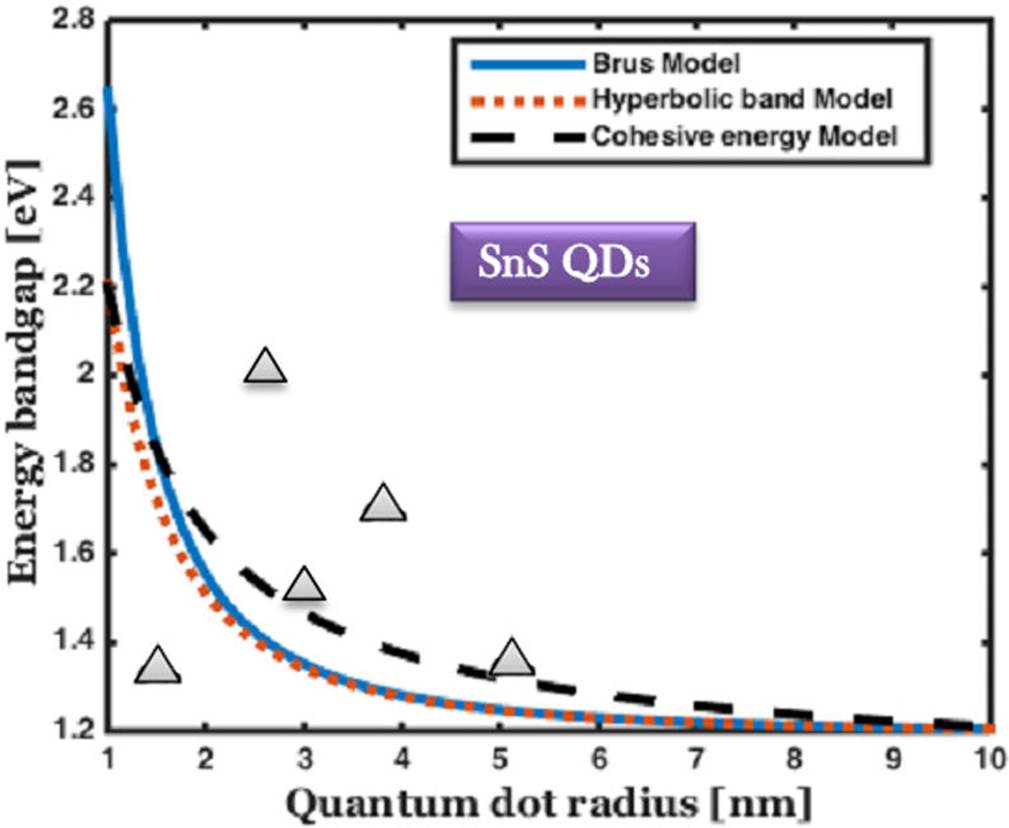
Figure 4 The comparison of bandgap energy variation of SnS QDs with respect to the size of the QDs, and the experimental results are marked by solid triangle 49-53.
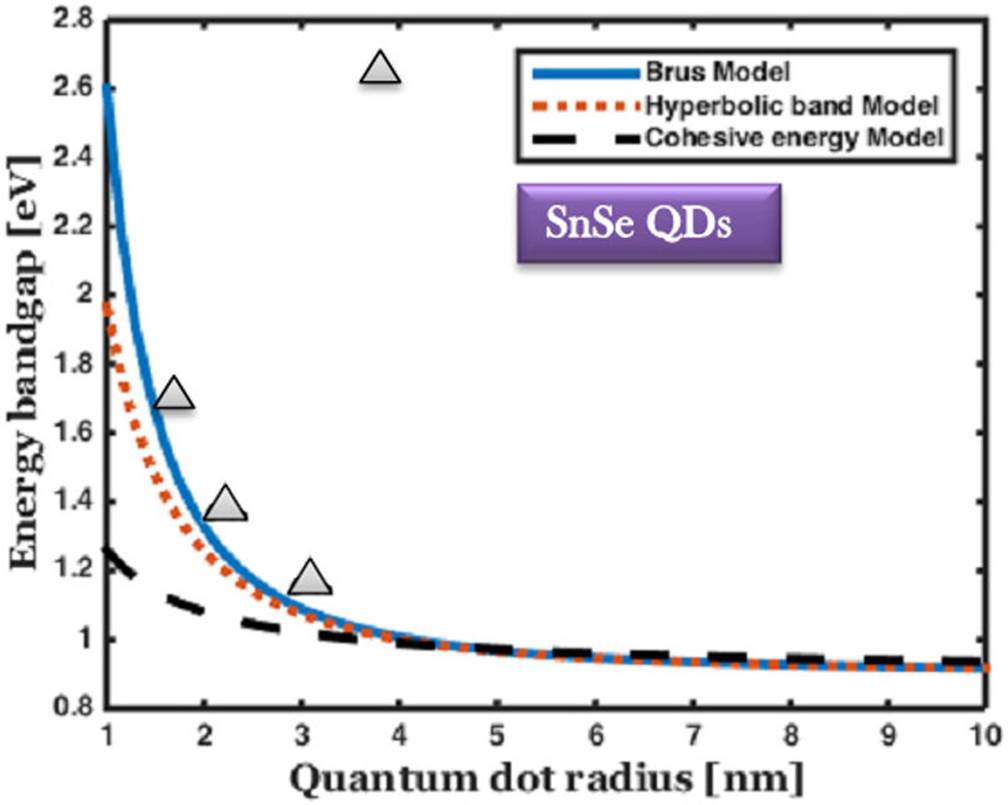
Figure 5 The comparison of the bandgap energy variation of SnSe QDs with respect to the size of QDs, and the experimental results are marked by solid triangle 54,55.
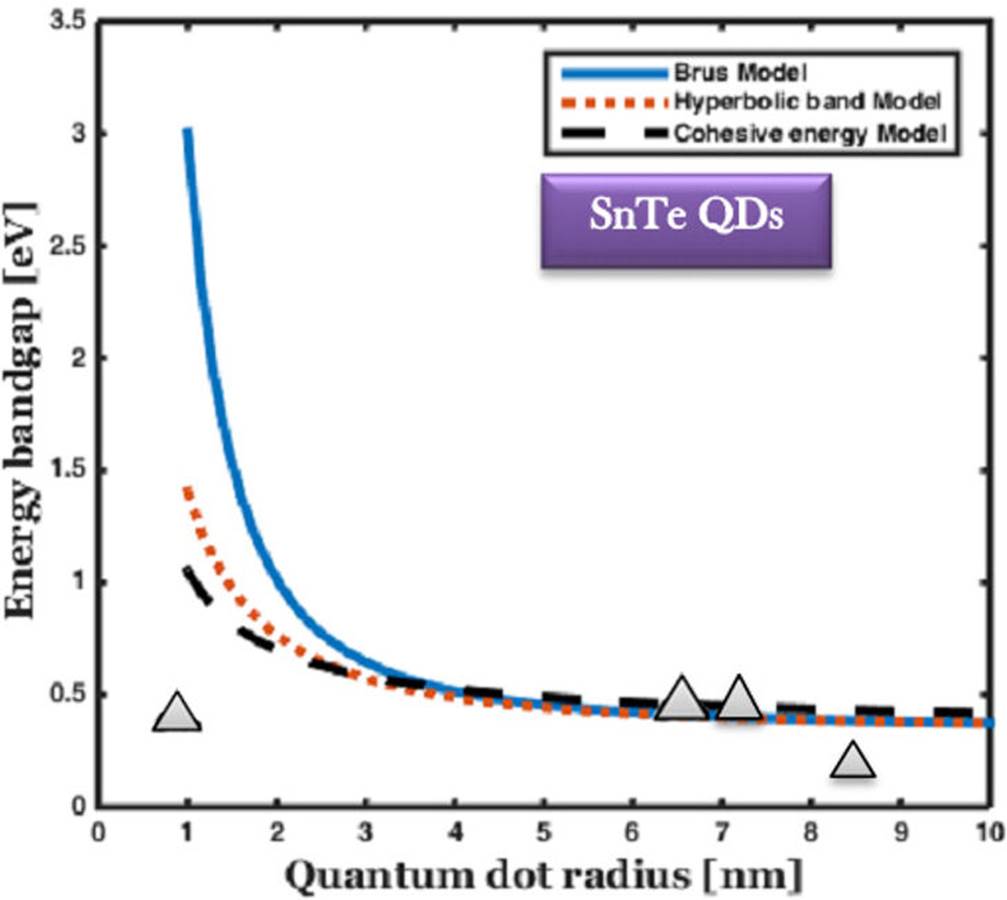
Figure 6 The comparison of the bandgap energy variation of SnTe QDs with size, and the experimental results are marked by the solid triangle 56-58.
The results obtained for zinc-containing QDs (ZnS, ZnSe and ZnTe) show that the bandgap energy depends on the size. Thus, an increase in the size of QDs leads to a decrease in bandgap energy, but does not reach zero. The Brus and hyperbolic band model exactly reflects the same results with slight variations in the cohesive energy model.
An increase in energy bandgap is observed with an increase in the confinement energy level. The confinement begins by comparing the radius of the QDs or the order of the exciton Bohr radius and the size of the QDs with 2rB. As the size of QDs decreases the energy level decreases significantly. This occurs until the optimum number of cluster and atoms stabilizes the configuration while maintaining a specific structure of semiconductor material. In this case, the Brus model is no longer good and the semiconductor material loses its stability.
Figure 1 shows the spectra probed at different QDs sizes of the three different models. When the radius of the QDs is 1 nm, the energy bandgap from the Brus and the hyperbolic model is 4 eV. As the radius of the QDs increases to 2 nm, the bandgap energy gradually decreases. When the radius of the QDs increases from 3 to 10 nm, there is no considerable variation for the quantum dot radii considered. The energy gap is maintained at a constant value of 3.65 eV. In the case of the cohesive energy model, the variation of the bandgap energy is slightly higher than usual. Compared to the bulk ZnS, ZnS QDs show a blue shift absorption in the range of 308-337 nm. Three approximation models have been used to analyse the decrease in bandgap energy with increasing size of QDs. The results obtained are reported with available experimental data and compared in Figs. 1-6.
In ZnSe QDs, the bandgap energy is 5.2 eV, 4.64 eV, and 5.02 eV with the radius of 1nm for Brus, hyperbolic band, and cohesive energy model, respectively. Furthermore, with a slight increase in the radius of QDs, the energy bandgap gradually decreases. The Brus and hyperbolic model produce the same results over 2 nm. The optimal energy bandgap is selected, which gives the absorption range as the size of the QDs varying across the entire area of the ultraviolet spectrum.
For smaller QDs (approximately 1 nm), 3 shows the calculated energy bandgap of 4.4 eV and 5.3 eV, which is the highest value of this compound. The corresponding calculated value for the maximum size of the QDs is 2.42eV (512 nm). As the size of QDs increases, the value of energy bandgap decreases. When the size of the QDs varies from 1 to 10 nm, it covers the entire ultraviolet and near-visible range of the spectrum. This is the optimal wavelength range for QD laser fabrication for neurosurgical applications.
Zinc based chalcogenide QDs (ZnS, ZnSe, and ZnTe) with wide energy bandgap exhibit absorption and emission from ultraviolet to near-visible range of the spectrum (269 to 512 nm). By tuning the size of the materials from 1 to 10 nm, the energy bandgap varies with the bulk material wavelength, and it covers a larger spectrum of ultraviolet and blue spectral ranges. Therefore, it is the most favorable wavelength for solar cells and light-emitting devices for biomedical applications.
Figures 4 and 5 show a substantial increase in energy bandgap when the QDs size is less than 3 nm. Furthermore, the predicted results are in good agreement with the experimental results for the full range of SnS and SnSe QDs. For SnS, the maximum and minimum values of energy bandgap are 2.49 eV (497 nm) and 1.21 eV (1024 nm), respectively. This material covers a maximum portion of visible and minimum portion of near-infrared range. This is the most favorable wavelength for fabricating laser diodes with optical communication sources at 850 nm wavelength.
For SnSe QDs, the maximum energy bandgap was found to be 2.6 eV, 1.96 eV and 1.26 eV by Brus, hyperbolic band and cohesive energy model, respectively. When the radius of the QDs increases from 3.2 to 10 nm, there is no much variation in the spectrum. The energy gap is maintainedat a constant value of 0.91 eV (1362 nm). It covers the entire region of the visible spectrum and the maximum portion of the near-infrared spectrum. This can be a highly favorable wavelength for O-band (1310 nm) operating wavelength fiber optic communication sources and solar cells. It is the primary wavelength of the multimode optical communication sources combined with the vertical-cavity surface-emitting laser.
From 6, it is observed that all three models revealed the same values, while the size of the QDs ranged from 3-10 nm. This supports the exact nature of the formula used to calculate energy bandgap. The results are compared with the experimental data reported by the Ref.56. The trend of the energy bandgap variation is reported to be similar. There is a good agreement between the theory and experimental data for the size of less than 3 nm. It covers the entire portion of the visible to infrared range of the electromagnetic spectrum. SnTe QDs coated solar cells can use near-infrared and infrared ranges, and which improves the efficiency of the solar cell by generating more electron-hole pairs.
With the exception of a few materials, the energy bandgap was found to be slightly different from the cohesive energy models. In the cohesive energy model, the bandgap energy variations depend on the size and the shape of the QDs. The size and shape-dependent cohesive energy of QDs can be explained by the destruction of the bonds of the surface atoms. An increase in surface-to-volume ratio results in an increase in the number of surface atoms compared to the inner atoms, which leads to a decrease in the cohesive energy and, therefore, a decrease in bandgap energy. The cohesive energy not only depends on the size but also on the shape, which causes a variation in the bandgap energy, which distinguishes it from other theoretical models.
Energy bandgap studies on tin and zinc chalcogenide QDs show promising results. In Sn Chalcogenides (SnS, SnSe, and SnTe) and zinc telluride, significant differences are found between modeling and experimental results. The reason for the variation in experimental results is mainly the variation in temperature and capping ligand during the synthesis of nanomaterials. The capping ligands are Oleic acid and octadecylamine for SnS, ethylenediamine and NaOH for SnSe, triethanolamine for SnTe and Oleylamine for ZnTe, respectively. They influence the surface energy of different facets found on the surface of the cubic structural phase of SnS {(101) (111) (040) (002)}, orthorhombic phase of SnSe {(111) (131)}, cubic rock salt crystal structure of SnTe (200) and hexagonal phase of ZnTe {(101) (102) (111)}. This affects the final structure of the QDs and determines the atomic arrangement on their surface, which causes variations in the optical bandgap energy of the QDs59-67.
5. Conclusion
The unique physical properties of zinc and tin chalcogenides led to the development of many optoelectronic applications, and the tunable bandgap energy could be tailored to suit the electronic transport properties. These theoretical models suggest that energy bandgap decreases with increasing the size of QDs. Except for the theoretical models; these values match well with the experimental data and support the validity of the models. This theoretical model analysis will also support new materials without any previous experimental data.


 nueva página del texto (beta)


