


 texto en
  Inglés (pdf)
 Artículo en XML
 Referencias del artículo
 Enviar artículo por email
 Citado por SciELO
  Similares en
SciELO
Similares en
SciELO 
 Permalink
INTRODUCTION
Many human settlements in the Gulf of California depend on coastal, artisanal, or small-scale fisheries, especially those of bony fishes, elasmobranchs, mollusks, and crustaceans (Lluch-Cota et al. 2007). Species belonging to the family Sciaenidae, known as “corvinas” in Spanish and “drums” or “croakers” in English (Chao et al. 1995, Froese and Pauly 2021), are becoming one of the most important families from a socio-economic and ecological viewpoint, especially those in the region that comprises the eastern Tropical Pacific Ocean (Robertson and Allen 2015).
On the coast of Sinaloa, 7 genera of drums and croakers (Bardiella, Cheilotrema, Cynoscion, Menticirrus, Micropogonias, Umbrina, and Roncador) include 20 target fish, which are targeted by several fishing fleets such as shrimp trawling boats (bycatch), gillnets, handlines, and longlines (targeted fishery) (DOF 2010). The shrimp trawl fishery affects around 33 species of drums and croakers in the Pacific coast of Mexico (López-Martínez et al. 2010, Palacios-Salgado 2011). Out of those, Cynoscion reticulatus, Cynoscion xanthulus, Cynoscion phoxocephalus, Cynoscion parvipinnis, Larimus argenteus, Umbrina roncador, and Micropogonias ectenes stand out as common and important resources in local fisheries. These 7 species used to have a low market value; however, due to an increase in food demand at the local and national levels (Alfaro and Quintero 2014) and a decrease in the catch of species with higher commercial value, they now represent one of the main targets of coastal fisheries in Sinaloa. Notably, C. reticulatus has been a bycatch of the Pacific sierra fishery (Scomberomorus sierra); this species has the potential to become an important national fishery resource due to its wide distribution (from southern Baja California and Gulf of California, Mexico, to Colombia; Robertson and Allen 2015) and price.
Despite the economic potential and attention that C. reticulatus is currently receiving, this resource faces the same problem as most coastal resources: a severe lack of biological and fishery information for informed management and sustainable exploitation. Scientific information to evaluate exploitation, biological parameters of the population such as fish maturity and growth, are essential to develop strategies or management plans that contribute to the sustainable use of resources (Méndez-Espinoza et al. 2020). One of the most critical biological parameters to evaluate and manage fisheries is the mean size at sexual maturity (L50), defined as the size at which 50% of individuals in a population are mature (Trippel and Harvey 1991, Trippel 1995, Fontoura et al. 2009, Jacob-Cervantes and Aguirre-Villaseñor 2014). This biological parameter is used to estimate the mature fraction of a fish stock (Cubillos and Alarcon 2010) and can help establish the minimum catch size (MCS) (Corgos and Freire 2006, Jacob-Cervantes and Aguirre-Villaseñor 2014).
Given that the striped corvina is a vital fishery resource in southern Sinaloa, and that there is a lack of biological information for its fishery management, we estimated the mean size at sexual maturity to inform the management authority (CONAPESCA) to establish a MCS for this resource caught off the coast of southern Sinaloa.
MATERIALS AND METHODS
Sampling
Approximately 30 individuals per month were obtained randomly from the commercial coastal fishery landings in the port of Mazatlán from December 2020 to December 2021. This fishery operates in the southern coast of Sinaloa, Mexico, from Barras de Piaxtla (22°45′ N-106°02′ W) to Chametla (23°36′ N-106°54′ W) (Fig. 1). Two fishing gears were used: (1) approximately 300-m long bottom gillnets with 3.0-3.5” mesh size and (2) 900-m long by 70-m deep bottom longlines with circular 12/0 hooks (Mustad 39960-D).
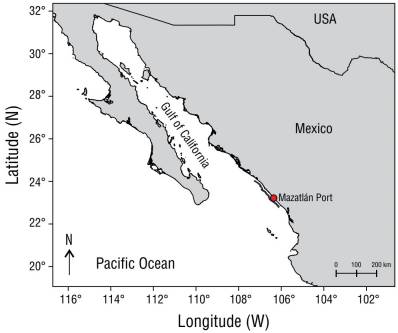
Figure 1 Map of northwestern Mexico. The shaded area near the port of Mazatlán shows the area of operation of the drum and croaker fishing fleet off the coast of southern Sinaloa.
Collected individuals were transported to the Facultad de Ciencias del Mar of the Universidad Autónoma de Sinaloa. The total length (TL) and standard length (SL) of fresh individuals were recorded, sex was assigned by visual assessment of the gonads, and maturity was determined considering the 5 gonadal stages; the description was based on the morphochromatic scale for partial spawners (adapted from Holden and Raitt 1975) (Table 1).
From the total number of organisms collected during sampling, only individuals with the following 3 conditions were used to estimate mean size at sexual maturity: (1) identified as females, (2) sexual maturity stage could be determined, and (3) standard length was recorded.
Table 1 Macroscopic gonadal maturity scale for female partial spawners (adapted from Holden and Raitt 1975).
| Stage | State | Description |
| I | Immature | Ovaries approximately 1/3 length of abdominal cavity, pinkish and translucent. Oocytes not visible to the naked eye. |
| II | Maturing or recovering | Ovaries approximately 1/2 length of abdominal cavity, pinkish and translucent. Not visible to the naked eye. |
| III | Mature | Ovaries approximately 2/3 length of abdominal cavity, pinkish-yellow with granular appearance. No transparent or translucid oocytes. |
| IV | Pre-spawn | Ovaries approximately 2/3 length of abdominal cavity, pinkish-yellow with superficial blood vessels. Transparent and visible mature oocytes. |
| V | Post-spawn | Ovaries approximately 1/2 length of abdominal cavity, flaccid. Opaque, dark, or translucid oocyte remains can be seen. |
Mean size at sexual maturity
Three a priori models that describe sigmoidal curves were selected to estimate the mean standard length at sexual maturity (SL 50 ). The sigmoidal models evaluated were:
SL i is the standard length of class size I, SL 50 is the standard length at which 50% of females are mature, β 1 is a rate of change, and SL 95 is the length at which 95% of females are mature.
These models were adjusted to the SL-gonadal developmental stage data of females for each class i , plus a logical adjustment value (immature female at 0 cm SL [at hatching]), and finally evaluated through a multimodel approach. The standard length was used because sometimes the caudal fin of individuals obtained from commercial fisheries can be damaged, and the TL cannot be recorded adequately.
Considering the observed proportion of sexually mature/inmature females for each SL i class, we assumed a binomial distribution to adjust the models (Haddon 2011). The mature or immature status was assigned according to descriptions by Holden and Raitt (1975) as follows: females in stages III, IV, and V were considered “sexually mature,” and females in stages I and II were considered “sexually immature.” In addition, individuals were categorized based on whether they already had at least one reproductive event; females at the post-spawn stage were considered in the “mature” category, as they had previous reproductive activity.
Parameters (θ) were estimated by minimizing the negative likelihood logarithm (-lnLl), assuming a binomial distribution, using Newton's direct search algorithm (Neter et al. 1996).
Confidence intervals
Confidence intervals (CI) of the θ i parameters of the candidate models were calculated using likelihood profiles: this method uses a χ2 distribution with n = 1 degrees of freedom (d.f.) (Hilborn and Mangel 1997), where all values ≤3.84 are accepted within the CI of the individual parameter (Morales-Bojórquez and Nevárez-Martínez 2005). The χ2 estimator was calculated as follows (Haddon 2001):
where LL(θ est) is the negative logarithmic probability of the most probable θ i value, LL(θ i ) is the negative logarithmic probability based on the hypothesis of the θ i value (profile or contour), and χ2 1-α is the value of the χ2 distribution with a confidence level 1- α = 0.05, and d.f. = 1 (profiles) or 2 (contours) (Haddon 2001).
Best model selection
After the CI calculation, we used several models to estimate the mean size at sexual maturity. The Akaike information criterion (AIC) was calculated for each of the evaluated models.
where -lnLl is the likelihood value for each adjusted model and k is the number of parameters in the model.
Akaike differences were then calculated as follows: (∆ AIC ) ∆ AIC = AIC i - AIC min . According to Burnham and Anderson (2002), models with ∆ i > 10 have no statistical support, models with 4 < ∆ i > 7 have intermediate support, and models with ∆ i < 2 have substantial support.
Finally, the data trend of each candidate model with ∆ i < 2 was calculated, and an average model was obtained. We first evaluated the likelihood of each model by calculating the AIC weight (w i ) using the equation proposed by Burnham and Anderson (2002).
where ∆
i
are Akaike differences (∆
AIC
) and w
i
is the weight of evidence in favor of model
i
(Akaike 1983, Buckland et al. 1997, Burnham and Anderson 2002). Afterwards, the average SL
50
Finally, we undertook a detailed literature review (Table 2) to understand the variability in the mean size at sexual maturity in the genus Cynoscion in several areas of the American continent.
Table 2 Estimates of size at maturity of fishes of the genus Cynoscion in several areas of the American continent.
| Species | Area | L50 (cm) | Maximum size (TL cm) |
Reference |
| Cynoscion squamipinnis | Costa Rica | 38 | 64 | Campos et al. 1984 |
| Panama | 40 | 64 | Campos 1992 | |
| 31 | 64 | Miranda and Sánchez 2018 | ||
| Cynoscion phoxocephalus | Costa Rica | 23.5 | 60 | Campos et al. 1984 |
| 40 | 60 | Campos 1992 | ||
| Panama | 30 | 60 | Vega et al. 2008 | |
| 30 | 60 | Miranda and Sánchez 2018 | ||
| Cynoscion albus | Costa Rica | 35 | 130 | Campos et al. 1984 |
| 65 | 130 | Campos 1992 | ||
| Panama | 75 | 130 | Campos 1992 | |
| Cynoscion jamaicencis | Venezuela | 25.1 | 50 | Márcano et al. 2002 |
| Cynoscion othonopterus | Upper Gulf of California | 48 | 70 | Mendivil-Mendoza 2018 |
| Cynoscion reticulatus | Guatemala | 33.08 | 90 | Ortíz et al. 2021 |
| Cynoscion nebulosus | Northwestern Gulf of Mexico | 26-30 | 100 | Brown-Peterson et al. 2002 |
| Cynoscion regalis | Western Atlantic, United States | 17 | 98 | Lowerre-Barbieri et al. 1996 |
RESULTS
A total of 284 C. reticulatus ranging from 24.4 to 47.8 cm in SL (with a 28.4 to 49.4 cm TL) were sampled.
Of the 284 organisms, 6 were discarded as their sexual maturity stage could not be determined, which left 278 organisms (147 males and 131 females). Since only females were used in the analysis, the number of individuals was lower than the total (N = 131). Of these, 65% (n = 85) were considered “sexually mature” (stage III [14 organisms], stage IV [16 organisms], and stage V [55 organisms]), and 35% (n = 46) were considered “sexually immature” (stage I [41 organisms] and stage II [5 organisms]). The SL and proportion of mature/immature organisms were grouped in 5-cm intervals (Fig. 2).
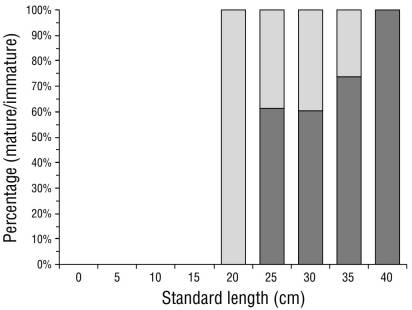
Figure 2 Proportion of mature/immature Cynoscion reticulatus caught off the southern coast of Sinaloa grouped in 5-cm standard length (SL) intervals. Light and dark bars represent the proportion of immature and mature fish, respectively.
Average size at sexual maturity
The 3 models fit the data (n = 131) (Fig. 3). The parameters of each model have a particular meaning; these do not allow comparisons among them, except for the mean standard length at sexual maturity (SL 50 ), which ranged between 21.7 and 25.9 cm SL. The values estimated for each model are presented below:
Gompertz:
Lysack:
White:

Confidence intervals
The results of the estimate of likelihood profiles for Gompertz were SL 50 = [18.4, 24.6] β = [0.064, 0.124] (Fig. S1a, b), those for Lysack were SL 50 = [22.8, 28.8] β = [0.640, 0.186] (Fig. S1c, d), and those for White were SL 50 = [21.6/29.0] SL 95 = [41.8/72.8] (Fig. S1e, f). Additionally, the Likelihood profile plots (Fig. S1) allowed us to observe that the likelihood value obtained from the model fit to the data did not denote the presence of local minima.
Best model selection
The lowest AIC value was obtained with the White model (Table 3). Therefore, according to the parsimony principle, this model was considered the most adequate to estimate SL 50 in C. reticulatus. However, although it had the lowest AIC, the Gompertz and Lysack models also presented high statistical support (Δ AIC < 1).
Table 3 Akaike values, Akaike differences of each model with respect to the model with the lowest AIC value (White’s), and W i for size at maturity models applied to obtain SL 50 estimates for Cynoscion reticulatus females caught off the southern coast of Sinaloa.
| Model | # Parameters | AIC | AIC differences (Δ i ) | W i |
| Gompertz | 2 | 21.336 | 0.040900884 | 0.32880439 |
| Lysack | 2 | 21.295 | 3.36549E-11 | 0.33559781 |
| White | 2 | 21.295 | 0 | 0.33559781 |
Therefore, the 3 models exhibited sufficient statistical support to be integrated into the estimation of the average SL
50
Finally, once the parameter was estimated (

DISCUSSION
The first step in properly managing a fishery resource is to understand the population dynamics. One of the most popular approaches to achieve this goal is the biological analysis of population parameters. According to Begg (2005), these parameters can characterize each population and are the consequence of the population’s life cycle. Among the most frequently used parameters are individual growth and mean size at sexual maturity (Winemiller and Rose 1992, McCann and Shuter 1997, Shuter et al. 1998, Espino-Barr et al. 2008) and, according to Hilborn and Walters (1992), the analysis of these 2 parameters (body size and growth) has been a major preoccupation of fishery scientists, as both are major components of biological production and are related to problems that cannot be ignored in fishery management, such as growth and recruitment overfishing.
Here, we estimated the mean size at sexual maturity (SL 50 ) of the striped corvina and established a baseline for future studies. As a reproductive strategy, size at maturity varies as a function of time, the environment, and fishery pressure (Gulland 1971, Csirke 1980, García-Alberto 2010). It can be reflected as changes to the size structure of a population, with a decrease in the number of large individuals and a modification in the ages at which maturity ogives are reached, among others. Therefore, interannual monitoring of size at maturity is essential, as it can indicate changes in the dynamics of a population.
Another benefit of estimating the SL 50 is that it provides vital information for developing fishery management measures. For example, this parameter could be incorporated into modeling frameworks to analyze the state of the resource, estimate biomass, and establish catch quotas and MCS. The MCS is defined as the minimum length an individual must reach before it can be captured. This length must be calculated with a biological basis related to the size at which the SL 50 is reached and must include an additional period so that the individuals can contribute to a spawning event (Hutchings and Reynolds 2004, Aragón-Noriega 2015). This enables the recruitment of juveniles to the adult stock or to an area where the species is established or could be established (Fowler and Cohen 2013).
Minimum catch sizes are one of the instruments that can be used to regulate exploitation strategies in Mexico (DOF 2018). However, the procedure to establish these measures can be ambiguous, specifically when trying to establish the time or size after which SL 50 is reached so individuals can contribute to spawning. Three possible strategies were considered to establish the MCS of C. reticulatus caught off southern Sinaloa based on the estimated SL 50 , as follows:
1.-.
Use the estimate of weighted or average SL
50
2.-.
Use the upper estimate confidence interval of
3.-. Estimate a third parameter (SL i ) for the equation through the inverse calculation of the average model equation, as follows:
This new parameter could be SL 60 (P 0.6), SL 70 (P 0.7 ), or SL 75 (P 0.75 )… SL 100 (P 1 ), as a function of the precautionary level wanted. For example, in this study at SL 75 , the MCS would be 34.7 cm SL.
We consider strategy 2 (in this order) to be the most appropriate to manage the striped corvina fishery of the southern coast of Sinaloa, as basing the minimum catch size directly on the SL 50 estimate (strategy 1) would be looking for half of the recruited population to the spawning stock; therefore, strategies 2 and 3 have the capacity to incorporate a precautionary approach. The most commonly used is strategy 2, in which the upper confidence interval of SL 50 is used as MCS, which slightly increases the size to allow the incorporation of a greater percentage of organisms to the parental population but without increasing the size of the catch too much so that it remains profitable for the fishers; thus, it increases the likelihood of compliance with this regulation.
An important example of establishing and updating minimum catch sizes based on the upper confidence interval of L50 is the case of the Pacific thread herring, for which an MCS of 160 mm SL was established in 1983 in the Diario Oficial de la Federeación (Official Gazette of the Federation; DOF 1983) and later updated in the official government policy NOM-003-PESC-1993 (DOF 1993). This size was updated to an MCS of 140 mm SL (NOM-003-SAG/PESC-2018; DOF 2019) based on the re-evaluation of L50 by Jacob-Cervantes and Aguirre-Villaseñor (2014) where the estimated L50 was 135 mm (130-139 mm) and, although official reports of the results of implementing this policy have not yet been published, it is clear that the bioecological balance of species changes over time, and we must adjust fishery management measures periodically to avoid misrepresenting resource behavior and overexploiting stocks.
On the other hand, it is pertinent to mention that in the case of the striped corvina, the previous management measure is suggested based solely on the estimation of SL 50 due to the lack of other available information that could improve current management policy, despite the MCS being one of the basic and most common management measures used to avoid growth and recruitment overfishing. The main purpose of the MCS strategy is to allow fish to spawn at least once using length at maturity as a reference (Myers and Mertz 1998) and to catch fish at an optimum size for population growth (Froese et al. 2008). It would be better to base the management regulation on other elements, such as the size and age at first maturity, the weight increase curve, the critical age and size in the evolution of biomass per cohort, the analysis of the yield curve per recruit at different catch sizes, and even estimates of fecundity (Vazzoler 1979, Sparre and Venema 1992). In this ideal scenario, decision makers would be able to establish better regulation measures and increase the effectiveness of the management measures (e.g., MCS + ban). To date, this level of information is not available, so the next step would be to collect details of the selectivity of the fishing gear used to catch striped corvina and to evaluate the changes to meet the proposed MCS.
It should be noted that the individuals used in the analysis to estimate SL 50 for C. reticulatus were fishery-dependent. This is a common approach in evaluating coastal resources, as a sampling of the catches has a low cost, easy access, and can lead to broad temporal coverage (Grazia-Pennino et al. 2016). However, the fishery is geared towards catching larger individuals; therefore, there may be a bias against smaller sizes, and young individuals could be underrepresented. This bias could lead to imprecise estimates of SL 50 .
According to Birch (1999) and Trippel and Harvey (1991), size at maturity data should cover a broad size range to obtain a robust estimate. Our data included medium and large sizes; however, smaller individuals were not caught. Therefore, an in-depth literature review was undertaken to search for reports of size-based maturity stage of young individuals of this species. As this information could not be found, we chose to add a logical adjustment value, such as at size 0 cm SL (hatching), no female was sexually mature. This value was added with the intention to force the curve to reach 0 maturity at hatching length in order to be more realistic according to biological behavior. However, to prevent the added value from significantly changing the tendency of the curve, the White model (best model) was adjusted to both sets (original and the original plus our starting 0 hatching point). Finally, the residuals obtained were analyzed, and no differences were identified between them (W = 39.5, P = 0.9634); therefore, the addition of this value did not substantially change the trend of the data, but it did improve the behavior of the curve and the biological explanation.
Unfortunately, due to a lack of regional studies, no comparisons could be done between the estimates of SL 50 and those obtained by other authors for the area or the country. The only study for this species in the area is that of Musso-Solari (2011), who identified a reproductive season from April to October, with peaks in May and October. The size range we found in the present study was 28.4 to 49.4 cm TL for males and 29.9 to 49.2 cm TL for females, compared to 24 to 71.5 cm TL for both sexes in Musso-Solari (2011). Hence, the author found a notably wider size range in the same study area (Southern coast of Sinaloa) but did not examine the stage of maturity. Therefore, future studies should focus on establishing periodic monitoring of reproductive status and population dynamics that can support resource management (catch quotas or MCS).
Lastly, in relation to the literature review of the mean size at sexual maturity in the genus Cynoscion genus in several areas of the American continent, we concluded that it is highly variable, and we did not find a latitudinal pattern or a relationship between maximum size and SL 50 for each species. This highlights the importance of periodically estimating population parameters of the exploited resources.
In conclusion, as the striped corvina is increasing in commercial importance, there is still time to establish early fishery management measures to ensure its sustainable exploitation. Therefore, in this work, we propose a relatively simple fishing regulation strategy that was estimated from information easily obtained from the landings of the fishery focused on avoiding growth overfishing, promoting population growth, and, finally, systematically collecting information so that it can be re-estimated periodically to allow for an adaptive fishery management approach. The next step is to obtain more information about the resource, such as sex ratio, spawning season, fecundity, relative growth, individual growth, mortality rates, and other variables; this will eventually allow for a full stock assessment to be performed to develop active management strategies (catch quotas).


