


 nueva página del texto (beta)
 Inglés (pdf)
 Artículo en XML
 Referencias del artículo
 Enviar artículo por email
 Citado por SciELO
  Similares en
SciELO
Similares en
SciELO 
 Permalink
1. Introduction
Tropical cyclones are highly complex systems where a large variety of thermodynamic and fluid-mechanic processes take place (Emanuel, 1986, 1991; Smith et al., 2009). They play an important role as thermal balance regulators of the planet, but they can also lead to negative consequences for human settlements when they move in coastal areas and inland (Emanuel, 2005). It has been established that the energy source that powers a tropical cyclone is the thermodynamic disequilibrium that exists between the atmosphere and the ocean (Emanuel, 1991). This imbalance is not reflected in large temperature differences between air and sea water-which in the tropics is less than 1 ºC-but in low air saturation in the near surface. The evaporation of ocean water transfers latent heat into the atmosphere, without any noticeable decrease in sea surface temperature due to the high heat capacity of water. The amount of water vapor that can be extracted from the ocean is directly related to its heat content integrated from the ocean surface to the depth where the isotherm of 25 ºC is located. The intensification and decay of tropical cyclones are governed by environmental factors such as roughness (both the roughness of the ocean surface and land have an important impact on the intensity of tropical cyclones due to the stresses generated at the surface), the ocean surface temperature, and the ocean mixed layer depth (Chan and Duan, 2000).
The cycle of a well-developed hurricane was idealized as a Carnot cycle with one important difference (Emanuel, 1988). In a typical Carnot cycle, the available energy is used to perform work on the surroundings, while in a tropical cyclone it dissipates turbulently in the atmospheric boundary layer of the storm, where it is again transformed into heat. In the steady state, the mechanical energy generated is balanced with the energy dissipated by friction that occurs mostly in the ocean-atmosphere interface. It was found that an intermediate category hurricane, dissipates the order of 3 × 10¹² W, which corresponds to the energy consumed in the United States in year 2000 (Emanuel, 1991).
The part of the atmosphere that is directly affected by the planet’s surface or boundary layer is of great interest, because the winds generated in this area bring significant risks in both human lives and damage to infrastructure. The boundary layer plays an important role in the cyclone intensification process, controlling the radial distribution of linear, angular momentum and moisture in the upper layer (Smith et al., 2009; Emanuel, 1997).
The convergence of moisture within the planetary boundary layer is a primary mechanism for the organization of convection in the inner core of tropical cyclones. It is in this area where the distribution of winds determines the destructive potential of the storm. The maximum magnitude of the velocity in the boundary layer may even be larger than the speed above it, representing a great danger when hurricanes are located near the coast.
The intensity of tropical cyclones decreases and eventually dissipates when moving over land. This is mainly due to the lack of the energy coming from the latent heat of the water vapor extracted from the ocean. Although all tropical cyclones have this in common, the decay rates are variable and depend on dynamic and thermodynamic factors. When tropical cyclone landfalls, humidity is lower so the available energy decreases (Wong et al., 2008; Kepert, 2002; Tang and Tan, 2006). The hurricane structure becomes strongly asymmetric due to the discontinuity of the roughness and latent heat flux, resulting in a gradual decay as they move over land. Measurements have shown that there are significant differences in the distribution and intensity of winds and precipitation due to changing wind field at low levels of the boundary layer, induced by changes in topography (Blackwell, 2000).
Although the number of publications related to the intensity of tropical cyclones when they touch ground is considerable, most are based on empirical models (Kaplan and DeMaria, 1995; Wong et al., 2008), and those using numerical sophisticated models, where some of the important physical processes are often parameterized, produce results which are not better than those obtained by empirical techniques. Bozeman (2011) studied the influence of terrain features in the structure of the hurricane when it comes ashore. Using the Hurricane Weather Research and Forecasting (HWRF) model, he determined that this model is sensitive to three parameters: the type of parametrization used for the land area, the initial boundary conditions, and the scheme of boundary layer employed. Niyogi et al. (2016) evaluated the influence of different terrain features in the intensification of tropical cyclones using the HWRF model. If the ground temperature is low, then the cyclone dissipates faster, due to lack of heat flow that nourished the storm. When the ground temperature is relatively high, the storm is more intense and sustained longer. He noticed that although there is little latent heat flow over land, it is the total entropy which helps keeping the hurricane. Apparently on the ground, the flow of sensible heat from the surface can be strong enough to keep the hot core (Andersen and Shepherd, 2014).
This panorama shows that tropical cyclones are complex dynamic systems whose intensity is affected by different physical processes, some of which are internal, characteristic of the storm, and others involve interaction with environmental factors. To date many of the physical processes governing the phenomena of intensification and decay are not fully understood despite the appearance of new sophisticated numerical models. Foltz et al. (2018) found a weak correlation in the Atlantic basin between sea surface temperature (one of the most important parameters) and the tropical cyclone intensification rates. Higher values are obtained in the North Pacific. The best predictions for intensity are still based solely on statistical methods as the Statistical Hurricane Intensity Prediction Scheme (SHIPS), which continues to be used in operational mode at the National Hurricane Center (NHC) in the United States (DeMaria and Kaplan, 1994; DeMaria et al., 2005). In contrast, the ability to predict hurricane trajectories has increased considerably together with best observations and the development of numerical models whose error has decreased to 50% for the predictions made in the Atlantic Ocean and the North Pacific in the period 1980-2008 (Qin and Mu, 2014; DeMaria et al., 2014).
Regarding the influence of global warming, there are many publications, e.g. Emanuel (1987), Knutson and Tuleya (2004), Mousavi et al. (2011), and Duan et al. (2018). In a recent publication, Patricola and Wehner (2018) found that, relative to pre-industrial conditions, climate change has enhanced the average and extreme rainfall of some important hurricanes (Katrina, Irma and Maria), but did not change tropical cyclone wind-speed intensity. They concluded that there is a lack of consensus on whether climate change has yet affected the statistics of tropical cyclones, owing to their limited period of consistent observations. However, Bhatia et al. (2019) detected an increase of Atlantic intensification rates with a positive contribution from anthropogenic sources. Balaguru et al. (2018) found an increase of hurricane rapid intensification in the central and eastern tropical Atlantic, but without any detectable change in the western tropical Atlantic, the Caribbean Sea and the Gulf of Mexico. Gutmann et al. (2018) did numerical experiments after imposing a future climate signal by adding changes in temperature, humidity, pressure, and wind speeds. The simulations produced tropical cyclones with faster maximum winds, slower storm translation speeds, lower central pressures, and higher precipitation rates.
The intensity of hurricanes is given only from one local parameter corresponding to the maximum wind speed (Saffir-Simpson scale), regardless of other global parameters such as spatial scale (radius of outermost closed isobar) or total pressure drop (difference between the pressure of outermost isobar and the minimum central pressure). The purpose of this paper is to relate a local parameter (maximum wind) with a global parameter (pressure drop) and see their behavior using databases of hurricanes that have hit land in the area of the Caribbean.
2. Euler number
In general, tropical cyclones are governed by the basic equations of fluid dynamics, which are the equations of conservation of mass, momentum balance, and energy. It has been shown that tropical cyclones are well approximated by the gradient wind balance in the middle and lower troposphere, where the tangential wind component is higher than the radial component and the effect caused by friction can be neglected (Willoughby, 1979):
where p, ρ and v are the pressure, density and tangential wind velocity, respectively; and f = 2Ω sin φ is the Coriolis parameter, with Ω as the angular velocity of the earth’s rotation and φ the latitude. The wind gradient approximation represents the balance between the pressure gradient in the radial direction, going towards the center of the hurricane, and the resultant of the Coriolis and centripetal forces. In general, the tangential wind close to the eye of the storm grows with the radius reaching its maximum v m at a radius r m and decreases further for larger radius. Based on these values, the nondimensional variables V = v/v m , R = r/r m , and P = (p−p 0 )/(p ∞ −p 0 ) can be formed, where p 0 is the minimum central pressure of the hurricane and p ∞ is the pressure of outermost isobar. Finally, the gradient wind balance equation (Eq. 1) can be integrated along the storm radius, if the tangential wind velocity as a function of the radius is known:
where Eu = (p ∞ − p 0 )/ρ ∞ v m is the Euler number that gives a relation between a local parameter (maximum velocity) and a global parameter (pressure change of the whole storm). In Eq. (2), Ro = v m /(f r m ), is the local (at maximum velocity) Rossby number, which is very large compared with unity for tropical cyclones. Since variables are of the order of the unity, it is expected that the Euler number would be of the same order. An estimation of the integral Eq. (2) can be obtained numerically, given the tangential wind velocity as a function of the radius. In the literature different models for the tangential wind component have been developed (Holland, 1980; Jelesnianski and Chen, 1992; Emanuel, 2004; Emanuel and Rotunno, 2011). These models are based on characteristic parameters of tropical cyclones (e.g., maximum wind velocity, radius of maximum wind velocity, central and ambient pressure) and are widely used to estimate the wind field associated to a cyclonic event.
In this work, the tangential wind velocity profiles developed by Emanuel (2004) and Emanuel and Rotunno (2011) are employed, mainly because the total radius of the storm is finite. Within the set of nondimensional parameters, the previously established by Emanuel’s (2004) wind velocity profile, is given by:
where R ∞ is the nondimensional total length of the storm, and b, n, and m are empirical parameters governing the shape of the profile.
As an improvement of this model, Emanuel and Rotunno (2011) gave the following analytical expression for tangential wind velocity profile, which in nondimensional form is given by:
where the shape parameters C k and C D are the exchange coefficients of entropy and momentum, which can be assumed to be the same.
Figure 1 shows the tangential wind velocity profiles and the numerical calculations of the Euler number for two different Rossby numbers, Ro ≈ 80 and Ro ≈ 26, which could represent an intense and a weak storm. The computed Euler number resulting by the use of the first wind velocity profile (Emanuel, 2004) is Eu =1.4, whereas Eu =1.9 is obtained for the second case (Emanuel and Rotunno, 2011).
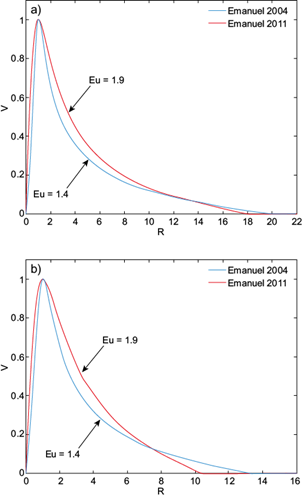
Fig. 1 Comparison of parametric wind profiles and Euler number (a) for Ro ≈ 80 and (b) for Ro ≈ 26. These values of the Rossby number could represent an intense and a weak storm with r 0 = 400 km, f = 5 × 10⁻⁵ rad s-1, v m = 80 m s-1, r m = 20 km for the former and r 0 = 400 km, f = 5 × 10⁻⁵ rad s-1, v m = 40 ms-1 and r m = 30 km for the latter.
3. Data set description and methodology
The NHC “extended best track” reanalyzed data for the Atlantic basin was used in this work. The exten ded best track data represents the best estimate of the track and intensity of tropical cyclones. The data in the extended best track dataset provides important statistics on each tropical cyclones every 6 h and contains additional operationally estimated parameters, like radius of maximum wind velocity, eye diameter, pressure, and radius of the outermost closed isobar, beginning with the tropical cyclone initial stages as a tropical depression and following all along its evolution towards dissipation (Demuth et al., 2006). One important parameter used in this study and included in the extended best track data is the distance to the nearest land, being in this case the island of Trinidad with an area of 4748 km2, the smallest portion of land considered. The list of parameters extracted from the extended best track data is the following:
Identification number
Name
Date
Eye localization (º)
Maximum wind velocity (kt)
Minimum central pressure (hPa)
Radius of maximum wind velocity (nm)
Eye diameter (nm)
Pressure of the outmost isobar (hPa)
Radius of outermost closed isobar (nm)
Radius of the 34 kt velocity towards NE, SE, SW, NW (nm)
Radius of the 50 kt velocity towards NE, SE, SW, NW (nm)
Radius of the 64 kt velocity towards NE, SE, SW, NW (nm)
Distance to the nearest land (nm)
With the extended best track data, the Euler number was obtained along the trajectory of 20 hurricanes that made landfall on the Mexican coast and the southeast coast of the USA (Fig. 2). The 20 cases of study were chosen based on the following criteria: (a) the tropical cyclone made landfall at least for 12 h, (b) there was a complete record of the distance to the nearest major landmass parameter, as well as the major number of minimum and exterior pressure measurements. The rapid intensification of tropical storms is considered when the abovementioned criteria are fulfilled. Finally, data from pressure deficit and maximum wind velocity was fitted to a simple exponential decay model for cyclonic events recorded in the Yucatan peninsula, in accordance with the following expressions (Kaplan and DeMaria, 1995):
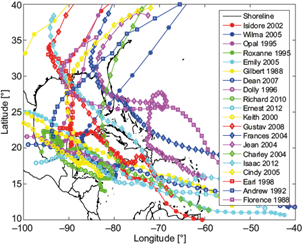
Fig. 2 Trajectories of 20 hurricanes that have made landfall at the Mexican coast and the southeastern USA.
whereby it is possible to determine the trend for the Euler number given by
In these expressions, ∆p is the overall pressure difference, v is the maximum velocity, ∆p 0 , v 0 and Eu 0 are the overall pressure difference, maximum speed and Euler number when the hurricane reaches land, t the time elapsed after the storm reaches land, and ξ and γ are decay constants. The main limitations of course are the missing data to evaluate the pressure difference. At landfall, there were many missing records. Even when there are different methods to interpolate and fulfill the missing data of the dataset, this may introduce an important bias in the analysis of the Euler number. Hence, missing data were just discarded.
4. Results
The resulting values of the Euler numbers are shown for each storm as a function of the maximum wind velocity (Fig. 3a) and from its distance from land (Fig. 3b). It can be observed that for maximum velocities exceeding 30 ms-1 and when the storms are far from the coastline, the Euler number tends to take values between 1 and 2, while over land and when the velocity decreases, the Euler number shows important variations with a tendency to grow, reaching values larger than 6.
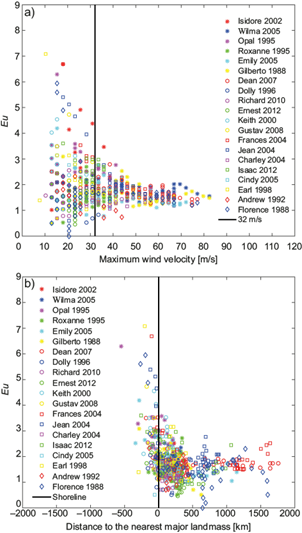
Fig. 3 The Euler parameter (Eu) as a function of the maximum speed along the path of twenty hurricanes that made landfall. (a) Euler number as a function of speed. (b) Euler number as a function of distance to the nearest land portion.
The same analysis was performed for all records contained in the extended best track database. In figure 4, the Euler number has been plotted as a function of both the maximum velocity and the distance to the nearest land portion. Here, the behavior described above for the Euler number is more evident. Over sea, when the maximum wind velocity is greater than 30 ms-1, the Euler number is conserved between values of 1 and 3, while over land its values tend to increase with decreasing maximum wind velocity, taking values between 3 and 7. This trend is also reflected in the average of the data. In Figure 5, the averages of the Euler number are recorded in intervals of 10 ms-1. It is remarkable that the average in each speed interval tends to oscillate with a maximum standard deviation of 0.7, about the mean value of 1.8, while over land the average Euler number for each speed range shows a linear increase with decreasing speed and much larger variations.
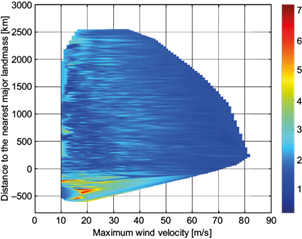
Fig. 4 The Euler parameter (Eu) as a function of the maximum speed and the distance to the nearest land portion for all database records in HURDAT (https://www.aoml.noaa.gov/hrd/hurdat/Data_Storm.html).
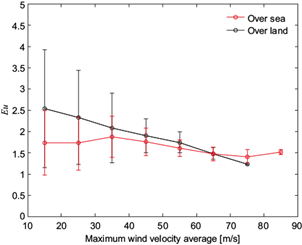
Fig. 5 Average values of the Euler number (Eu) at intervals of 10 m s-1 for all database records in HURDAT (https://www.aoml.noaa.gov/hrd/hurdat/Data_Storm.html).
A deeper analysis of the Euler number behavior over land is shown in Figure 6, where fitted curves for an exponential decay law and a tendency curve for the Euler number are presented. The computed decay constants, ξ and γ, vary significantly from case to case, with an average of 0.075 h-1 for ξ and 0.055 h-1 for γ, and a standard deviation of 0.035 h-1 and 0.020 h-1, respectively, making it clear that it is possible to make an exponential fit, but the decay depends on other parameters like the radius of maximum wind velocity, roughness and energy loss at landfall.
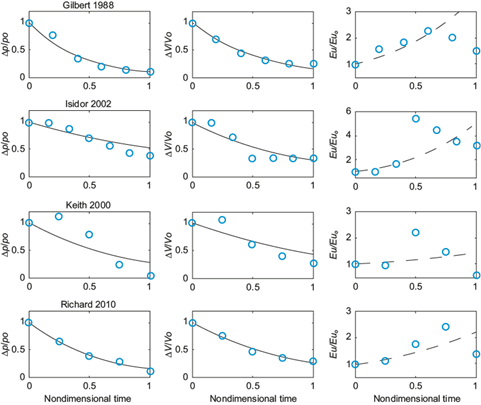
Fig. 6 Curves for pressure deficit, speed and Euler number of four tropical cyclones which enter the Yucatan peninsula. The time has been normalized to the total decay time.
It should be pointed out that despite the large variation of the decay constants ξ and γ, they are in the way coupled so that the curve for the Euler number predicts an increase when the storms are over land for all cases. For cases in which good fits are obtained, e.g. hurricanes Gilbert and Richard, the curve that predicts the behavior of the Euler number, given by Eq. (6), also fits better the data.
There are clear differences in the behavior of the Euler number when the cyclone is at sea and when it is over land, which can be explained based on the duration of the storm. When it is over sea and has reached hurricane category, the tropical cyclone evolves slowly so that it remains close to the steady state tending to keep constant the relationship between pressure drop and the dynamic pressure (Euler number). When it is over land is far from the steady state, the wind velocity rapidly goes down by the increase in friction but it takes time to be reflected in the decrease of the pressure drop, so the Euler number increases. This points directly to the question about the validity of using the gradient wind equation to represent the pressure inside the boundary layer when the cyclone makes landfall. The transient effects are essential to determine the intensity decay.
From the analysis of the Euler parameter with the data from pressure drop and wind speed of tropical cyclones that occurred in the Atlantic Ocean, it was found that over sea, when storms reached hurricane strength, the cyclone evolves slowly staying near the steady state and tending to maintain a constant Euler number (Eu ≈ 1.8). This situation is well represented by the wind velocity profile derived from potential theory of Emanuel and has been one of his main hypotheses that the cyclone is in steady state and for which Eu ≈ 1.9 was obtained. The situation is different when the storm is over land, where the Euler number varies significantly with a tendency to grow, indicating that the cyclone is far from steady state and highlighting the importance of transient states during dissipation. In this case, the use of wind gradient equations ceases to represent the behavior of hurricanes.
5. Conclusions
In this study a quantitative analysis of the Euler number has been presented using the NHC’s extended bast track database of the Atlantic basin. For tropical cyclones the Euler number relates the maximum wind velocity (local parameter) with the total pressure drop (global parameter), which are often used as an intensity measure of the storms. The calculations were performed all along the track of the tropical cyclones, including the early stages as a tropical storm and the dissipation process. Two different regimes were found depending on whether the cyclone moves over sea or over land.
Over water, when the storm has reached the hurricane category, tropical cyclones evolve slowly near the steady state and tending to keep a constant Euler number (Eu ≈ 1.8). This behavior is very well captured by the parametric wind profile of Emanuel and Rotunno (2011) (Eu ≈ 1.9). On the other hand, when the hurricane has made landfall and moves over land, the Euler number changes significantly with a clear tendency to increase to values of about 6. This sharp increment on the Euler number indicates the transition to a very strong transient state. The maximum speed decreases rapidly while the pressure drop is maintained for a while. This induces a radial velocity component which destroys the gradient wind condition. Under global warming, an increase is expected of the frequency and/or intensity of tropical cyclones. However, the corresponding Euler number must be invariant because it relates two parameters which increase at the same time. The transition to an extratropical storm was not considered in this work. It is difficult to include this transition based on the same parameter analysis due to the important differences between tropical and extratropical storms' characteristics. Basically, the area covered by the present study is shown in Figure 2 of the manuscript.

