1. Introduction
Ruminants produce large amounts of methane gas (CH4) by microbial fermentation of carbohydrates in the rumen, which is eructated to the environment, thus contributing to global warming (Beauchemin et al., 2020). Methane is one of the main greenhouse gases (GHG) with a global warming potential 28 times (in a 100-year time horizon) that of carbon dioxide (CO2) and a lifetime in the atmosphere of 12.5 years. It is estimated that 36 % of the methane emitted into the environment arises from the livestock sector (Ruiz-Suárez and González-Ávalos, 1997; Bonilla-Cárdenas and Lemus-Flores, 2012). Due to this, there is growing interest for mitigating methane emissions arising from ruminant production at a global level (Patra and Yu, 2014; Leng, 2014). There have been few studies in Mexico (e.g., Piñeiro-Vázquez et al., 2017) in which methane emissions have been measured under in vivo conditions in cattle. Most studies in Mexico have used a modeling approach based on the Intergovernmental Panel on Climate Change procedures in order to estimate methane inventories for the national herd (Rendón-Huerta et al., 2014; Beltrán-Santoyo et al., 2016). Castelán-Ortega et al. (2014) estimated that total enteric CH4 emissions in 2007, from the 23.3 million heads of cattle in Mexico, was approximately 2.02 Tg per year.
The instrumental accuracy in any system designed to measure gaseous exchange in domestic animals must not overestimate or underestimate measurements. Open-circuit respiration chamber methodology is the most precise method for measuring enteric methane emissions (Gerrits and Labussière, 2015). This technique involves an animal being introduced into chambers and outside air, which is passed through the chambers. Measurements are taken of the differences in concentrations of gases (CO2, O2, CH4) in the incoming and outgoing air (Grainger et al., 2007; Machado et al., 2016). The appropriate calibration of respiration chambers is a necessary step for accurately measuring methane emitted by cattle, in order to prevent underestimating or overestimating methane emissions that may bias the national inventories (Gardiner et al., 2015).
In Australia, Charmley et al. (2016) called the attention to the overestimation of 30% in CH4 measurements in cattle that consumed tropical forages while Kurihara et al. (1999) and Hunter (2007) mentioned that this error was due to the use of an algorithm that introduced an incorrect chamber volume. Therefore, after a correction, the authors re-analyzed the Australian enteric methane inventories from cattle which resulted in a significant downward revision of the emissions arising from cattle fed tropical pastures (Charmley et al., 2016).
The Laboratory of Climate Change and Livestock Production at the Faculty of Veterinary Medicine and Animal Science of the University of Yucatan (LACCLIGA-FMVZ-UADY), Mexico is actively working on the design of strategies to mitigate methane emissions in cattle and sheep. Therefore, steps are being taken to improve the accuracy of the determination of methane emission factors from cattle and sheep fed with tropical pastures. No previous attempts have been carried out in Mexico to assess the accuracy of a respiration chamber facility designed for cattle. The objective of this study was the validation of the respiration chambers for measuring enteric methane emissions in cattle at LACCLIGA-FMVZ-UADY, Mexico.
2. Materials and methods
2.1 Calibration test
Respiration chambers were tested for accuracy following the procedures described by Gardiner et al. (2015), namely evaluating the response time, the stability of the plateau and the linearity of each section of the system (methane analyzer, air extraction ducts, and the chamber itself).
The methane analyzer was calibrated comparing the reference concentration with the average concentration of the equipment during 5 min of readings made after 3 × T90.
Respiration chambers and the air extraction ducts were gravimetrically calibrated (Cammell et al., 1981) by releasing high purity methane, expressed as the coefficient (calibration factor) between the weight of the recovered gas (g) and the weight loss of the cylinder (g). A precision balance (30 000 ± 0.1 g) (Kern & Sohn, Balingen, Germany) accurately measured weight loss from the gas cylinder. Gravimetric calibration of the whole system was completed before any methane measurement in cattle was performed.
2.2 Chamber characteristics
Open-circuit respiration chamber methodology is a precise approach to determine enteric methane emissions in vivo in ruminants (Pinares and Waghorn 2014; Gerrits and Labussière 2015). Respiration chambers consist of three main components: the chambers, the ducting and flow system, and the infrared methane analyzer (Fig 1). A full description of the construction and operation details of the respiration chambers can be found in Canul-Solís et al. (2017).
2.3 Calibration of the infrared methane analyzer
The methane analyzer (MA-10; Sable Systems International, Las Vegas, NV, USA) was assessed for efficiency, accuracy, linearity (R2), response time and plateau variability by injecting methane gas from reference cylinders of known concentration. A methane calibration standard containing 991 ± 0.30 µmol/mol (Praxair, Tultitlán, State of Mexico, Mexico) was obtained. Nitrogen gas with a concentration of 100% (Praxair) was used as negative methane for zeroing the methane analyzer. Ambient air and the reference gas were injected successively, controlling the flow with a rotameter at 0.02 L min-1 and pressure of 0.5 bar, which allowed the analyzer to measure sample air without interrupting the flow.
For calculations, 12 independent methane injections were made, and records were taken every 10 s. The injection of reference methane gas started 225 s after the recording of the air samples began and ended at 600 s. The basal methane concentration was determined by injection of ambient air, taking readings for the first 225 s. A linear calibration function for the analyzer was obtained by carrying out a linear regression between the analyzer readouts and methane reference values. The analyzer response time (T90) was defined as the time taken to reach 90% of the final stable plateau reading when the sample was changed from ambient air to reference gas. T100 was defined as the time it took to reach the baseline after stopping the injection of the reference gas (in accordance with the EN 15267-3:2007 standard [CEN, 2007]). Plateau variability was defined as the 1σ (standard deviation) noise level on the stable plateau reading (as a percentage of the plateau value) measured for 1 min (Gardiner et al., 2015). The calibration factor was calculated by dividing the concentration of the reference cylinder provided by the commercial dealer (991 ± 0.30) by the average concentration recorded by the methane analyzer during 5 min of readings made after 3 × T90. The same concentration was used to measure the response time of the analyzer and the stability of the plateau. The linearity of the analyzer response in the measurement range is given by the coefficient of determination (R2) of the linear regression. The methane analyzer reading limit is 10 000 µmol/mol, therefore, four different concentrations of methane injected into the methane analyzer were: 991 ± 0.30, 2508 ± 75, 5036 ± 151, and 7495 ± 225 μmol/mol. The methane analyzer reading had an upper range of 10 000 µmol/mol, with traceability certified to an uncertainty of 0.3% (coverage factor of k = 2). For the assessment of linearity, 10 independent methane injections were made for each concentration of methane gas described above, and these consisted in methane measurements carried out every 10 s. The reference methane gas injection started 300 s after the recording of air samples began and ended at 900 s.
2.4 Methodology for calculating the efficiency of gas extraction from ducts and respiration chambers
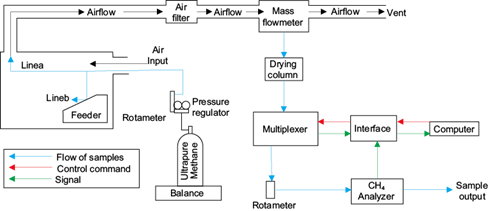
The efficacy of the ducting was tested by directly releasing a reference methane gas emission with a known volume inside the duct near to the interface with the chamber, to determine the losses when extracting the methane gas from the respiration chambers (Fig. 2, line a). High purity methane containing 99.97 µmol/mol of methane was released from a cylinder and adjusted to a pressure of 60 Kpa with a regulator, while the flow was adjusted with a rotameter at 0.25 L min-1, in order to simulate methane emitted by cattle with an air extraction rate of 450 L min-1, allowing the simulation to run for 24 h of measurements. Gas recovery calculations were performed with a registry from records taken every 30 s. Ambient air was injected during the first 4 min, then the high purity methane was released at the air inlet of the air extraction pipe for 40 min. The efficiency of gas recovery was calculated with the amount of methane (g) gravimetrically obtained (Cammell et al., 1981), considering a methane density of 0.7162 g L-1 (Lighton 2008), and the amount detected by the measurement system (analyzer). Conditions during the recovery tests were kept constant at a temperature of 25 ºC, relative humidity of 55%, flowrate of 450 L min-1 and a slight negative pressure of around 400 Pa below atmospheric pressure, which is considered appropriate for adult cattle.

Fig. 2 Scheme of the gas supply system used to test the efficiency and accuracy of the respiration chamber and the whole system.
Calibration factors of the extraction ducts of each chamber were thus calculated in isolation from the chamber itself, taking into account losses from the methane analyzer. For the last component (empty chamber), high purity methane (99.97 µmol/mol) was released inside the chamber at a height resembling the head of a cow (n = 7 runs for chambers 1 and 2 (n = 5 runs for chamber 2). The amount of methane released into the chamber (Fig. 2, line b) was captured by the sampling system every 5 min. The calibration factor was then calculated for the chamber alone, after discarding losses from the analyzer and in the air flow of the air extraction duct (cumulative errors). The methane gas was released 5 min after starting the recording of the air extraction samples up to 4 h. The conditions were the same to calculate the efficiency of the air extraction ducts. This allowed the evaluation of methane recovery efficiency from the respiration chamber in isolation from other factors. At this stage, the calculation of the calibration factor of the complete system was also achieved.
For both (ducting and chamber) methane recovery procedures, the basal concentration was determined before starting the release of high purity methane. Response time (T90) was defined as the necessary time to reach 90% of the stable plateau readings, when high purity methane was released, and T100 was the time that it took for the readings to return to a basal concentration when the release of high purity methane stopped (closing of the cylinder). Plateau variability was considered as the percentage of noise level (1σ) of the stable readings during the 10 min period for the ambient air flow and 30 min for the chamber. The effective precision of the measurements in 24 h, which arises from the reduction in measurement noise, is the result of averaging N independent measurements, given by S/N½, where S is the plateau variability and N is the number of independent measurements of the volume of the fiberglass cow.
3. Results and discussion
3.1 Calibration of the infrared methane analyzer
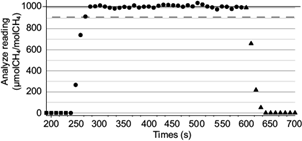
The calibration factor for the methane analyzer (after 12 runs of methane release [991 µmol/mol]) was 1.022 ± 0.014, with a plateau variability of 1.48%. The response time (T90) was 39.33 ± 3.85 s (discarding the first 225 s for the passage of the air samples), while the return time (T100) was 50 s. In the measurement range of the methane analyzer, the response was linear (y = 0.922x + 0.053) with a coefficient of determination (R2) greater than 0.9994 for all runs (after injecting methane standards concentrations [2508 ± 75, 5036 ± 151 and 7495 ± 225 μmol moL-1]). These results are similar to those described by Gardiner et al. (2015), except for plateau variability, which is likely due to the fact that methane gas cylinders (this study) had a greater variability in methane concentration (uncertainty) than the cylinders used in the six laboratories evaluated in the UK (0.11 ,0.96, 0.34, 0.63, 057 and 1.01%), and recordings were slightly less stable (as shown in Fig. 3). The obtained calibration factor data support the specifications of accuracy claimed by the manufacturer of the methane analyzer (0-10% range and 0.0001% resolution), which has enough sensitivity for accurately measuring methane gas in air samples (these data are similar to the results of Gardiner et al. [2015]).

Fig. 3 Methane analyzer response to ambient air and reference gas (methane 991 ± 0.30 µmol/mol) registered every 10 s. (black dots: reference gas (methane); black squares: ambient air; solid line: plateau readings; dotted line: 90% value readings at plateau; black triangles: closing of the reference gas injection).
3.2 Ducting efficiency
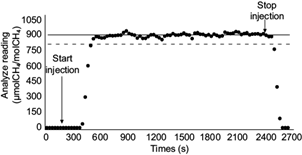
Figure 4 shows the curve of methane recordings every 20 s (air extraction duct of chamber 1). Table I displays the results of the ducting efficiency for each chamber. Plateau variability represents the noise level (instrument, chamber) in the stable reading of the plateau (as a percentage of plateau value), response time T90 represents the time from basal concentration up to 90% of the stable plateau and T100 is the time to return from plateau variability to basal concentration after stopping the injection of high purity methane from the cylinder.

Fig. 4 Response of analyzer to continuous injection of high purity methane at the interface between chamber and duct from 5 to 40 min. The solid line shows readings at plateau and the broken line represents values at 90% of readings in the plateau.
Table I Response of the methane analyzer to the injection of high purity methane in each of the air extraction ducts of the two chambers (calibration factor and its associated uncertainty, variability of stable readings and response time at T90 and T100).
| Efficiency | Plateau variability % | T90 response (s) | T100 response (s) | |
| Ducting chamber 1 | 0.90 ± 0.04 | 2.09 | 96.15 | 240.55 |
| Ducting chamber 2 | 1.02 ± 0.05 | 2.01 | 153.35 | 260.35 |
Results of the air extraction efficiency of the ducts of each chamber are influenced by losses of methane in the air flow through dust filters (one paper filter for each chamber), bends of the duct (four in each chamber), the possible effect of the length of the duct (distance from chamber to analyzer: 7 and 12 m for chamber 1 and 2, respectively), duct diameter (40 mm), and roughness of the duct surface (polyvinyl chloride). All the factors mentioned above also affect the response times t 90 and t 100, which increased as shown in Table I. These factors act by restricting the homogenous mixing of high purity methane injected at the chamber-duct interface. The mass flow generator allowed the adjustment of the flow, the sampling of the air, and the injection of high purity methane inside the duct, isolating it from the chamber itself, rendering irrelevant the correction for density, temperature and relative humidity of the air sample, assuming that the final methane emission rate is reported as a mass flow (Lighton 2008). Results of the ducting efficiency show that the greatest source of uncertainty in the system lies in the flow measurement in the duct from the chambers to the methane analyzer when comparing the efficiency of each component. This agrees with results previously reported by Gardiner et al. (2015) between 1.02 and 0.85 in the air extraction system (duct).
3.3 Chamber efficiency
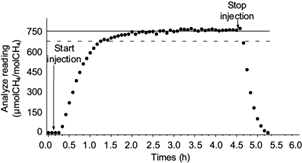
Figure 5 shows the curve of high purity methane released every 5 min (chamber 1). Table II shows the results of the plateau variability, the response time T90 and T100 for both chambers, described in section 2.4 Gardiner et al. (2015). reported plateau stabilities of 1.33, 1.63, 11. 00,4.27, 20.7 and 2.70% and T90 of 40:39, 21:58, 01:13, 09:00 27:42, and 54:05 (minutes:seconds) in six research establishments in the United Kingdom.

Fig. 5 Response of analyzer to continuous injection of high purity methane at the interface between the chamber and the duct from 5 min to 4.7 h. The solid line shows readings at the plateau and broken line represents values at 90% of plateau readings.
Table II Results for response tests of the respiration chambers (calibration factor and its uncertainty, variability of the stable readings, response time at T90 and T100, and average precision of extrapolated measurement at 24 h)
| Efficiency | Plateau variability (%) | T90 response (min) | T100 response (min) | Precision at 24 h average (%) | |
| Chamber 1 | 1.03 ± 0.05 | 2.01 | 58.27 | 37.46 | 0.70 |
| Chamber 2 | 0.99 ± 0.02 | 2.16 | 64.31 | 48.52 | 0.79 |
Chamber volume and exchange air flow showed slower response times T90 and T100 than the duct with a smaller volume, which smoothed any possible variation in the short-term, allowing a more stable plateau. According to data in Table II, the variability of the plateau for the chambers fluctuated between 2.01 and 2.16%, while for the pipeline (Table I) it fluctuated between 2.01 and 2.09%.
3.4 Respiration chamber response
After releasing high purity methane, the calibration factors for respiration chambers 1 (n = 7 runs) and 2 (n = 5 runs), with a volume of 9.8 m3, were 0.95 ± 0.05 and 1.03 ± 0.03, with uncertainties of 4.87 and 2.49%, respectively, and a confidence level of 95%. Before this validation exercise, the uncertainty of methane recoveries was unknown at this laboratory. These results demonstrate that the chambers can accurately measure enteric methane emissions in cattle. The calibration factors for chambers are comparable to those reported by Gardiner et al. (2015) for 22 respiration chambers in the United Kingdom designed to hold both sheep and cattle of up to 550 kg live weight. Those chambers varied in air volumes, which affected the response time, plateau variability, and precision at 24 h, as shown by Hau et al. (2010), Murray et al. (1999) and Hellwing et al. (2012) in chambers with volumes of 0.78, 2.4 and 17 m3 and recovery factors of 99.7, 92.6 and 98.5%, respectively. In the present study, basal concentrations of methane (before releasing the reference gas, and after finishing its injection) in ambient air were considered to be negligible; therefore, they did not bias the recovery readings (Lachica et al. 1995; McLean and Tobin 2007). It has been claimed that the presence of a cow inside a respiration chamber may potentially influence the results due to inhomogeneous mixing of the air inside the chamber (McLean and Tobin 2007; Gardiner et al., 2015). In order to address this issue, a fiberglass cow of a similar size to a real one (Holstein), was introduced into the chambers for methane recovery tests. The results of these tests showed that the volume occupied by the dummy cow did not prevent high purity methane gas to homogenize efficiently, giving an average calibration factor of 1.05 ± 0.02 (chamber 1), a plateau variability of 1.99% and an uncertainty of 2.31% after three consecutive runs. It appears that the small fan fitted inside the chamber (in the corner of the ceiling) exerts enough wind force to induce good circulation of the air inside the respiration chambers. These results further demonstrate that the whole system works well and can recover most of the high purity methane released inside the chambers. The fiberglass cow trial showed that an inert body inside the chamber has no effect on methane recovery values and adds to the confidence in the results obtained at this facility.
Measurements with cattle inside the chamber showed that methane production varied during the whole period of measurement (23 h) showing maximum peaks of methane production at around 5 h postprandial (Cavalcanti et al., 2013). This generally followed the kinetics of rumen fermentation of the carbohydrate (cellulose, starch) consumed.
To the authors knowledge this is the first comprehensive calibration of respiration chambers for validating the accuracy of methane recoveries carried out in Mexico.
4. Conclusions
These series of calibration and gas recovery tests for the methane analyzer, the ducting system and the respiration chambers, have demonstrated that the chamber system is completely leak-proof and the methane analyzer has a quick response time, as demonstrated by the high values of pure methane recoveries and low uncertainties for chamber percent recoveries. Respiration chamber methodology is an accurate procedure to quantify enteric methane emissions in vivo from cattle.


 nueva página del texto (beta)


