1. Background
Publications on urban atmospheric humidity are fewer in quantity and much more recent than those on urbanization effects on atmospheric temperature, according to various authors throughout the years, and recently reiterated by Oke et al. (2017, chpt. 9), Unger et al. (2018 a) and Yang et al. (2020). Table SI in the supplementary material of the present paper is a compilation on the subject, reporting 46 papers published in more than five decades (1967 to 2021), less than one per year in average. As can be seen, the subject has not been trendy but is still relevant.
Figure 1a shows that more than 30% of the papers were published in the first decade of the 21st century; in the whole period (Fig. 1b), two thirds have been focused on middle and high latitudes, and two thirds on cities with more than 500 000 inhabitants (Fig. 1c). In 25% of the papers the hygrometric variable used (Fig. 1d) is relative humidity (RH), in 33% some variable measuring atmospheric vapor concentration (vapor pressure, specific humidity, mixing ratio, absolute humidity or dew point temperature) is utilized, and in the remaining 42% both variables are employed. Therefore, obtaining conclusions is not easy since the publications are very disparate in terms of geographical area, size of the cities and humidity variables analyzed (Oke et al., 2017). Moreover, in the appendices of 25% the articles the results clearly indicate an excess of urban moisture; another 25% report moisture deficits in the city, and the remaining 50% show that one situation occurs in certain periods and the opposite occurs in others.
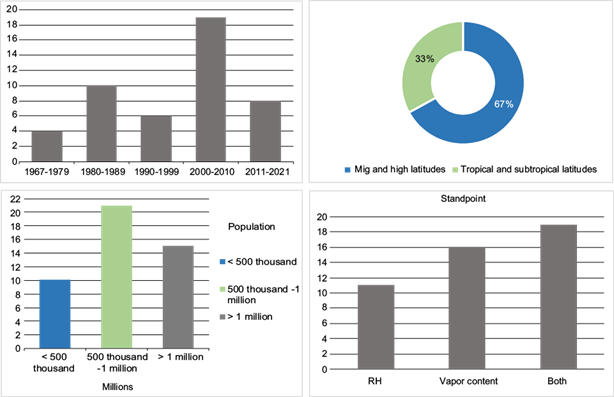
Fig. 1 Distribution of the research papers mentioned in Table SI of the supplementary material, according to (a) decade of publication, (b) latitude, (c) number of inhabitants of the corresponding cities, and (d) hydrological variable used (relative humidity [RH]) or vapor content)
The summarized results in Table SI are important contributions to the understanding of urban hygrometry, but only some of the most useful theoretical considerations for this paper will be highlighted.
The pioneering work of Chandler (1967) addressed humidity in the English city of Leicester, with 270 000 inhabitants at the time. He found that wind, temperature, cloud cover, evaporation rate, land use, and the size and occupancy of the city played important roles in the diurnal cycles of humidity variations. During the night, absolute humidity was higher in the city, while RH was always most of the time. However, the conclusions were not definitive due to the uncertainties of the measurement equipment, which propagated to the evaluations of the hydric differences among different environments.
Ackerman (1987) studied humidity contrasts in Chicago (3 000 000 inhabitants at the time) by comparing humidity data from urban and rural stations. He acknowledged that no single humidity variable is perfect for describing the phenomenon; for example, vapor pressure is a direct measure of humidity content in the atmosphere, but as air can hold less moisture at low temperatures, small differences in humidity during the cold season tend to be hidden, while RH is inversely dependent on temperature. Therefore, its behavior is strongly influenced by the urban heat island. Adebayo (1987) recognized that although the best variable to describe the effects of the city on atmospheric water vapor is not necessarily RH, its analysis is useful because of its implications for human health, comfort, and energy consumptions; thus, he used it to describe the case of Ibadam, Nigeria, and found that urban RH is lower by 2 to 10 percentage points (pp) relative to rural surroundings.
The research by Holmer and Eliasson (1999) on the Swedish city of Göteborg (approximately 600 000 inhabitants) has an original focus since they looked, with data from four years (1988, 1989, 1990, and 1994), for the impact of urban moisture excess on the urban heat island, particularly by the effects of water vapor on the longwave radiation balance and the latent heat fluxes between the surface and the atmosphere. They found that in warm summers with low precipitation the urban excess of vapor pressure was 3 hPa, while in other conditions it was only 1 hPa, and during several nights the urban moisture excess reached 7 hPa. Such anomalies were positively correlated with the intensity of the urban heat island, with the maximum of the island preceded by 2 to 5 h of maximum urban moisture excess.
Using vapor pressure, Unger (1999), Unger et al. (2018b) found that the Hungarian city of Szeged (approximately 150 000 inhabitants) was more humid almost the whole year during daytime, mainly due to artificial sources of urban humidity, which he analyzed though a dryness index. In contrast, through transects, Cuadrat et al. (2015) statistically related the urban dry island in the Spanish city of Zaragoza to geographical factors such as topography, land cover, and reflectivity from satellite images as well as prevailing wind patterns.
One of the most recent and diligent works is the one by Yang et al. (2020), who compared eight different local climate zones (Stewart and Oke, 2012) in the city of Nanjing, China (approximately 7 000 000 inhabitants). They confirmed that the phenomenon is complex, as it depends on many factors such as synoptic conditions, urban morphology, thermal configuration of the city, vegetation and impervious canopies, water bodies, industrial water use, advection, cloud cover, turbulent anthropogenic moisture transfer, and single precipitation events. They affirmed that hygric fields cannot be discussed independently from thermal fields, and they found the nocturnal heat island is related to RH deficits and specific humidity excesses.
Oke et al. (2017, chpt. 9) remark on how limited the literature on the subject is, as mentioned above, and the difficulty of comparing studies using different humidity variables. According to the literature reviewed, the conclusion obtained by these authors is that the hypothetical causes of urban moisture excesses or deficits are not entirely clear for any city. They state that in middle and high latitudes during summer there is an urban moisture deficit in the diurnal period and an excess during the nocturnal period. The first one is mainly the result of a lower vapor pressure in the city due to its higher impermeability, which is exacerbated by a higher vertical transport and mixing in cities (due to their higher roughness and thermal turbulence) that enhance exchanges between near-surface air and drier air above the canopy (urban, suburban, or rural). At night, the urban moisture excess probably results from the decrease in dew formation due to the urban heat island and anthropogenic water vapor emissions.
Through a review of half a century of research on urban climates on (sub)tropical regions, Roth (2007) found a relatively small number of mostly descriptive studies that do not address the physical causes of urban climate phenomena. He considers that cities produce their own climates connected to the rest of the climate system by atmospheric chemistry and radiation balance, and that moisture in urban areas depends on artificial water supplements in the city, playing an important role in urban-rural differences in temperature and atmospheric humidity.
The research by Jáuregui and Tejeda (1997) on the subject is the only one in Mexico. They found that Mexico City presented a lower specific humidity than its rural or suburban surroundings, but in some cases these differences were around the magnitude of the instrumental uncertainty, so they cannot be considered as conclusive.
2. Study areas
This paper compares the urban effects on atmospheric humidity in two Mexican metropolitan areas, both tropical highlands: Guadalajara and Puebla. In Mexico, a metropolitan area is defined as an urban concentration of complete municipalities in a single unit that share a central city and are highly functionally interrelated, or an urban center with more than one million inhabitants even if it has not exceeded its municipal limit, or cross-border urban centers with more than 250 000 inhabitants (SEMARNAT, 2020). Since the study areas do not cover the total surface of the officially called metropolitan areas, but exceed the limits of the cities that give them a name, and for the sake of conciseness, in this article they will be called metropolis of Guadalajara and Puebla, or simply Guadalajara or Puebla.
To classify urban, suburban, and rural environments, the study areas were selected according to their distance from the metropolis center. While the urban zone in Puebla is located inside the so-called historical center, in Guadalajara it is 5 km away. Both suburban areas are located within the periphery of the metropolises.
Since both metropolises have expanded without strategic urban planning and have mostly grown horizontally, structures and building materials between urban and suburban environments do not differ significantly. Differences can be seen in the metabolism of each zone with variations in land use, building density and vehicular flow rates with saturations at different hours of the day. In addition, vegetations present differences in their densities and dimensions with a higher presence in the urban area because of irrigation use. Rural zones are located outside but within the immediate vicinity of the metropolis limits, with agricultural land and buildings scattered over wide areas.
Both metropolises are poles of industrial development, with millions of inhabitants. Their main geographic similarities and differences can be seen in Table I, and a comparison of their climate conditions is shown in Table II. They are comparable in terms of geographic location, population, and climate, although Guadalajara has a larger population and is warmer; however, both have similar annual averages of RH and rainfall. The similarity in geography and size shared by both metropolises, and the humidity variables analyzed, allow for comparisons of their hygric behaviors (Oke et al., 2017).
Table I Approximate location of the studied metropolises.
| Metropolis | Latitude N | Elevation (masl) | Proximity to the coast (km) | Population (millions) | Land area (km2 × 1000) | Inhabitants per km2 |
| Guadalajara | 20.70 | 1578 | 190 of the Pacific Ocean | 5.3 (IIEG, 2021) | 2.6 (Gobierno del Estado de Jalisco, 2020) | 2145 |
| Puebla | 19.01 | 2140 | 190 of the Gulf of Mexico | 3.2 (Gobierno del Estado de Puebla, 2022) | 2.4 (IMPLAN, 2021) | 1431 |
| Average | 19.8 | 1859 | 190 | 4.3 | 2.5 | 1788 |
Table II Climatological normals (1991-2019)*.
| Guadalajara | Puebla | |
| Mean annual temperature (ºC) | 20.3 | 17.3 |
| Annual total precipitation (mm) | 940 | 911 |
| Mean annual relative humidity (%) | 61 | 58 |
| Precipitation during May-October (%) | 94 | 90 |
| Coldest month (average of minimum temperature [ºC]) | January (6.6) | January (5.6) |
| Warmest month (average of maximum temperature [ºC]) | May (33.3) | April (27.8) |
*Data source: For Guadalajara (station 14065), https://smn.conagua.gob.mx/tools/RESOURCES/Mensuales/jal/00014065.TXT, and for Puebla (station 21065) https://smn.conagua.gob.mx/tools/RESOURCES/Mensuales/pue/00021065.TXT (accessed on 2022 March 20).
Around the middle of the last century, Puebla’s population began to increase rapidly, as shown in Figure 2, currently being of approximately 3.2 million inhabitants. Over the last eight decades the population growth of Guadalajara has exceeded that of Puebla (Fig. 2).
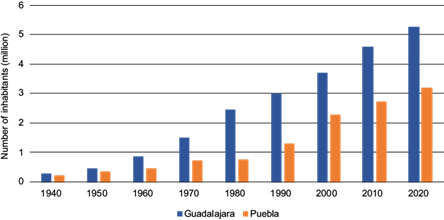
Fig. 2 Number of inhabitants of the metropolises of Guadalajara and Puebla from 1940 to 2020, according to data from the population and housing censuses carried out by IIEG (2021) and IMPLAN (2021).
2.1 Guadalajara
The Metropolitan Zone of Guadalajara is the third most populated in Mexico, with a population of 5.3 million inhabitants and the third in relation to its concentration of industrial production, which makes it the most important industrial center in western Mexico.
Settled above the Atemajac Valley at an average elevation of 1578 masl, Guadalajara has sub-humid temperate climate conditions (López-García and Márquez-Azúa, 2018). In general, the area is predominantly flat with some undulations. La Primavera forest, located to the south-southwest, is the most important forested area within the metropolis. The Chapala lake, which is located 40 km to the south-southeast from the metropolis, is the largest in Mexico with 112 km2 (Table I and Fig. 3a).
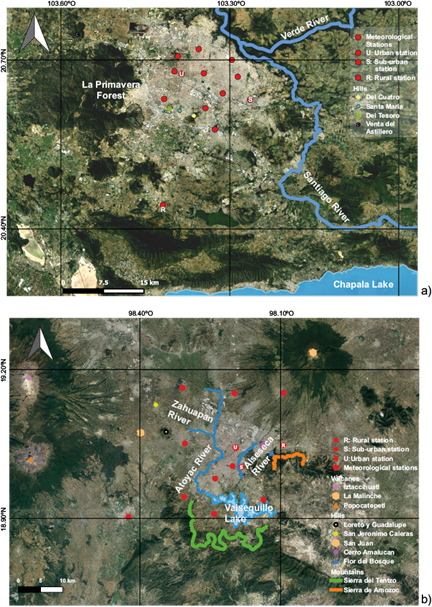
Fig. 3 Meteorological stations used to elaborate iso-hygro maps. (a) Guadalajara: IAM (urban), Loma Dorada (suburban), Tlajomulco (rural). (b) Puebla: DIAU (urban), Lomas del Mármol (suburban), Chachapa (rural).
The northern and northeastern boundaries of the metropolis are the Huentitán-Oblatos canyon, where the Verde and Santiago rivers flow. The U-shaped chain of hills to the west-southwest, formed by El Cuatro (with an elevation of 282 m above the Guadalajara average of 1578 masl), Santa María de Tequepexpan (132 m) and del Tesoro (150 m), and the Venta del Astillero mountain range (its highest point at 372 m above the average level of the city) to the west, determine the behavior of local winds (Davydova-Belitskaya et al., 1999).
For the period 1996 to 2017, López-García and Márquez-Azúa (2018) found for Guadalajara that the months with fastest wind speed are March, April, and May with averages of 4.1 m s-1. September, November, and December presented the lowest average speed of 2.2 m s-1. According to the hourly pattern, weak gusts occur around 8:00 LT (less than 2.0 m s-1), increasing to the highest values between 18:00 and 21:00 LT (greater than 4.5 m s-1). For the period 1994-1996, Davydova-Belitskaya et al. (1999) identified that west winds dominate in the dry season of the year (November-April) and east winds dominate in the rainy season, a fact that was also found by García et al. (2014) for the period 2001-2010. To provide a more detailed description of the wind circulation in Guadalajara, 2016 was analyzed at three stations (Table III) used for this article. For winter (December, January, and February), from midnight to dawn, winds from the southeast dominated; after dawn, during the mornings, those from the east dominated; in the afternoons the dominant wind was from the west and, from nightfall to midnight, from the south. Throughout most of the spring (March, April, and May) southwesterly winds prevailed, except at night, when there were mostly westerly winds. During the six-month period from June to November the prevailing winds had an easterly component from midnight to before sunset, and from then until midnight, the wind had a westerly component.
Table III Characteristics of the urban, suburban, and rural meteorological stations used in this work (geographical coordinates, height of sensors above street, height of roughness, land use, and waterproof surface).
| Latitude (º), longitude (º) and elevation (masl) | Height of sensors above street (m) | Height of roughness (m) | Land use | Waterproof surface (%) | |
| Guadalajara | |||||
| IAM (urban) | 20.67555 -103.38583 1583 | 8 | 0.75 | Residential | 80 |
| Loma Dorada (suburban) | 20.62917 -103.26389 1648 | 8 | 0.38 | Residential | 80 |
| Tlajomulco (rural) | 20.44222 -103.419 1566 | 7 | 0.05 | Services and agricultural | 10 |
| Puebla | |||||
| DIAU (urban) | 19.04365 -98.196396 2153 | 15 | 1.58 | Residential | 85 |
| Lomas del Mármol (suburban) | 19.00346 -98.183563 2131 | 8 | 0.24 | Residential | 75 |
| San Salvador Chachapa (rural) | 19.04745 -98.093872 2279 | 8 | 0.11 | Agricultural and services | 20 |
2.2 Puebla
The economy of Puebla is based on the processing and manufacturing industries, particularly the manufacture of transportation equipment, followed by the food industry, and retail trade (42, 6, and 6% of the regional gross domestic product, respectively), concentrated in the urban and peri-urban areas, while the services sector occupies most of the city’s population. The topography is flat at an average elevation of 2140 masl, with a slight slope in a northeast-south direction of less than 3.5% (Fig. 3b). This evenness is only interrupted by low hills such as Loreto-Guadalupe, San Juan, and San Jerónimo Caleras in the northwest of the city. Important elevations also flank the city: Popocatépetl (5436 masl) and Iztaccíhuatl (5215 masl) volcanoes to the west, and La Malinche volcano (4461 masl) to the northeast, with a series of small mountain ranges (Galicia-Hernández, 2014).
The orographic conformation of the valley contributed to the formation of a hydrological system that includes a framework of groundwater flow beneath the surface slopes, which provides water for agricultural, industrial, and urban use. To the south of the urban area is the artificial lake of Valsequillo into which the Atoyac river flows, crossing the city from north to south, together with other tributary rivers such as the Alseseca to the east and the San Francisco in the central area, which is currently piped and used as drainage (INEGI, 2019).
The main sources of moisture in the area are narrow strips that follow the course of surface streams. There is also a natural protected area, Cerro de Amalucan, which is enclosed by buildings, bodies of water, cemeteries, and sports facilities, usually irrigated, especially during the dry season (see Fig. 3).
Regarding the winds in the Puebla valley, Balderas-Romero (2018) found that frequently there is calm during the night and morning until noon; between 12:00 and 18:00 LT the maximum winds are between 4 and 8 m s-1. The maximum average speeds occur in April and October. The winds are characterized by symmetrical behavior: breezes from the north at night and winds from the south during daytime, with a brief period in the early evening when winds enter the valley from the east, i.e., katabatic winds (from the north) are present from 0:00 LT in winter and from 2:00 LT in spring, until 9:00 or 11:00 LT. Anabatic (south) winds start one or two hours before noon and persist all afternoon until one hour after sunset, with southerly breezes generated by the heating of the air at the bottom of the valley, contributing in the humid period to the formation of convective clouds. In the first part of the night an easterly current predominates, which is channeled towards the city through the bottleneck formed between the slopes of La Malinche and the Amozoc mountain range, and between these and the Tentzo mountain range (Fig. 3b).
3. Data and methods
The thermohygrometric data correspond to 2016, because this year had the most complete databases from the recent decade, with Puebla having 99% and Guadalajara having 96% of useful data. In 2016, the three phases of the Southern Oscillation took place, according to the NOAA Climate Prediction Center (weak to moderate El Niño for the first four months, neutral El Niño for the next three months and weak La Niña for the last five months) (NOAA, 2022), so the results that will be described later not necessarily correspond to one of the phases. It is important to remember that the objective of the present paper is to detect urban atmospheric moisture deficits or excesses, at the limits between the canopy and the boundary layer, in comparison to the peri-urban or rural surroundings. Therefore, the present study focuses on a local scale with the hypothesis that atmospheric phenomena on a larger scale -meso, synoptic, or global- affect the entire area comprising each metropolis in the same way.
Between the 1991-2019 climatological normals and the monthly hygric (Fig. 4) and pluvial conditions (Fig. 5) during 2016, there were no important differences in either metropolis, so the results of the 2016 analyses may be considered as typical of the respective local climates.
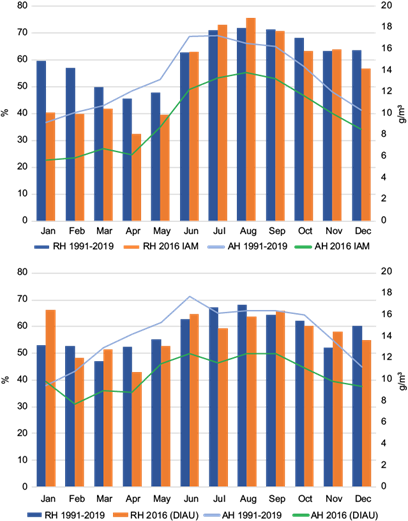
Fig. 4 Mean monthly relative humidity (RH in bars, %) for 2016 and absolute humidity (ρw in lines, g m-3) and for the 1991-2019 normals. Upper panel: normals from station SMN 14065 vs. IAM in Guadalajara; lower panel: normals from station SMN 21065 vs. DIAU in Puebla.
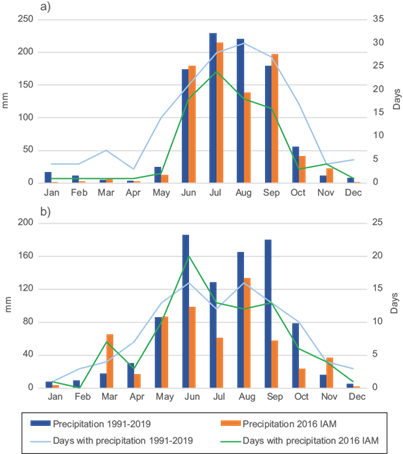
Fig. 5 Monthly precipitation for 2016 and for the 1991-2019 normals. Upper panel: normals from station SMN 14065 vs. IAM in Guadalajara; lower panel: normals from station SMN 21065 vs. DIAU in Puebla.
Figure 3a, b show the topography and the meteorological stations used to generate the iso-hygro maps, which will illustrate the present paper. Only those used for direct comparisons between different environments (urban, suburban, and rural) are listed in Table III.
The height of roughness (Zo) shown in Table III was estimated applying the simplified method proposed by Lettau (1970), cited by Oke (1987, p. 139):
where A* is the sum of vertical areas against the prevailing wind, obtained through 3D projection of Google Earth. Very small vegetation was not considered in this study. In the case of the trees, the area of projection of the most similar geometric body was taken (e.g., a cone projected as a triangle for a pine tree, a sphere projected as a circle for a leafy tree), but with a correction factor depending on the foliage (between 0 and 1). A’ = πr2, with r = 500 m, and h is the height of the canopy, which will be considered equal to that of the sensors according to Table III. Note that the values of Zo in both metropolises are of the same magnitude, but Zo is double for the suburban area of Guadalajara compared to the corresponding one in Puebla. In contrast, the rural area of Puebla is significantly higher than in Guadalajara.
Table IV illustrates the corresponding local climate zones according to Stewart and Oke (2012), as well as the surrounding landscapes for each meteorological station.
Table IV Local climate zones (LCZ), texture, Normalized Difference Vegetation Index (NDVI), and vegetation profile for the three weather stations analyzed in each metropolis.
3.1 Instruments
In the case of Guadalajara, the urban station (Institute of Astronomy and Meteorology, IAM) corresponds to a Davis Vantage Pro 2 placed 8 m above the ground, slightly exceeding the height of surrounding obstacles, while the suburban station (Loma Dorada) belongs to the Atmospheric Monitoring System of the Secretariat of the Environment and Territorial Development of the state of Jalisco. It measures air temperature and humidity with MetOne brand sensors at hourly frequency, and its height above street level is also 8 m, located above the rooftop of a public building without vegetation or neighboring higher buildings. The rural station (Tlajomulco) is part of the National Meteorological Service of Mexico. This station uses FTS digital sensors (model THS-2000-1) to measure temperature and humidity, logging data every 5 min on a tower located 7 m above the ground.
The IAM station, chosen as urban station in Guadalajara, presents a high percentage of recorded data, unlike other stations near the metropolitan center. It is located at on the edge of the historic center and has experienced recent urban growth. The IAM surroundings are characterized by high economic activity; the predominant nearby constructions are buildings with two to three levels. Significant vehicular and commercial flow associated with the predominant mixed land use can be observed together with vegetation of tall trees of wide crowns and bushes, unlike the suburban station (Loma Dorada), as illustrated in the NDVI values in Table IV.
At the Loma Dorada station, residential land use with buildings of two to three levels and small businesses are predominant. The vegetation consists of medium-sized trees without large crowns.
Stations in Puebla differ in height among them. The DIAU station (urban) is located more than 15 m above the street level but is surrounded by higher buildings. The Lomas del Mármol station (suburban) is 6 m above the street frontage, but towards the back of the buildings, with a height of about 10 m (since it is in an area with a steep slope). The Chachapa station (rural) has an approximate height of 8 m. The three stations are Davis Vantage Pro 2 and collect data every 15 min.
The papers cited in Table SI show no uniformity with respect to the heights above the ground where the measures were taken, although most of them were located within the urban canopy. In this study, if the heights at which the measuring stations are located are compared with the respective roughness heights of their environments (see Fig. 3), it can be inferred that the urban and suburban sensors of both metropolises are at the limit between the urban canopy and the boundary layer, while the rural ones are properly at the boundary layer. Table IV shows images of a 1-km area surrounding each of the stations in Table III.
From the rural station in Guadalajara (Tlajomulco) and the three stations in Puebla, hourly averages of ambient temperature (T in ºC) and RH (in %) were obtained and coupled with the timetable database of the IAM and Loma Dorada stations. Figures 6, 8, 9, 11, and 12 were generated using this database. For Figures 7 and 10 to 13, we derived the hourly average from the absolute humidity (ρw, in g m-3) using the recurrence formula (Tejeda-Martínez et al., 2018):
where e is the vapor pressure (in hPa) and T k the temperature in absolute degrees (K), while e was obtained by clearing the definition of RH with e s (saturation vapor pressure [in hPa] as function of temperature T [in ºC]), calculated with the polynomial expression of Adem (1967), so that:
The maps in Figure 3 were developed using the QGIS software (QGIS Development Team, 2022), geo-referencing the elements previously mentioned in the present paper. The isolines in Figures 6 and 7 were plotted using the Surfer software (Surfer, 2021), which generated a grid of 100 rows by 56 columns for Guadalajara, and a grid of 100 rows by 68 columns for Puebla. The isolines were obtained using the Radial Basis Function (RBF) interpolation method (Burrough and McDonnell, 1998), because the lines were smoother and corresponded better with different land uses, surface type, and topography of the study areas.
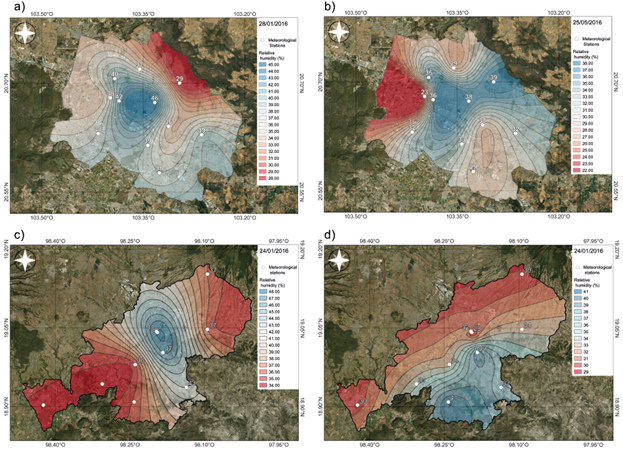
Fig. 6 Distribution of average relative humidity (%) on a cold and a warm day in 2016: (a) Guadalajara, January 28 (trough with cold front), (b) Guadalajara, May 25 (anticyclone), (c) Puebla, January 24 (high pressure associated with a cold front), (d) Puebla, May 2 (anticyclone).
4. Results
The iso-hygro maps of Figure 6 indicate average excess in the urban RH of about 15 pp for Guadalajara, both for one of the coldest days and for one of the warmest in 2016. In the case of Puebla, the difference exceeds 10 pp for cold days; the influence of the urban sprawl is observed, because the highest values in the sites of higher population density are presented (Fig. 6c), while on warm days the RH is higher outside the metropolis, especially towards the sites with bodies of water (Valsequillo lake) (Fig. 6d). As it will be shown later, these average behaviors do not necessarily correspond to the hourly and daily temperature variance of these contrasts. The fact that the excess of urban RH on cold days is higher in Puebla may be because the urban canyons of the center of the metropolis are narrower than those in Guadalajara, due the irrigation of vegetation of metropolis kernel; however, it was not possible to document this with data.
Figure 7 shows the absolute humidity distribution, where an urban hygric excess from 1 to 2 g m-3 can be seen in both metropolises for cold days, while for warm days these differences can be up to 5 g m-3 and the iso-hygro maps follow the configuration of the topography. These figures show that the urban environment is, on average, more humid than its surroundings, but it must be taken into consideration that both days correspond to dry periods of the year, when irrigation is usually applied to urban gardens but not to rural surroundings.
To clarify the effects of temperature on hygric behaviors, Figure 8 shows the average hourly differences in air temperature (ºC) between different environments throughout 2016. The overall urban-suburban thermal contrast in Guadalajara (Fig. 8a) is slightly positive from noon (except on some days in August, when the urban station records higher data from dawn to noon), and negative from night to noon, which is consistent with the findings of Moreyra-González et al. (2022). This is because both the IAM and Loma Dorada stations are surrounded by buildings with an average of two to three levels in height, built next to each other without spaces between them. These buildings are arranged in blocks separated by streets of varying widths, but with a greater vegetation cover in the urban station (IAM) than the suburban (Loma Dorada) as can be seen in Table IV. That is, it is possible to observe a certain similarity between the morphology and built surface density in both areas, resulting in similar thermic properties. The other three differences (Fig. 8b-d) are mostly positive during the nocturnal periods, regardless of the time year, while during daytime they are weak or even negative, with a different pattern to that observed in Figure 8a. The urban-rural contrasts are more intense (Fig. 8b, d) and with larger differences in Guadalajara (Fig 8b), where a high contrast is observed in the presence of built elements between urban and rural environments. While the urban area has a 90% waterproof environment with a densely built morphology, the rural environment shows few conglomerated buildings in isolated cores surrounded by predominantly permeable areas dedicated to agricultural use. The rural area has low density buildings with land use corresponding to municipality services or early small housing developments. In contrast, mainly in summer, the differences of positive temperatures in the urban-rural comparison in Puebla extend to several hours during the day.
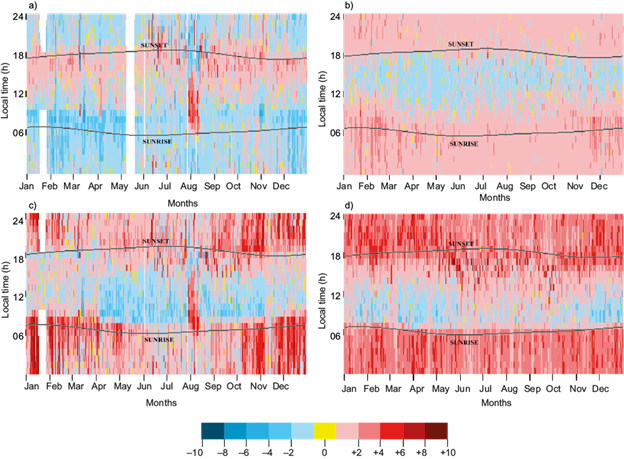
Fig. 8 Daily average differences for air temperature (ºC) between different environments in 2016 for: (a) urban-suburban Guadalajara, (b) urban-rural Guadalajara, (c) urban-suburban Puebla, (d) urban-rural Puebla. Months are shown on the X-axis and local time on the Y-axis.
In Figure 9, the average differences in RH (in pp) follow inverse patterns to those observed in Figure 8. i.e., there are RH deficits when urban excesses of temperature occur, as the behavior of the RH is strongly dominated by the thermal behavior, according to the Clausius-Clapeyron equation (Oke et al., 2017, chpt. 9; Tejeda-Martínez et al., 2018).
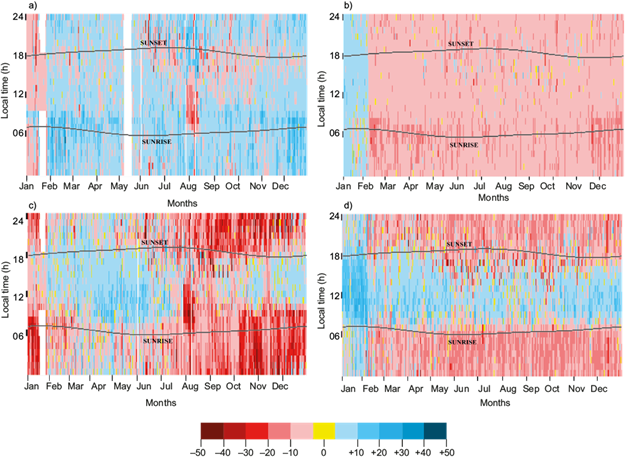
Fig. 9 Daily average differences of the relative humidity in percentage points (pp) between different environments in 2016 for both cities: (a) urban-suburban Guadalajara, (b) urban-rural Guadalajara, (c) urban-suburban Puebla, and (d) urban-rural Puebla. Months are shown on the X-axis and local time on the Y-axis.
Figure 10a (urban-suburban in Guadalajara) shows how the urban excess of absolute humidity predominates from February to December. The urban-rural difference (Fig. 10b) is positive from November to June, almost regardless of the time of day. As mentioned above, artificial irrigation of vegetated areas as a source of moisture, could lead to higher evapotranspiration in urban and suburban areas than in rural areas, where the sowing areas practically remain dry outside the rainy season. Nevertheless, it was not possible to obtain reliable information about the artificial irrigation patterns to fully confirm this. In Puebla, the urban-suburban contrasts (Fig. 10c) are all negative except in January. The urban-rural differences (Fig. 10d) are positive between 10:00 and 18:00 LT all year round, and throughout the day from January to March. With respect to magnitude, the contrast of absolute humidity between urban and rural environments is similar for both metropolises.
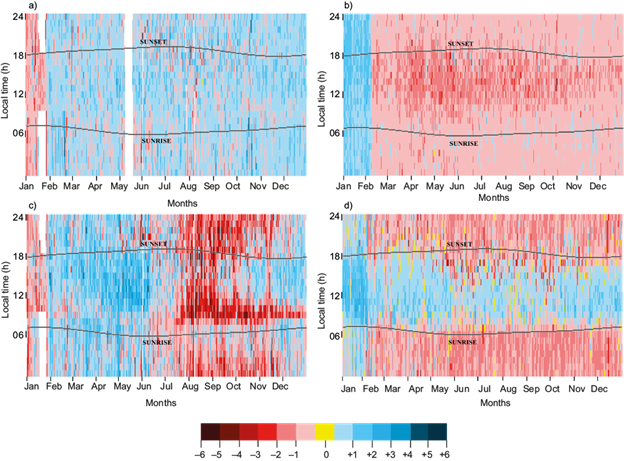
Fig. 10 Daily average differences of the absolute humidity (g m-3) between different environments in 2016 for both cities: (a) urban-suburban Guadalajara, (b) urban-rural Guadalajara, (c) urban-suburban Puebla, (d) urban-rural Puebla. Months are shown on the X-axis and local time on the Y-axis.
From figures 8 to 10 it can be estimated that about 70% of the time the urban environment is warmer (with a lower RH) than the rural one in Guadalajara, or the rural and suburban environments in Puebla. In the comparison between urban and suburban environments in Guadalajara, only 34% of the time the urban is warmer and 86% of the time it has a higher RH. Most of the time, absolute humidity is higher in the urban environment, except when urban-suburban areas in Puebla are compared. On average, these differences are less than 1 gm-3, which is usually within the uncertainty ranges of the measuring instruments.
Although Puebla is in the Gulf of Mexico slope, and Guadalajara is on the side of the Pacific Ocean, in both cases the anticyclonic effect from November to April is present. The rainy season usually begins in May, characterized by thunderstorms during the afternoon and early evening.
In Figures 11-13 isolines were also obtained using the RBF interpolation method. They were used to explore the role of the city in the drying of the urban atmosphere, showing four days with rain followed by four days without or scarce rain. In both locations, days after the rainy periods, the winds were weak or calm, discarding the effects of advection. Figure 11a, b shows the evolution of urban-suburban and urban-rural deficits/excesses for Guadalajara, respectively, of temperature for four days with precipitation (August 22 to 29, with 38.2 mm accumulated) followed by four days almost without precipitation (August 26 to 29, 2016 with 0.25 mm accumulated). The excess of urban temperature occurs during the evening period when comparing the urban and suburban environments (Fig. 11a), and during the evening and nocturnal periods in the urban-rural comparison (Fig. 11b). Therefore, at least in this case the rain did not have a determining effect on the urban heat island. In Puebla (Fig. 11c, d), during the four days with precipitation (August 6 to 9), 54 mm were accumulated. However, here the urban-suburban difference responds more to the daily cycle, i.e., it is negative between 12:00 and 17:00 in Figure 11c. From August 10 to 13 (2 mm accumulated) the differences intensify during the nocturnal period, especially in the urban-rural comparison (Fig. 11d), but they remain weak during the diurnal and rainy periods. This suggests that, in the case of Puebla, precipitation had an influence on the magnitude of the urban heat island, which requires further exploration in another paper.
The RH patterns shown in Figure 12 are inversely proportional to the temperature shown in Figure 11. The role of temperature over the RH is verified. On the other hand, the absolute humidity in Guadalajara (Fig. 13a) is lower at night than during day but is always positive; the urban-rural contrast (Fig. 13b) has negative values between 10:00 and 12:00 LT. In contrast, the urban-suburban differences in Puebla (Fig. 13c) are negative for the diurnal period, but positive during the urban-rural contrast for that same period throughout the year (Fig. 13d), indicating that in Puebla the suburbs could be more humid in comparison to the urban center and even more humid than the rural surroundings. However, it should be emphasized that the transition from days with precipitation to days without precipitation does not show a significant impact on the contrast of absolute humidity in any of the four cases shown in Figure 13.
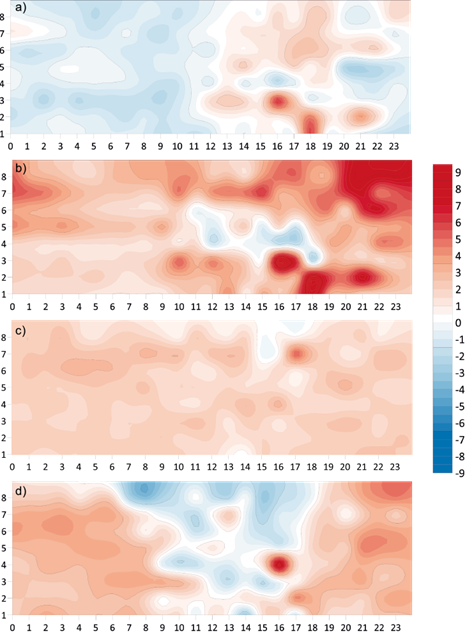
Fig. 11 Evolution of urban excesses/deficits in temperature (ºC) for four days with precipitation followed by four days without rain during from August 22 to 29, 2016: (a) urban-suburban Guadalajara, (b) urban-rural Guadalajara; and for August 6 to 13: (c) urban-suburban Puebla, and (d) urban-rural Puebla. Local time is shown on the X-axis and day numbers on the Y-axis.
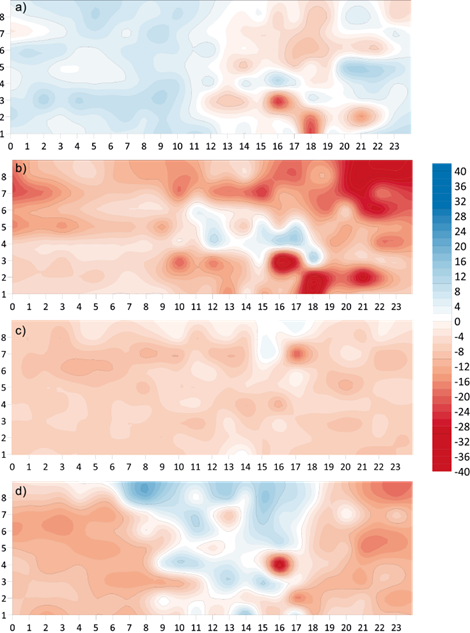
Fig. 12 Evolution of urban excesses/deficits in relative humidity (pp) for four days with precipitation followed by four days without rain during from August 22 to 29, 2016: (a) urban-suburban Guadalajara, (b) urban-rural Guadalajara; and for August 6 to 13: (c) urban-suburban Puebla, and (d) urban-rural Puebla. Local time is shown on the X-axis and day numbers on the Y-axis.
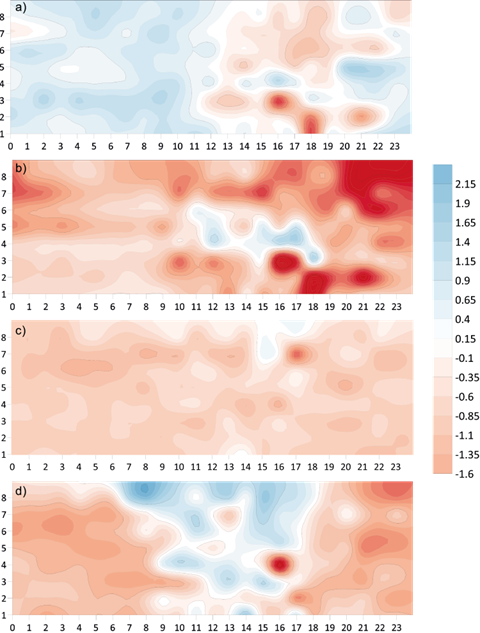
Fig. 13 Evolution of urban excesses/deficits in absolute humidity (g m-3) for four days with precipitation followed by four days without rain from August 22 to 29, 2016: (a) urban-suburban Guadalajara, (b) urban-rural Guadalajara; and for August 6 to 13: (c) urban-suburban Puebla, and (d) urban-rural Puebla. Local time is shown on the X-axis and day numbers on the Y-axis.
5. Concluding remarks
This paper describes atmospheric humidity contrasts in the limits between the urban canopy and the boundary layer, against the corresponding ones in suburban and rural environments in two industrial high-risen Mexican metropolises with millions of inhabitants, located in tropical latitudes. The fact that the contrasts of RH are determined by thermal differences between these environments is confirmed, which has been documented in previous works and corresponds to the inverse relation between RH and temperature according to the Clausius-Clapeyron equation.
Atmospheric humidity is important in the evaluation of human, vegetal, or animal bioclimate, so it is of interest to understand the effects of urbanization on this climatic variable. From the present paper it can be concluded that, as urban sprawls continue to grow in Guadalajara and Puebla, urban dryness will be intensified in terms of RH, as the result of the urban heat island increment. However, for the purposes of urban planning and its relationship with bioclimate, the comparisons of absolute humidity contrasts are of major interest, since this variable measures the vapor concentration in the atmosphere. The contrasts of urban environment compared to suburban and rural areas are more intense the greater the urban sprawl. However, it is not easy to deduce a spatial or temporal pattern (annual or daily cycle) because it is a complex phenomenon (Yang et al., 2020) that comprises more factors to determine the behavior of humidity than those described in this article, not only geographic and climatic, but also the possible sources of water vapor emissions.
The results presented in this paper have uncertainties that could not be resolved because of the variability of wind direction and height differences of the sensors above ground. These uncertainties are also common in the cited articles in Table SI. One way to reduce the sources of error in the comparisons is conducting measuring campaigns at different times of the year.
As stated by Oke et al. (2017), the urban moisture deficit during the dry season, which is a result of lower vapor pressure in the city due to its impermeability, is not confirmed in any of the cities when analyzing absolute humidity. In Guadalajara, both the urban-suburban and urban-rural differences are negative during the dry months, regardless of the hour of the day, whereas in Puebla such differences are negative or weak for the diurnal period in the urban-suburban contrast and also for the nocturnal period in the urban-rural comparison, regardless of the month.
In Guadalajara, the influence of the geographical built environment is reflected in urban-rural contrasts in both temperature and absolute humidity. In the temperature contrast, the positive values at night are associated with the thermal properties of the built surfaces inside the metropolis. An absolute humidity contrast can be observed in the urban-rural environment even though the urban zone presents predominantly low NDVI values (Table IV) in comparison with the rural area. This could be due to moisture inputs from the irrigation of urban areas, which could contribute to higher water vapor content than in rural areas (although there are no precise quantifications). A similar phenomenon was found by Unger (1999) in Szeged, Hungary.
Regarding the urban-suburban differences, the similarity in the geographical built environment characteristic of Guadalajara, does not decisively modify the contrast in temperature or in absolute humidity. This metropolis does not present high contrasts in morphology or type of surfaces due to its prevailing horizontal growth and absence of significant differences in topography. Both zones are similar with respect to land use (residential and commercial), built densities, facades of two to three levels and little gardened area on the main avenues. The use of mechanical systems for climate control is not yet popular, so no anthropogenic heat contributions may have an influence in the contrasts of temperature and humidity.
Puebla’s behavior is similar to that found in other cities (Oke et al., 2017), with a nocturnal heat island, lower values of RH and higher urban absolute humidity in the urban-rural comparison, but not in the urban-suburban case, where values are very close.
In both metropolises the urban-suburban comparisons are not very clear with respect to the absolute humidity behavior, due to similarities in the landscapes of both environments. According to Roth (2007), a city is more humid due to the presence of humidity sources, vegetation, or wind patterns, or less humid due to the urban heat island or local winds, so the mechanism is not yet clear.
When comparing rainy days followed by days without or almost without rain, it was not found that the patterns of the absolute humidity differences had a significant change due to the presence or absence of rain. In the case of Guadalajara, an urban absolute humidity excess in the urban-suburban comparison was observed during the eight days regardless of time, while the urban-rural difference around 10:00 LT was found to be negative and the rest of the time it was positive but low. In Puebla, negative values prevail in the urban-suburban comparison during daytime, and the opposite occurs at night for the urban-rural contrast.


 nueva página del texto (beta)


