1. Introduction
Numerical weather prediction models are highly complex systems that simulate meteorological patterns by solving Navier-Stokes equations numerically, thereby parameterizing subgrid-scale processes, such as microphysics, subgrid-scale orography, radiation, and so on. The ability of the models to capture severe weather events depends on the different representations of physical and dynamical processes that characterize each of them. Investigating high-impact weather cases where certain model features are enhanced can offer valuable information to identify behavioral patterns specific to each numerical model. For numerical weather prediction models to be used in operational weather forecasts for a specific area of interest, a thorough analysis of the quality of model simulations for extended periods is necessary (Damrath et al., 2000; Muravev et al., 2015).
An important aspect in the evaluation of a numerical weather prediction system is the comparison against competing forecast systems, which enables a degree of quality control of the model performance (Glowienka-Hense et al., 2020). Thus, the evaluation of a new numerical weather prediction model against an existing operational one can provide essential feedback to the users as well as the developers regarding several aspects, such as (a) general model performance, (b) the quality of the model forecast for specific meteorological parameters, (c) the ability of the new model to capture particular weather configurations of interest, and (d) the impact of new developments for the representation of various numerical or physical processes. Comparisons between an existing operational forecast system and a newly developed one before introduction to day-to-day activities are widely practiced and advised not only to assess the meteorological impact of the new cycle but also to monitor forecast quality over time (WWRP, 2009; Haiden et al., 2021). Moreover, such controlled testing offers valuable support in quantifying and advising on the impact of switching from an existing operational numerical weather prediction system to a new one. For the Romanian territory, such activities have been previously carried out by Dumitrache et al. (2011), who performed an evaluation study using the Consortium for Small-scale Modeling (COSMO) (Doms et al., 2018), a non-hydrostatic limited-area model, and the High-resolution Model (HRM) (Majewski, 2009), a hydrostatic regional model. The present study is dedicated to the comparison between the numerical weather prediction models COSMO and the Icosahedral Nonhydrostatic General Circulation Model, Limited Area Mode (ICON-LAM) (Zängl et al., 2015).
The COSMO limited area model has been in operational use in the National Meteorological Administration of Romania since March 2005. The model was initially developed at the Deutscher Wetterdienst (DWD), with later improvements achieved in collaboration with the COSMO Consortium. COSMO is a non-hydrostatic limited area numerical weather prediction model, used both operationally and for research purposes on the meso-β and meso-γ scale (Doms et al., 2018). The ICON modeling framework (Zängl et al., 2015), developed by DWD in collaboration with the Max Planck Institute for Meteorology, is set to replace the COSMO model in the near future. The ICON model has been designed as a unified global numerical weather prediction and climate modeling system, but can also be run in limited area mode (ICON-LAM), either nested or using external initial and lateral boundary conditions obtained from a global model or the output of a coarser resolution limited area model (Prill et al., 2020). ICON-LAM has been running at the National Meteorological Administration of Romania since November 2019. This study aims to present the first detailed inter-comparison of the performance from the COSMO and ICON-LAM numerical weather prediction models integrated for Romanian territory at 2.8 km horizontal resolution. A less extensive comparison between the two models was carried out in the framework of the COSMO project C2I (COSMO transition to ICON-LAM), with initial results for the 2020 autumn season (September-October-November) presented by Rieger et al. (2021).
The studies of Zängl et al. (2015) and Prill et al. (2020) for ICON and the study by Doms et al. (2018) for COSMO offer detailed descriptions of the two modeling frameworks, including the main differences that characterize them. For ICON, various overviews are available that also describe the physical parameterizations and numerical methods that can be employed for simulations of the spatiotemporal evolution for aerosols and trace gases (Rieger et al., 2015; Schroter et al., 2018), as well as climate simulations (Giorgetta et al., 2018; Crueger et al., 2018; Pham et al., 2021). A short description of the main differences between the two models is presented in section 2.
The ability of the COSMO model to simulate well severe weather cases has been reported in studies such as Sokol et al. (2014), Shrestha et al. (2015), Bližňák et al. (2019), Bucchignani et al. (2020), Garbero and Milelli (2020), and Roshny et al. (2020). Similarly, the accuracy of the ICON model for forecasting severe weather events is now being evaluated for different regions (Belyakova et al. [2020], Bresson et al. [2022], de Lucia et al. [2022], and Avgoustoglou et al. [ 2023a, b]). Comparisons for the performance of the two models have been presented by Rieger et al. (2021), 2022) and Bucchignani et al. (2023).
The present study aims to analyze the performance of the COSMO and ICON-LAM numerical weather prediction models in situations of severe weather (strong wind, observed heavy precipitation, atmospheric instability) and offer a comparison between the performances of the two models for Romanian territory. Results from the statistical inter-comparison between the two models integrated for the 2020 summer period (June-July-August) are also shown. To ensure a thorough evaluation of the performances of both models for the Romanian territory, various statistical scores were computed to point out the behavior of each model for the 2020 summer season. Such an objective evaluation of the model performance for the domain of interest offers a good basis to identify the capabilities, advantages, and limitations of each model in simulating atmospheric processes and can offer valuable directions for improving the model forecast quality. These scores are based on the difference between COSMO and ICON-LAM numerical forecasts and surface observations. Standard verification methods including bias (mean error [ME], root mean square error [RMSE], and standard deviation) were calculated to assess the quality of both COSMO and ICON-LAM in forecasting continuous surface parameters such as 2-m temperature (T2M), 10-m wind speed (FF) and 2-m relative humidity (RH2M). For 12-h accumulated precipitation (RR_12h), the results were obtained based on verification methods for multi-category forecasts, such as probability of detection (POD) and false alarm rate (FAR). Detailed descriptions of the statistical measures employed in this study can be found in Nurmi (2003) and Jolliffe and Stephenson (2012).
The configuration of high-resolution numerical weather prediction models used for the present study are detailed in section 2, along with information regarding the observations used for evaluation and a short description of the methodology. The main part of the paper is dedicated to the analysis of the model performance in two cases of interest, followed by the statistical evaluation and inter-comparison of the two limited area simulations for the 2020 summer season. Short descriptions of the synoptic regimen for the periods of interest and discussions on the forecast quality of the models are provided in sections 3 through 5. The paper ends with joint conclusions regarding the performance of the two numerical weather prediction models for the selected cases.
2. Description of the modeling system and observational analysis
2.1 Model configurations
The COSMO and ICON-LAM numerical weather prediction models are employed for this study, both integrated at 2.8 km horizontal resolution (00:00 UTC runs) for the Romanian territory.
One of the most striking differences between the models employed for this study is the grid description. COSMO uses an Arakawa C-grid with Lorenz vertical grid staggering (Doms et al., 2018), with model equations formulated with respect to a rotated lat/lon-grid, while the ICON model employs an unstructured icosahedral-triangular Arakawa C grid (Zängl et al., 2015). Orography smoothing is approached differently by the two models, being done with an operator with min/max limiter for ICON, while in COSMO this is done using a filter during the interpolation of initial and lateral boundary conditions. Differences also appear in the handling of boundary data that need to cover the entire domain for COSMO; for ICON-LAM this can be replaced by stripes along the lateral boundaries, as long as interpolation and nudging zones are covered. Another difference between the two models is the coupling between the physics and dynamical core, which is done at constant density (volume) for ICON-LAM; in COSMO constant pressure is assumed (Doms et al., 2018). Specifically with respect to physical parameterizations, both models employ the same parameterizations for microphysics (Seifert and Beheng, 2006; Doms et al., 2018), sub-grid scale orography (Lott and Miller, 1997), and turbulence (prognostic turbulent kinetic energy (TKE ) equation, based on Raschendorfer [2001]). For the parameterization of convection, the COSMO model uses the Tiedtke (1989) mass-flux convection scheme with equilibrium closure based on moisture convergence with a reduced Tiedtke scheme for shallow convection, while the ICON model employs the mass-flux shallow and deep convection scheme proposed by Bechtold et al. (2008). Different parameterization schemes are employed for radiation and cloud cover.
For the present study, ICON uses the Rapid Radiative Transfer Model (RRTM) scheme proposed by Mlawer et al. (1997) and Barker et al. (2003) on a reduced grid, while COSMO employs the Ritter and Geleyn (1992) scheme with the addition of optical properties of ice clouds based on Rockel et al. (1991). For radiative processes, the parameterization schemes available in the ICON model also include ecRad (Hogan and Bozzo, 2018; Rieger, 2019), Ritter and Geleyn (1992), and PSrad (Pincus and Stevens, 2013). Both models use the TERRA soil model for surface layer processes (Schrodin and Heise, 2002). However, ICON employs a tile approach for grid cells containing the same surface type, which is not possible in COSMO. For ICON, patches of the same surface type within a grid box are regrouped into homogeneous tiles for which the soil and surface parameterizations are run separately (Prill et al., 2020). Differences between the models are also related to the data assimilation procedures. For the COSMO model, built-in nudging data assimilation is available, while for ICON-LAM the data assimilation (LETKF/EnVAR; Schraff et. al., 2016) is performed separately.
For the present implementation of COSMO- 2.8 km, initial and lateral boundary conditions (IC/LBC) with 3-h frequency were obtained from the output of the COSMO model run at 7 km horizontal resolution on a domain covering the Romanian territory and neighboring countries with 201 × 177 grid points and 40 vertical levels. The 7 km runs used as IC/LBC for COSMO-2.8 km are driven by 3-hourly data from the ICON global model at 13 km horizontal resolution.
The COSMO-2.8 km integration domain approximately covers the Romanian territory with 361 × 291 grid points and 50 vertical levels. The model is integrated with nudging data assimilation (DA) of SYNOP observations available from all Romanian meteorological stations. A previous study regarding the performance of the COSMO model integrated in various configurations (7 and 2.8 km) has shown added value from assimilation of observations on the Romanian territory in forecasting parameters such as cumulated precipitation, 10 m wind speed and maximum wind speed (Iriza et al., 2013). As the observations are only assimilated for the first 6 h of the model run (corresponding to the spin-up time), the assimilated observations are not considered in the evaluation. Thirty-hour forecasts are available from the COSMO-2.8 km model. The initial and lateral boundary conditions for ICON-2.8 km were obtained from the ICON global model at 13 km horizontal resolution, with a 3-hourly update frequency. Although the model has an unstructured grid (computational grid R07B08, using 147 260 grid points for the initial domain), the model output is interpolated and represented on a regular lat/lon grid (interpolation is performed by the model). The ICON-2.8 km integration domain approximately covers the area between 41.50º-50.50º north latitude and 17.50º-32.50º east longitude. No data assimilation is employed for the ICON-2.8 km integration. A summarized overview of the model configurations can be seen in Table I.
Table I Overview of the model configurations.
| dx | Domain | IC/LBC | DA | Vertical levels | Dt (s) | Forecast period (h) | |
| COSMO-2.8 km | 2.8 km | 361 × 291 grid points (105 051) | COSMO-7 km; hourly | Nudging | 50 | 25 | 30 |
| ICON-2.8 km | 2.8 km | 147 260 grid points | ICON global (13 km), 3-hourly | No | 65 | 24 | 78 |
dx: horizontal resolution; IC/LBC: initial and lateral boundary conditions; DA: data assimilation; Dt (s): time step in seconds.
The integration domains covering the entire Romanian territory (and corresponding simulated topography) are presented in Figure 1a, b. Topography differences (Fig. 1c) between the two models (calculated as COSMO-2.8 km topography-ICON-2.8 km topography) vary between -489 m (ICON-2.8 km higher) and 450 m (COSMO-2.8 km higher).
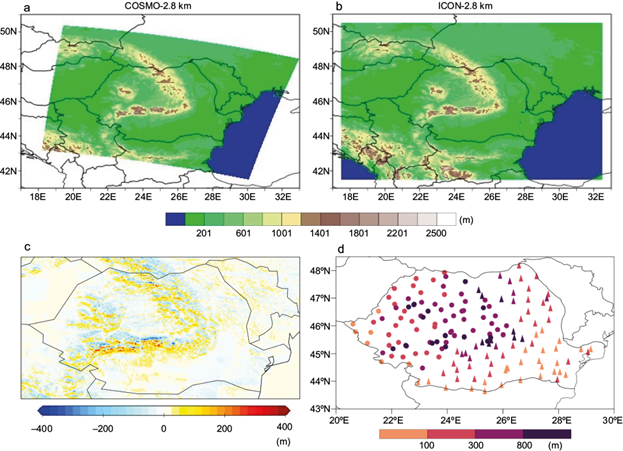
Fig. 1 Integration domains and topography for (a) COSMO-2.8 km and (b) ICON-LAM-2.8 km (b). (c) Difference (in m) for Romanian territory between the topography data from two models. (d) Location and altitudes (in m) of synoptic stations in the Romanian territory. Circles denote stations from western and central regions; triangles denote stations from southern and eastern regions.
The differences in topography representation between the two models (Fig. 1c) are most visible for the mountainous area, with values over 200 m or even 400 m for the highest peaks. Small differences in topography representation by the two models are observed for the area outside the Carpathian mountainous system, with large areas of altitude differences lower than 5-10 m for the eastern part of the country.
2.2 Observational retrieval
The Romanian territory is covered by synoptic stations with altitudes between 1.4 and 2504 m. The stations employed for the present study are characterized by different altitudes, as follows: 31 have altitudes below 100 m, 53 are between 100 and 300 m, 43 between 300 and 800 m, and the remaining 25 have altitudes above 800 m. Locations and altitudes of the stations are shown in Figure 1d. In this study, observations for two cases with high impact weather (February 3-6, 2020, May 3-5, 2020) and the 2020 summer season (June-July-August) are employed. Due to the different synoptic regimen for different regions of the country during the 2020 summer, the observation data set was split in two, according to station location: 84 stations for the western and central regions of the country (Fig. 1d, circles) and 74 stations for the southern and eastern regions of the country (Fig. 1d, triangles). Most stations from the western and central regions of the country have altitudes above 300 m (with many mountainous stations), while for the southern and eastern regions most stations have altitudes below 300 m. The number of stations was comparable between the two areas (84 and 74, respectively).
The statistical evaluation for the summer season is performed using the Model Equivalent Calculator (MEC; Potthast, 2019) for the production of verification files. The procedure is performed by applying the observation operators from the data assimilation scheme to model forecasts (COSMO or ICON) and storing the results in NETCDF (Unidata, 2019) files that can be processed with dedicated scripts developed using the Rfdbk (Fundel, 2018) R-based package (R Core Team, 2013; Chang et al., 2020). For this purpose, observations are retrieved in BUFR (WMO, 2019) format and converted to NETCDF using the bufr2netcdf software (Patruno and Cesari, 2011). Scores are computed for all stations and also stratified between the two areas presented above. Results for the following continuous parameters are presented: T2M (in deg K), 2-m dew point temperature (TD2M, in deg K), surface pressure (PS, in Pa), FF (in m s-1) and RH2M (in the interval 0.1). For these parameters, ME and RMSE are computed. Categorical scores are shown for RR_12h (thresholds in mm 12 h-1: > = 0.1, > =10, > = 20) and N (total cloud cover, thresholds in octa: > = 1, > = 4, > = 7): POD and FAR.
The same methodology used to perform the statistical evaluation for the 2020 summer season is also employed for the two severe weather events, but using the observations for the entire country (all regions). In this case, only scores for T2M (in deg K), TD2M (in deg K), PS (in Pa), FF (in m s-1) and RR_12h are shown. For the severe weather cases, observations for precipitation accumulated in 24 h and snow depth are also employed for comparison against simulated results. Twenty-four-hour accumulated precipitation from the 00:00 UTC model runs are obtained as follows: precipitation cumulated between 6 and 30-h lead time (hereafter 30-h lead time) for COSMO-2.8 km and ICON-2.8 km simulations; precipitation cumulated between 30 and 54-h lead time (hereafter 54-h lead time) for ICON-2.8 km simulations and precipitation cumulated between 54 and 78-h lead time (hereafter 78-h lead time) for ICON-2.8 km simulations.
3. Case study: Blizzard and downslope wind event
3.1 Synoptic analysis
The first analyzed case (February 3-6, 2020) was selected due to the phenomenon of downslope wind on the southern slopes of the southern Carpathians mountain range. During this period, the synoptic regimen of a classical blizzard for Romanian territory was characterized by differential advection, leading to a very stable air mass and a thermal inversion between the 850 and 700 hPa levels, which contributed to vertical changes in wind direction. On February 5, the southeastern part of Europe was affected by a low mean sea level pressure field, while the rest of the continent was under the influence of an intense and extended anticyclone, centered southwest of the British isles. At 12:00 UTC (Fig. 2), the cyclone over the Aegean Sea was intensified, while the one from the northwest basin of the Black Sea was occluded. The ridge from the anticyclone centered south of the British isles was transported south, over the northern part of Central Europe. The pressure gradient decreased with altitude, while in the middle troposphere, at 500 hPa, a cut off nucleus was visible southwest of Romania.
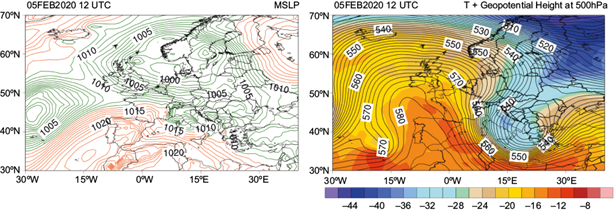
Fig. 2 Mean sea level pressure. Left: contour at 12:00 UTC on February 5, 2020 (left). Right: 500 hPa temperature (shaded) and geopotential height (contour) at 12:00 UTC on February 5, 2020. European Centre for Medium-Range Weather Forecasts (ECMWF) analysis.
At 00:00 UTC on February 6, the ridge extended to the east and south, while the cyclone from the Aegean Sea moved to the northern area of the Black Sea. The cut-off nucleus from the middle troposphere started retreating towards the south and southeast. This period was characterized by a continuous increase in pressure, with a high-pressure gradient and differences of up to 24 hPa between the northeastern and southeastern extremities of the country (1020 hPa compared to 996 hPa).
With the advance of the cyclone towards the Crimean Peninsula, the increase in pressure values was maintained, determining a reduction of the pressure gradient. The influence of the Carpathian Mountains led to a stronger pressure gradient in the southern regions of the mountainous range. The episode was characterized by heavy precipitation (snow) and particularly strong wind (up to 60 m s-1), resulting in significant damage to extensive forest areas.
3.2 Results and discussion
The February 3-6 period is analyzed in three steps, coinciding with the corresponding intervals for 24-h accumulated precipitation, mainly from February 3 at 06:00 UTC to February 4 at 06:00 UTC; from February 4 at 06:00 UTC to February 5 at 06:00 UTC, and from February 5 at 06:00 UTC to February 6 at 06:00 UTC. During all three intervals, high amounts of precipitation (snow) were registered in the Romanian territory, especially at the north, west, and central areas of the country (February 3 at 06:00 UTC to February 5 at 06:00 UTC), then for the southern regions (February 5 at 06:00 UTC to February 6 at 06:00 UTC). All numerical simulations performed for this case study are generally in good agreement with the observed precipitation field, especially with regards to the spatial distribution of the phenomenon (Figs. 3-5).
For the first interval of the analyzed case (February 3 at 06:00 UTC to February 4 at 06:00 UTC), both COSMO-2.8 km and ICON-2.8 km (30-h lead time) capture the spatial distribution of precipitation, which covered entirely the country except for the extreme south areas. Some small deficiencies from both models are observed for a limited area in the Romanian plain (south to southeast region of the country), where low precipitation of up to 5 mm in 24 h was observed locally. Both models offer satisfying estimates for the areas with most intense precipitation, which were extended to the entire Carpathian mountain range, as can be observed in Figure 3. Some false maximum amounts are forecasted by both models, but the areas of maximum precipitation are well placed, in agreement with the observations. A stronger overestimation of intense precipitation areas is displayed by COSMO-2.8 km compared to ICON-2.8 km.
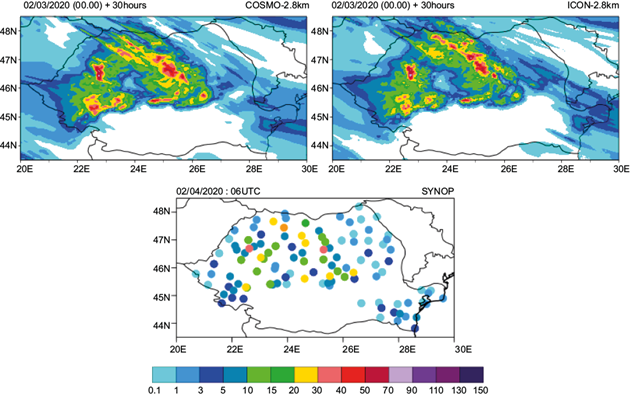
Fig. 3 24-h accumulated precipitation for February 3, 2020 at 06:00 UTC and February 4, 2020 at 06:00 UTC. Top left: COSMO-2.8 km + 30 h; top right: ICON-2.8 km + 30 h; bottom: observations (filled dots).
During the second interval of the analyzed case (February 4 at 06:00 UTC to February 5 at 06:00 UTC), the precipitation area was extended to the entire country, again with the largest amounts for the western and mountainous areas (Fig. 4). For this period also, both COSMO-2.8 km and ICON-2.8 km (30-h lead time) capture the spatial distribution of precipitation over the entire country, in the case of ICON-2.8 km also with 54-h lead time. The distribution of precipitation amounts is generally accurate, with low precipitation for the southern half of the country and inside the Carpathian arc, and heavy precipitation in the rest of the territory. Both models (COSMO-2.8 km with 30-h lead time and ICON-2.8 km with 30 and 54-h lead time, respectively) overestimate the maximum amounts and the extent of the areas with high precipitation intensity.
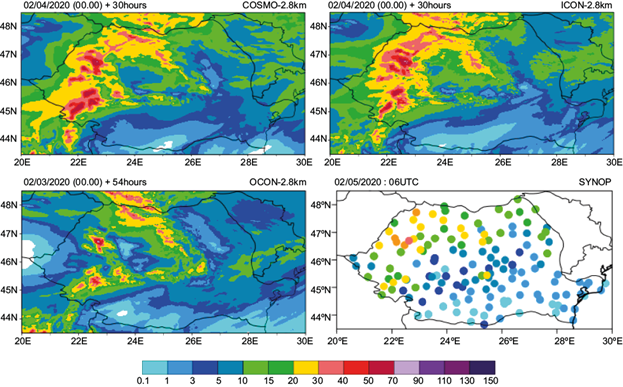
Fig. 4 24-h accumulated precipitation for February 4, 2020 at 06:00 UTC to February 5, 2020 at 06:00 UTC. Top left: COSMO-2.8 km +30 h. Top right: ICON-2.8 km + 30 h . Bottom left: ICON-2.8 km + 54 h. Bottom right: filled dots represent observations.
Given the heterogeneous distribution of the precipitation amounts, it is expected that the forecast from the models is slightly shifted in space compared to the observations. However, the representation of high and low precipitation areas is in good agreement with the measurements. A better performance for the most affected areas is shown by ICON-2.8 km with 54-h lead time. In this case, precipitation amounts forecasted for the center of the country (inside the mountainous range) are lower than those from both COSMO-2.8 km and ICON-2.8 km with 30-h lead time. The area of heavy precipitation is more restricted for the mountainous regions, which is in better agreement with the observations. During the final interval of the case, February 5 at 06:00 UTC to February 6 at 06:00 UTC (Fig. 5), the precipitation area was again extended to the entire country; however, the largest amounts were restricted to the south and southeast regions.
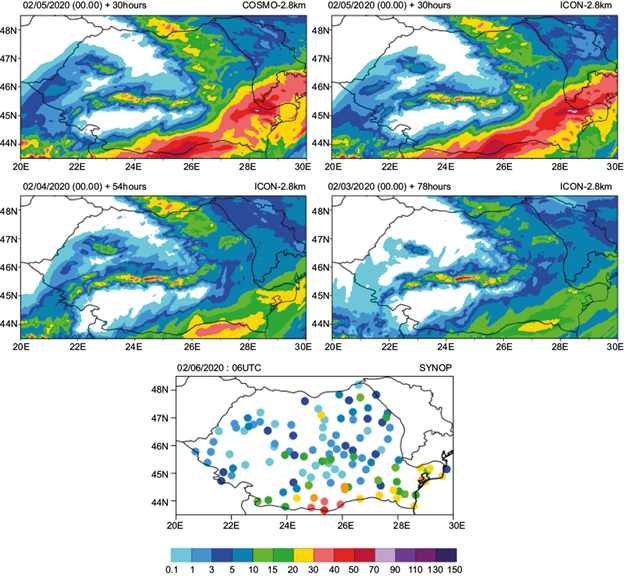
Fig. 5 24-h accumulated precipitation for February 5, 2020 at 06:00 UTC to February 6, 2020 at 06:00 UTC. Top left: COSMO-2.8 km +30 h. Top right: ICON-2.8 km + 30 h. Middle left: ICON-2.8 km + 54 h. Middle right: ICON-2.8 km + 78 h. Bottom: filled dots represent observations.
Both COSMO-2.8 km (30-h lead time) and ICON-2.8 km (30, 54 and 78-h lead time respectively) captured very well the spatial distribution of the precipitation field, estimating in all cases precipitation for the entire country, reduced to no precipitation for the southwest and northwest regions and heavy precipitation for the South and southeast, in accordance with the observations.
For both models and all lead times, an overestimation of values forecasted for the mountainous range is observed. The extent of the spatial distribution for the precipitation field is best captured by the COSMO-2.8 km and ICON-2.8 km runs 30 h prior to the event. The ICON-2.8 km integration with 78-h lead time underestimates the maximum forecasted values compared to observations. Maximum amounts are best simulated by ICON-2.8 km (54-h lead time), but the distribution is shifted compared to observations. Some false maxima and strong overestimation of the 24 h precipitation amounts for the south and southeast regions can be seen from COSMO-2.8 km and ICON-2.8 km with 30-h lead time.
During this period, a significant increase in snow height was observed, first for the mountainous areas (starting with February 3), and then gradually for the entire country. The spatial distribution of snow height as well as the maximum snow height was accurately captured by both models for the entire analyzed period. In all cases, the models perform well in simulating this parameter for mountainous areas (Figs. 6 and 7). For February 5 at 06:00 UTC (Fig. 6), good estimates of this parameter were offered both by COSMO- 2.8 km (30-h lead time) and ICON-2.8 km (30 and 54-h lead time). For this case, the best performance in estimating the spatial and quantitative distribution of this parameter is shown again by ICON-2.8 km (54-h lead time), whereas COSMO-2.8 km (30-h lead time) and ICON-2.8 km (30-h lead time) display a slightly higher overestimation compared to observations.
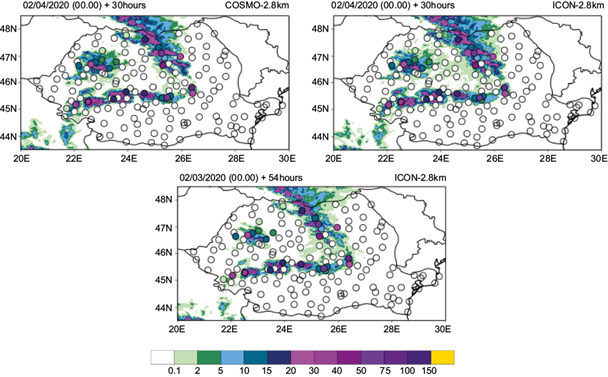
Fig. 6 Snow depth for February 5, 2020 at 06:00 UTC. Top left: COSMO-2.8 km + 30 h. Top right: ICON-2.8 km + 30 h. Bottom: ICON-2.8 km + 54 h. Filled dots represent observations.
For February 6 at 06:00 UTC (Fig. 7), the estimated snow height simulated by COSMO-2.8 km (30-h lead time) and ICON-2.8 km (30, 54 and 78-h lead time) were again close to the measured values. In agreement with the forecasted precipitation values, the ICON-2.8 km integration with 78-h lead time underestimates the maximum snow height values compared to observations and suggests a more restricted area for the spatial distribution of the parameter.
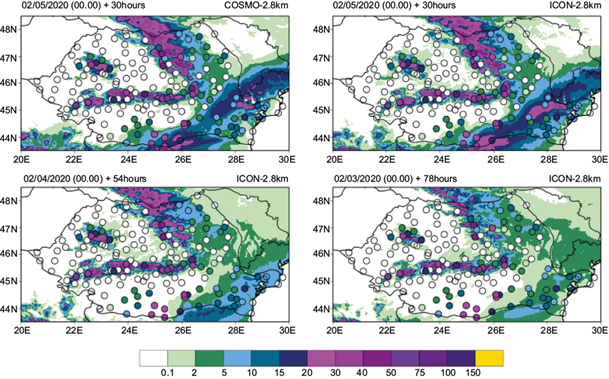
Fig. 7 Snow depth for February 6, 2020 at 06:00 UTC. Top left: COSMO-2.8 km + 30 h. Top right: ICON-2.8 km + 30 h. Middle left: ICON-2.8 km + 54 h. Middle right: ICON-2.8 km + 78 h. Filled dots represent observations.
For the south regions of the country, the best performance in simulating this parameter is shown by COSMO-2.8 km and ICON-2.8 km with 30-h lead time (compared to ICON-2.8 km with 54 and 78-h lead time); moreover the ICON-2.8 km simulation with 30-h lead time captures more accurately the maximum values and the extent of snow heights over 20 cm in this area.
However, both integrations strongly overestimate the values forecasted for the southeast regions of the country. In this respect, again, a better performance in simulating the spatial and quantitative distribution of snow height for the southeast area of interest is displayed by ICON-2.8 km (54 h lead time).
Although heavy precipitation that also led to elevated snow height values was observed, the most interesting phenomenon during this period was the extremely strong wind registered for the mountainous areas. Five mountain stations were of particular interest for this case: Penteleu (1632 masl), Bisoca (850 masl), Cuntu (1450 masl), Tarcu (2180 masl), and Sinaia 1500 (1510 masl), all shown in Figure 8.
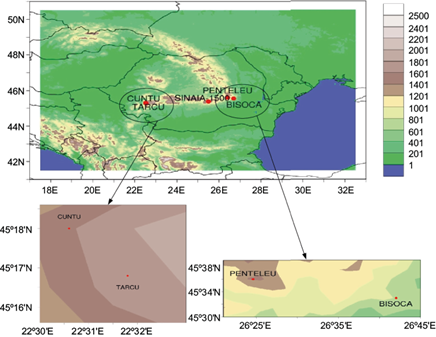
Fig. 8 ICON-2.8 km topography (shaded) and location of meteorological stations of interest (red dots). Upper panel: Penteleu and Bisoca (eastern area of Romania), and Cuntu, Tarcu (southwestern area), and Sinaia-1500 (central area). Lower panels: highlighted areas show the location of Cuntu and Tarcu stations (left) and Penteleu and Bisoca (right).
The comparison of real and modeled topography for these stations of interest (nearest grid point method) showed that the topography used by COSMO is lower than the real one for all stations. Similarly, the modeled topography from ICON-2.8 km is lower than the real elevation for four of the five stations of interest. However, except for station Sinaia-1500, the modeled topography from ICON-2.8 km is closer to the real station elevation (shown in Table II).
Table II Real and simulated elevations for the meteorological stations of interest.
| Station | Difference to real elevation | |
| COSMO | ICON | |
| Penteleu | -250.3 | -219.8 |
| Bisoca | -112.3 | -56.8 |
| Cuntu | -144.0 | -4.0 |
| Tarcu | -518.0 | -497.5 |
| Sinaia-1500 | -13.0 | 267.4 |
In all five stations, sustained wind gust values of over 20 m s-1 were registered for an interval of over 10 h, with maximum wind gust values of up to 35.2 m s-1 (Cuntu), 39.4 m s-1 (Penteleu), 40.6 m s-1 (Bisoca), 53.3 m s-1 (Tarcu) and 60.1 m s-1 (Sinaia- 1500). The comparison of the forecast for the nearest grid point from the model against observed values of wind gust (Fig. 9) show a general tendency of ICON-2.8 km to overestimate forecasted values for lead times of up to 30 h (model run in the same day, February 5, 2020).
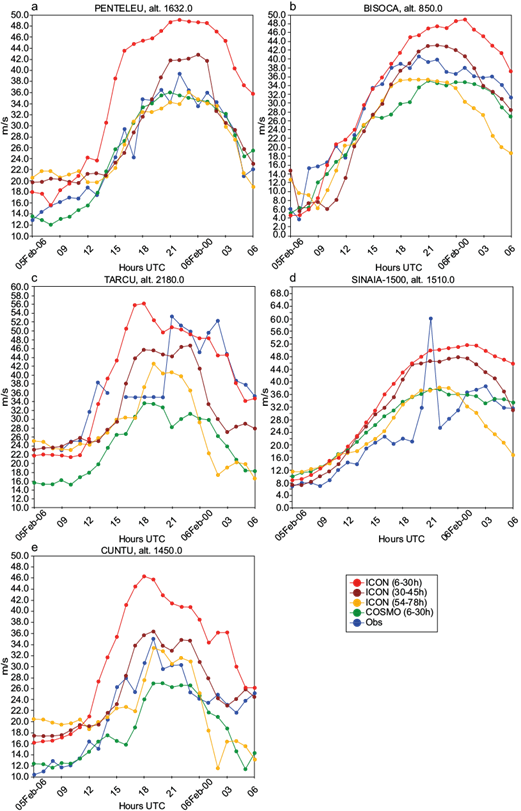
Fig. 9 10-m wind gust values between February 5, 2020 at 06:00 UTC and February 6, 2020 at 06:00 UTC at mountainous stations (a) Penteleu, (b) Bisoca, (c) Tarcu, (d) Sinaia-1500, and (c) Cuntu. Red: ICON-2.8 km run on February 5 (6-30-h lead time); dark red: ICON-2.8 km run on February 4 (30-54 h lead time); orange: ICON-2.8 km run on February 3 (54-78 h lead time); green: COSMO-2.8 km run on February 5 (6-30-h lead time); blue: observations.
A similar behavior is shown by the ICON-2.8 km model integration from February 3, 2020 (54 to 78 h lead time), as presented in Figure 9. The ICON-2.8 km model integration from February 4, 2020 (30 to 54 h lead time) offers the best estimates for wind gust values in this case, being the most accurate in simulating both wind intensities and their variations.
The maximum wind gust values of over 50 m s-1 (53.3 m s-1 at Tarcu and 60.1 m s-1 at Sinaia-1500) were underestimated by all model integrations (Fig. 9). However, the intensity of the phenomenon is suggested in all simulations, with sustained wind gusts of over 20 m s-1 forecasted for a long-time interval, starting with 12:00 UTC on February 5, 2020. Moreover, ICON-2.8 km displayed a better performance in estimating the time interval when the maximum wind gust values were observed.
Despite the difference between the observed and forecasted values shown by comparison with the nearest grid point values, analysis from the modeled wind gust field for larger areas shows a good agreement with the observed phenomenon, as can be seen from Figure 10, where results for stations Tarcu and Sinaia are exemplified.
3.3 Statistical evaluation
A short statistical evaluation for the analyzed period was also performed for T2M (K), TD2M (K), PS (Pa) and FF (m s-1), following the methodology presented in section 2.2 and employed later on for the 2020 summer period. The results for ME and RMSE (average values over the entire country) computed with up to 30 h anticipation from both models are presented in Figure 11.
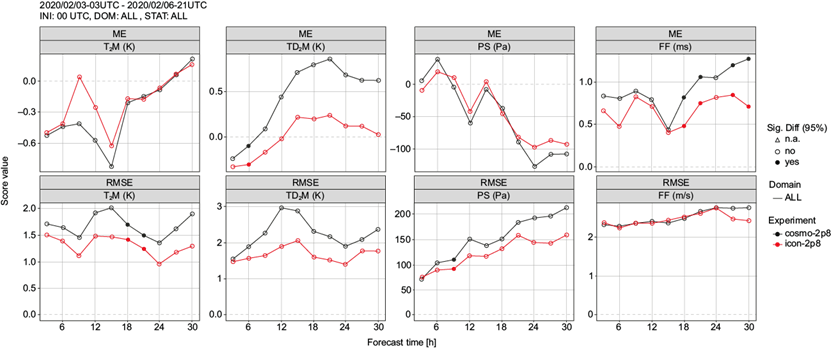
Fig. 11 ME (top row) and RMSE (bottom row) for T2M (K), TD2M (K), PS (Pa), and FF (m s-1), from left to right. Results from COSMO-2.8 km are in black and results from ICON-2.8 km in red up to 30 h forecast. Filled dots represent significant differences. (ME: mean error; RMSE: root mean square error; T2M: 2-m temperature; TD2M: 2-m dew point temperature; PS: surface pressure; FF: 10-m wind speed.)
For T2M, both models display a general tendency to underestimate forecasted values compared to observations for up to 24 h lead time (Fig. 11). The error amplitude for this case is up to 1.5 deg K for ICON-2.8 km and up to 2 deg K for COSMO-2.8 km. This difference in forecasting quality for the two models is visible especially during the day, when ME values suggest a better performance from the ICON model. A generally better behavior from ICON-2.8 km is also shown by a reduction in the amplitude of errors compared to COSMO-2.8 km.
A significant difference in forecast quality between the two models is also shown by the results for TD2M (Fig. 11), with overestimation of the values forecasted starting with 9 h lead time for COSMO-2.8 km and 12 h lead time for ICON-2.8 km. However, both ME and RMSE values are smaller for ICON-2.8 km compared to COSMO-2.8 km.
An underestimation of PS values can be observed starting with 9 h lead time, for both models. RMSE values also suggest a continuous increase in the amplitude of errors with lead time (Fig. 11). As with T2M and TD2M, a better performance from ICON-2.8 km is visible through generally lower ME and RMSE values when compared to COSMO-2.8 km for the first 30 h of lead time.
Errors in forecasting FF are quite small and both models slightly overestimate the values forecasted for this parameter. A slightly better performance from ICON-2.8 km can be observed, especially for the later forecast times.
Statistical scores computed for the analyzed period for 12-h accumulated precipitation regarding the first threshold (0.1 mm) indicate a good probability of detection and a reduced false alarm rate from both models for lead times up to 30 h, with no significant differences between them, as can be seen in Table III. POD and FAR values for this parameter from both models suggest a reduction in forecast quality for the higher thresholds. The difference between the two models for the higher thresholds (10 and 20 mm) is more visible, with a slightly better performance from ICON-2.8 km. For the later forecast times of ICON-2.8 km (up to 78 h), a more significant decrease in forecast quality is also observed for the first two thresholds. It is important to note that numerical values are also influenced by the short period analyzed, which results in a low number of observations used in the computation of scores.
Table III Statistical scores POD and FAR computed between March 3 and March 6, 2020, for RR_12h (thresholds RR_12h ≥ 0.1 mm 12 h-1, 10 mm 12 h-1, and 20 mm 12 h-1) for COSMO-2.8 km and ICON-2.8 km.
| Lead time | 18 h | 30 h | 54 h | 78 h | |||
| Model | COSMO- 2.8 km | ICON- 2.8 km | COSMO- 2.8 km | ICON- 2.8 km | ICON- 2.8 km | ICON- 2.8 km | |
| Parameter | Score | ||||||
| RR_12h > 0.1 | POD | 0.82 | 0.82 | 0.84 | 0.82 | 0.79 | 0.75 |
| FAR | 0.35 | 0.32 | 0.37 | 0.33 | 0.37 | 0.41 | |
| RR_12h > 10 | POD | 0.2 | 0.28 | 0.43 | 0.48 | 0.39 | 0.35 |
| FAR | 0.73 | 0.69 | 0.74 | 0.71 | 0.80 | 0.77 | |
| RR_12h > 20 | POD | 0.05 | 0.06 | 0.14 | 0.14 | 0.16 | 0.14 |
| FAR | 0.97 | 0.95 | 0.93 | 0.94 | 0.93 | 0.88 | |
POD: probability of detection; FAR: false alarm rate; RR_12h: 12-h accumulated precipitation.
4. Case study: Convergence zone event
4.1 Synoptic analysis
The synoptic evolution of the second case of interest, May 3-5, 2020, was influenced by an extended ridge over northern Africa as a result of an intensified Azores anticyclone, as can be seen from temperature and geopotential height values at the 500 hPa level obtained from the European Centre for Medium-Range Weather Forecasts (ECMWF) analysis data (shown in Figure 12 for May 2, 2020 at 00:00 UTC). This led to increasing atmospheric pressure over southwest and central Europe during the next days. An increase in pressure was also visible, especially over the North Atlantic (the weather regimen was characterized by high pressure), while an atmospheric cyclone developed in the area of the Azores islands. This synoptic regimen led to a negative North Atlantic Oscillation, while the atmospheric circulation over Europe and the Atlantic Ocean was characterized by blocking patterns.
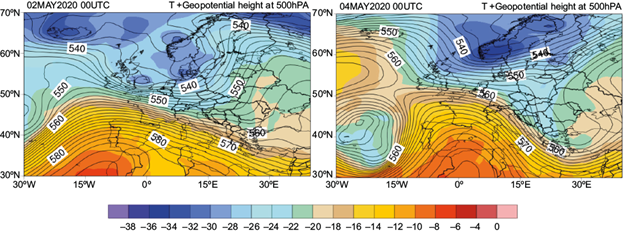
Fig. 12 500-hPa temperature (shaded) and geopotential height (contour) at 00:00 UTC on (left) May 2, 2020 and (right) May 4, 2020. European Centre for Medium-Range Weather Forecasts (ECMWF) analysis.
ECMWF analysis data for May 3, 2020 at 12:00 UTC suggest a significant intrusion of cold air over Central Europe, while a short wave through was visible at 500 hPa. During the next period (May 4, 2020 at 00:00 UTC) the through developed towards the south, evolving into a cut off nucleus over northern Greece (Fig. 12, right).
A low-pressure nucleus was formed over the north of the Balkanic Peninsula and southeastern Romania, which was later on retrograde evolution over the western basin of the Black Sea and the north-northwestern areas of the continent.
During this period, the ridge from the Azores anticyclone slightly advanced towards the western and northern areas of Romania, which lead to an increased pressure gradient. In this context, the atmospheric circulation was intensified in the southwest and east areas of the country. At the same time, a convergence area was formed over the southern regions. This convergence area facilitated the development of convective phenomena, which coupled with the short wave through enabling large scale air ascendance, led to an amplification of cloud formation over these areas, with local precipitation amounts over 50 L m-2.
During the last interval (starting on May 5) a new cold air advection over Central Europe led to a rapid evolution of the large scale through over northern Germany, into a cut off structure, which reached north-western Romania around May 6 at 00:00 UTC. In the lower atmosphere, a secondary cyclonic perturbation developed over Poland and traveled towards Eastern Europe. The cold air mass associated with this perturbation also affected the Romanian territory, while at the 850 hPa level the zero-degree isotherm was present. As a consequence, at Romanian mountainous stations above 1500 meters precipitation turned into sleet and snow.
4.2 Results and discussion
Very high amounts of precipitation were registered over the Romanian territory during the May 3-5, 2020 interval. Numerical simulations performed with each model for this case are generally in agreement with the observed precipitation field (Figs. 13-14). The most significant precipitation amounts for this interval were registered between May 3 at 06:00 UTC and May 4 at 06:00 UTC. The spatial distribution pattern is well captured by both COSMO-2.8 km and ICON-2.8 km 30 h prior to the event (Fig. 13). Both models simulate an area of heavy precipitation that covers most of the country with the exception of the southeast and western regions, similar to the spatial distribution shown by observations. In this aspect, a slightly better performance from ICON-2.8 km (+30 h) is suggested by the low precipitation amounts simulated for the west part of the domain of interest, in accordance with the observations of up to 5 mm 24 h-1, whereas COSMO-2.8 km forecasted no precipitation for this area. On the other hand, COSMO-2.8 km simulations display a better coverage of the northwest regions of the country, where the ICON-2.8 km (+30 h) spatial distribution is restricted to the mountainous area.
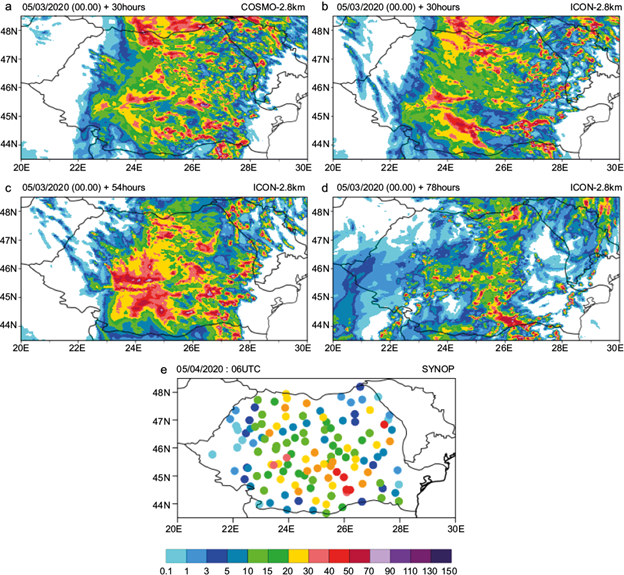
Fig. 13 24-h accumulated precipitation for May 3, 2020 at 06:00 UTC to May 4, 2020 at 06:00 UTC. (a) COSMO-2.8 km +30 h; (b) ICON-2.8 km + 30 h; (c) ICON-2.8 km + 54 h; (d) ICON-2.8 km + 78 h, and (e) observations (represented by filled dots).
The ICON-2.8 km simulation with 54 h lead time also captures the spatial distribution of precipitation for this case, with reduced or no precipitation over the west and southeast, and heavy precipitation over the rest of the country; however, the amounts are strongly overestimated, as is the extent of the area with > 20 mm 24 h-1.
The earliest ICON-2.8 km simulation (+78 h) presents the best representation precipitation amounts in the central and southern regions of the country, with the least overestimation from all simulations. The general extent of heavy rainfall (observed mainly for the central and southern areas of the country) is well captured in terms of spatial distribution and intensity of the event. The registered maximum precipitation amounts of up to 50 mm 24 h-1 are estimated by ICON-2.8 km simulations +30 and +78 h (Fig. 13), whereas COSMO-2.8 km and ICON-2.8 km (+54 h) estimate false maxima of up to 90-110 mm 24 h-1 for the lower regions of the Carpathian Mountains and some areas of the southern Carpathians. However, the low precipitation amounts registered during the analyzed period in the western and eastern extremities of the country were not adequately estimated by the ICON-2.8 km simulation with 78 h lead time.
In all cases, the distribution of amounts is shifted compared to observations. In particular, COSMO-2.8 km forecasts higher precipitation amounts for larger areas compared to both ICON-2.8 km and surface measurements.
For the next period of interest (May 4 at 06:00 UTC to May 5 at 06:00 UTC), the spatial distribution of precipitation covers again most of the country, with low to no precipitation in the east, west and southwest areas. Heavy precipitation is limited to local areas in the south and southeast of the country. ICON-2.8 km simulations with 30 and 54 h lead time to the event and COSMO-2.8 km offer a good representation of its spatial distribution for (Fig. 14).
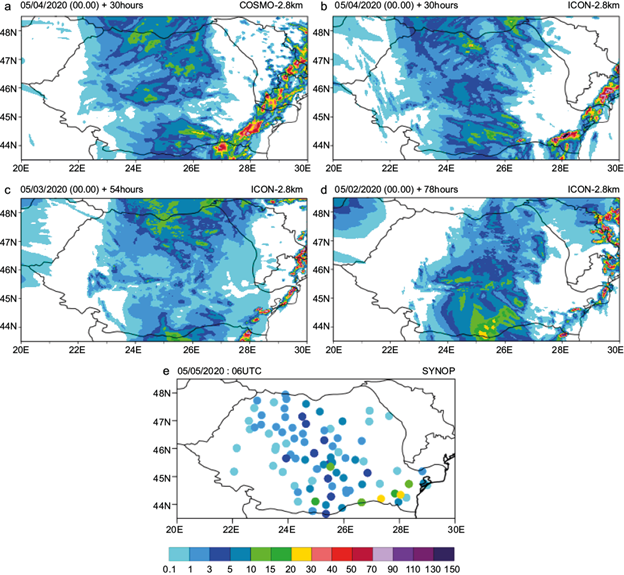
Fig. 14 24-h accumulated precipitation for May 4, 2020 at 06:00 UTC and May 5, 2020 at 06:00 UTC. (a) COSMO-2.8 km + 30 h; (b) ICON-2.8 km + 30 h; (c) ICON-2.8 km + 54 h; (d) ICON-2.8 km + 78 h, and (e) observations (represented by filled dots).
In a similar way to the spatial distribution of precipitation simulated for the previous day, a slightly better performance from ICON-2.8 km (30 h forecast time) is suggested for the low precipitation area in the west part of the country. Simulations of the same model with 54 h lead time and those obtained with COSMO-2.8 km forecast a restricted spatial distribution for the precipitation in this area. All three simulations (COSMO-2.8 km with 30 h lead time, and ICON-2.8 km with 30 and 54 h lead time) capture the area of maximum precipitation intensity, but it is overestimated compared to observations, both in spatial distribution and amounts. The best estimates in this case are given again by ICON-2.8 km with 54 h lead time. Both simulations performed with 30 h lead time strongly overestimate either the spatial extent of the affected area (COSMO-2.8 km) or the maximum precipitation amounts (COSMO-2.8 km and ICON-2.8 km).
For all three simulations (one from COSMO-2.8 km and two from ICON-2.8 km), the strongest overestimation of precipitation both in amounts and spatial distribution is observed for the southeastern area of the country (Fig. 14).
4.3 Statistical evaluation
For this case, a short statistical evaluation was also performed for T2M (K), TD2M (K), PS (Pa) and FF (m s-1), following the methodology presented in section 2.2. Results for ME and RMSE computed with up to 30 h lead time from both models are presented in Figure 15.
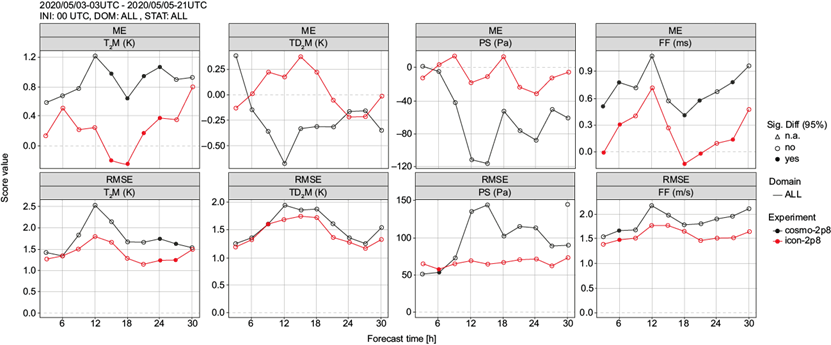
Fig. 15 ME (top row) and RMSE (bottom row) for T2M (K), TD2M (K), PS (Pa) and FF (m s-1), from left to right. Results from COSMO-2.8 km are in black and results from ICON-2.8 km in red up to 30 h forecast. Filled dots represent significant differences. (ME: mean error; RMSE: root mean square error; T2M: 2-m temperature; TD2M: 2-m dew point temperature; PS: surface pressure; FF: 10-m wind speed.)
In the forecasting of T2M, COSMO-2.8 km shows a general tendency to overestimate values compared to observations (Fig. 15). ICON-2.8 km tends to overestimate values only during morning and night. The error amplitude is up to 1.75 deg K for ICON-2.8 km and up to 2.5 deg K for COSMO-2.8 km. Both ME and RMSE values suggest a better performance from the ICON model for the entire period. A generally better performance of ICON-2.8 km is also shown by the results for TD2M (Fig. 15).
For COSMO-2.8 km, an underestimation of PS values can be observed for the entire forecast period. For ICON-2.8 km, some small overestimations are observed in morning and evening. RMSE values for both models suggest a continuous increase in the amplitude of errors with the lead time in forecasting this parameter (Fig. 15). As with T2M and TD2M, a better performance from ICON-2.8 km is visible through generally lower ME and RMSE values when compared to COSMO-2.8 km for the first 30 h of lead time.
As in the previous case presented in this study, errors in forecasting FF are quite small. While both models slightly overestimate the values forecasted for this parameter, the better performance of ICON-2.8 km can be observed especially for later anticipations.
POD and FAR values presented in Table IV for 12-h accumulated precipitation for the first threshold (0.1 mm) indicate a good performance of both models for lead times up to 30 h, with slightly more visible differences for lower lead times (18 h).
Table IV Statistical scores POD and FAR computed between May 3 and May 5, 2020, for RR_12h (thresholds RR_12h ≥ 0.1 mm 12 h-1, 10 mm 12 h-1, and 20 mm 12 h-1) for COSMO-2.8 km and ICON-2.8 km.
| Lead time | 18 h | 30 h | 54 h | 78 h | |||
| Model | COSMO- 2.8 km | ICON- 2.8 km | COSMO- 2.8 km | ICON- 2.8 km | ICON- 2.8 km | ICON- 2.8 km | |
| Parameter | Score | ||||||
| RR_12h > 0.1 | POD | 0.84 | 0.86 | 0.81 | 0.80 | 0.75 | 0.70 |
| FAR | 0.29 | 0.31 | 0.31 | 0.30 | 0.32 | 0.35 | |
| RR_12h > 10 | POD | 0.41 | 0.41 | 0.37 | 0.42 | 0.31 | 0.24 |
| FAR | 0.61 | 0.62 | 0.69 | 0.63 | 0.71 | 0.81 | |
| RR_12h > 20 | POD | 0.27 | 0.29 | 0.08 | 0.32 | 0.04 | 0.06 |
| FAR | 0.82 | 0.81 | 0.93 | 0.82 | 0.96 | 0.96 | |
POD: probability of detection; FAR: false alarm rate; RR_12h: 12-h accumulated precipitation.
Numerical values of scores computed for each model indicate a lower forecast quality for higher thresholds. The difference between the two models for higher thresholds (10 and 20 mm) is more visible especially for the 30 h lead time, with a better performance from ICON-2.8 km. For the later forecast times of ICON-2.8 km (54 and 78 h), a strong decrease in forecast quality is visible for the higher thresholds. However, a good performance of the model is still observed for lower thresholds. As in the previous case, presented in section 3, the statistical scores are computed taking into account a short period of time, thus a low number of observations is employed for computation.
5. Summer 2020
5.1 Synoptic regimen
The 2020 summer season was characterized by significant precipitation in the western and central areas of the country and by droughts in the rest of the territory. For the southeastern part of the country (Dobrogea), 2020 was the driest agricultural year since 1961. High temperatures were recorded in the southern and eastern areas. June was marked by strong atmospheric instability, mostly during the afternoon, with daily general and nowcasting warnings. This period was characterized by significant precipitation, with new records for monthly or daily precipitation registered at many Romanian meteorological stations. As previously mentioned, amounts of precipitation for the western and central areas of the country surpassed normal records for this period up to three times, while for the rest of the country drought had different degrees of intensity.
During the beginning of July and also for the last part of this month, southern and eastern areas of the country were affected by high temperatures and a strong thermal discomfort. During the middle of the month, temperatures were quite low, with a new record minimum temperature for this period of the year observed in the southwestern part of the country. The last interval of the month was also characterized by “tropical nights”, with temperatures over 20 ºC for areas outside the Carpathian mountainous range. On the other hand, heavy precipitation was registered for the western regions of the country, but drought was intensified in the south and southeastern parts of the country, supported also by high temperatures for these areas. High temperatures were observed mostly in August (and continued to September) with an intensification of drought for the south and southeastern part of the country. The highest temperatures of the season were registered during the last days of August (for example, in Bucharest, a maximum temperature of 38.1 ºC on July 31).
5.2 Statistical evaluation and intercomparison
In order to achieve an objective comparison of the performance from the two models, a statistical evaluation was carried out for the 2020 summer. As mentioned in section 2, the observation data set was split into two areas, one comprising the stations located in the western and central regions of the country (including most mountainous stations), and another with stations from the southern and eastern regions (most of them with altitudes below 300 masl). On the graphs below (Figs. 16-18), the two regions are denoted ROCW (west and central) and ROSE (south and east), respectively.
For T2M, the models display a tendency to overestimate forecasted values compared to observations during nighttime (Fig. 16). During daytime, however, both models underestimate the values forecasted for this parameter. This behavior was also visible from the ICON-2.8 km simulation for the second case study, presented in section 4. The error amplitude for the summer period is around 2 deg K (similar to results obtained for the two case studies), slightly higher during the day. ME values situated between -1 and 1 deg K suggest a better performance from the ICON model only during nighttime. However, a generally better behavior from ICON-2.8 km is shown by the reduction in the amplitude of errors compared to COSMO-2.8 km. Moreover, the behavior of ICON-2.8 km is similar for the entire forecast period (up to 78 h), with no significant increase of ME values. A very small increase in the amplitude of errors is visible during daytime for the latter forecast times. The behavior of the models is similar for both areas of interest, with smaller errors for the central and western regions during the day, while during the night a better performance is observed for the southern and eastern areas. This difference in forecast quality for the two areas of the country is slightly more visible in ICON-2.8 km.
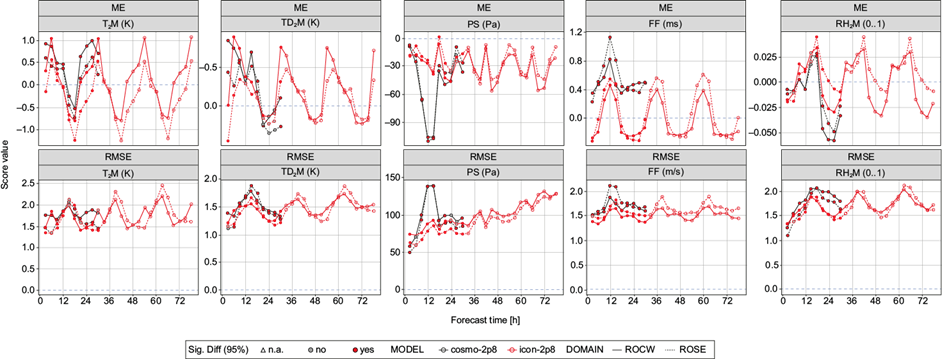
Fig. 16 ME (top row) and RMSE (bottom row) for T2M (K), TD2M (K), PS (Pa), FF (m s-1) and RH2M (0...1) from left to right. Results from COSMO-2.8 km are in black and results for ICON-2.8 km are in red, both for ROCW (solid line) and ROSE (dotted line). Filled dots represent significant differences. The blue dotted line represents the perfect score. (ME: mean error; RMSE: root mean square error; T2M: 2-m temperature; TD2M: 2-m dew point temperature; PS: surface pressure; FF: 10-m wind speed; RH2M: 2-m relative humidity; ROCW: central and western regions; ROSE: southern and eastern regions.)
A diurnal cycle is also visible from the results of TD2M (Fig. 16), with overestimation for values forecasted during daytime and slight underestimation for nighttime; however, ME and RMSE values are smaller than for T2M. The behavior of the two models is similar in forecasting TD2M, with a reduction of both error and amplitude for ICON-2.8 km compared to COSMO-2.8 km. For this parameter, differences in forecast accuracy for the two areas are slightly more visible for ICON-2.8 km during daytime.
An underestimation of PS values can be observed during the entire forecast period, for both models and areas of interest. RMSE values shown in Figure 16 suggest a continuous increase in the amplitude of errors with the lead time for this parameter. A better performance from ICON-2.8 km is visible through generally lower ME and RMSE values compared to COSMO-2.8 km for the first 30 h of lead time (Fig. 16). The accuracy of COSMO-2.8 km in forecasting this parameter is similar for both areas on interest. For ICON-2.8 km, a small reduction in the amplitude of errors can be observed for the south and east regions, especially during the first forecast interval. A similar behavior of both models in forecasting this parameter was also generally observed from the statistical results presented for the two test cases, considering the model performance for the entire country.
Although errors in forecasting FF are quite small, the behavior of the two models is somewhat different. While COSMO-2.8 km overestimates the values forecasted for this parameter for the entire day, ICON-2.8 km only displays this behavior during daytime; for night hours, the general tendency of ICON-2.8 km is to underestimated FF values compared to observations. For this parameter (Fig. 16), a better performance from both models is visible for the central and western regions of the country. However, ICON-2.8 km performs better for both areas, with a visible reduction of errors, both in terms of mean values and with respect to their amplitude. For PS, ICON-2.8 km displays the most pronounced increase in error amplitude from all the analyzed surface parameters.
Finally, regarding RH2M (Fig. 16), the diurnal cycle is again visible (overestimation during the day, underestimation during the night) for both models and areas, with slightly larger errors for the southern and eastern regions. Again, a generally better performance is shown by ICON-2.8 km, with some slight systematic increase in error amplitude for the latter forecast times.
Except for FF, the two models’ behavior is similar for the forecast of surface parameters (Fig. 16), having generally the same periods of overestimation and underestimation. A higher accuracy is shown by ICON-2.8 km in estimating these parameters compared to COSMO-2.8 km. Despite a systematic increase in error amplitude for the latter forecast times, the behavior of ICON-2.8 km is generally maintained for the entire forecast period.
With regards to the forecast of precipitation (12-h accumulated) in central and western areas of the country, for the first threshold (0.1 mm), POD values > 0.5 suggest a good probability of detection from both models for the first 30 h of forecast; no significant differences between the two models are observed in this case (Figs. 17 and 18). Results for FAR for this threshold and area are also similar between the two models, with values around 0.25-0.35. Moreover, differences between the two models in this region are insignificant for the first 30 h.
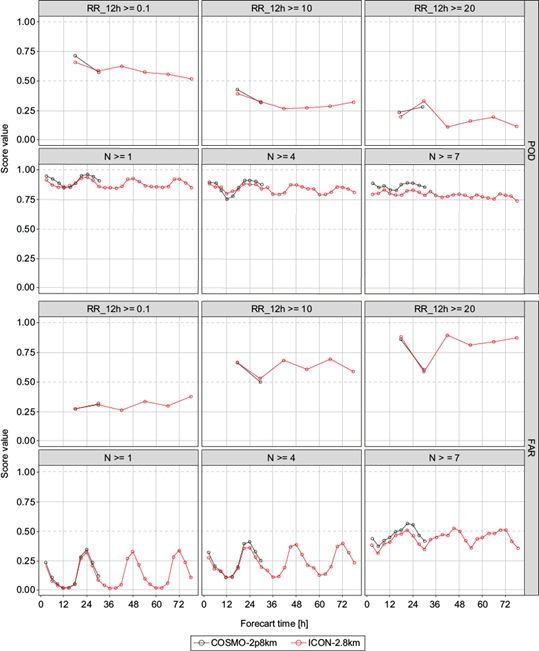
Fig. 17 Statistical scores POD (first and second rows) and FAR (third and fourth rows) for RR_12h and N, both for ROCW. Results for COSMO-2.8 km are in black and results for ICON-2.8 km in red. From left to right: RR_12h ≥ 0.1 mm 12 h-1, 10 mm 12 h-1, and 20 mm 12 h-1; N ≥ 1, 4, 7. (ROCW: west and central regions; POD: probability of detection; FAR: false alarm rate; RR_12h: 12-h accumulated precipitation; N: total cloud cover.)
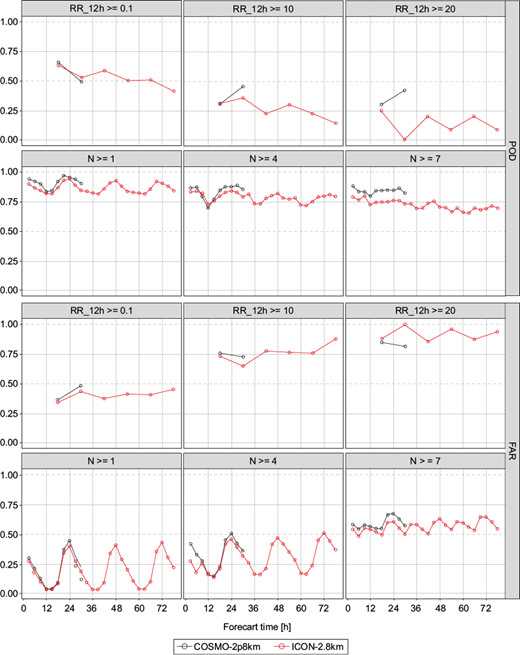
Fig. 18 Statistical scores POD (first and second rows) and FAR (third and fourth rows) for RR_12h and N, both for ROSE. Results for COSMO-2.8 km are in black and results for ICON-2.8 km in red. From left to right: RR_12h ≥ 0.1 mm 12 h-1, 10 mm 12 h-1, and 20 mm 12 h-1; N ≥ 1, 4, 7. (ROSE: south and eastern regions; POD: probability of detection; FAR: false alarm rate; RR_12h: 12-h accumulated precipitation; N: total cloud cover.)
As can be seen from figures 17 and 18, POD and FAR values for accumulated precipitation (RR_12h) from both models are generally worse for the southeast area of the country compared to the central and western regions, especially for the higher thresholds. Moreover, the difference between the two models for this area is more prominent, with a slightly better performance from COSMO-2.8 km during the first 30 h of forecast, both in terms of POD and FAR. For the later forecast times of the ICON-2.8 km model (up to 78 h), a more significant decrease in forecast quality is also observed for the southeast area of the country. It is important however to note that this result is also influenced by the lower number of observations for this region.
Although the performance of both models is slightly better for the central and western areas of the country, their main tendency is similar for the two regions of interest, with no significant changes in behavior. POD and FAR values for both regions and models show that the forecast quality for precipitation generally decreases for upper thresholds and later forecast times.
For N (Figs. 17 and 18), forecast differences for the two regions of the country are insignificant; slightly larger errors are visible for the southern and eastern regions, but differences are negligible. High POD values and relatively small FAR values for both regions and all thresholds suggest a strong performance of both models in forecasting this parameter. The good quality of the forecast is generally sustained for all thresholds, with only a small reduction of POD values for the higher thresholds and a generally small increase in FAR values. Only for the 7 octa threshold, a slightly higher increase in FAR values is observed. The models display a similar behavior and scores are comparable for both areas. Errors are visible especially during the night for both models and areas. For the first 30 h of forecast, slightly higher POD values are obtained from COSMO-2.8 km, but ICON-2.8 km performs better in terms of FAR.
Regarding ICON-2.8 km (which is integrated for a longer period of time), only a small decrease of the model’s performance in forecasting N is visible for the lead times up to 78 h, mainly for the highest threshold.
6. Concluding remarks
In order to implement a numerical weather prediction model in operational weather forecast activity, a thorough evaluation of the model performance should be carried out, both for extended periods of time and for high impact weather cases, leading to identification of patterns specific to each numerical model. The COSMO and ICON numerical weather prediction models were integrated at the horizontal resolution of 2.8 km for the Romanian territory to achieve a first detailed intercomparison for this area of interest.
The present comparison between the two models was carried out first for two cases of interest with strong atmospheric instability, observed heavy precipitation or strong wind: February 3-6, 2020 (heavy precipitation/snow and very strong wind), and May 3-5, 2020 (atmospheric instability, heavy precipitation).
The analysis of the models’ performance in simulating strong wind representative of the February case showed that the maximum wind gust values of over 50 m s-1 registered at some mountainous stations were underestimated by both models. However, a good indication of the phenomenon’s intensity was offered by estimates of sustained wind gusts over 20 m s-1 for a long interval of time, in accordance with the observations. Comparative analysis of hourly forecasts for five stations of interest in the areas most affected by strong winds, suggested a better performance of ICON-2.8 km in estimating the time interval when maximum wind gust values were observed, as well as the values themselves. Statistical evaluation for 10 m wind speed also suggests a better quality from ICON-2.8 km forecasts for this parameter.
For the same winter case, the intercomparison of the two models showed that both COSMO-2.8 km and ICON-2.8 km show a good accuracy in estimating the spatial distribution and maximum values of snow height. Both models perform well in simulating snow height for mountainous areas, with slightly better accuracy in simulating the spatial and quantitative distribution of this parameter by ICON-2.8 km.
The analyzed cases were characterized by heavy precipitation. For both events, false maximum amounts were forecasted by the models. Areas of intense precipitation forecasted both by COSMO-2.8 km and ICON-2.8 km were more extended compared to observations. However, stronger overestimations of intense precipitation areas were generally displayed by COSMO-2.8 km. Although both models showed some problems in representing the areas with either extreme heavy precipitation or no precipitation at all, the general extent of heavy rainfall was well captured in terms of spatial distribution and intensity of the event in both case studies. Moreover, for both cases, a strong performance was seen from ICON-2.8 km integrated with 54 h lead time.
The case study is followed by an objective statistical evaluation for the performance of the two models integrated for the summer season of 2020, performed for two separate areas of the country due to the different synoptic regimen. Both the scores for continuous parameters and the dichotomic scores suggest a similar behavior between the COSMO-2.8 km and ICON-2.8 km models, with a better performance of both models for the western and central regions of the country (mainly consisting of areas not affected by drought).
The improvement of the ICON-2.8 km forecasts compared to COSMO-2.8 km is more visible for surface parameters, both in terms of amplitude and value of the errors, with a consistently better performance from ICON-2.8 km for the summer period. These results are also consistent with those obtained for selected parameters analyzed in the two test cases presented. During the summer period, the diurnal cycle is visible in the forecast of various parameters such as T2M and TD2M for both models.
Given the more extended forecast interval for ICON-2.8 km, statistical scores were computed for up to 78 h for the summer period, with no significant change in model quality for the latter forecast times, except for surface pressure.
The results for the forecast of precipitation show no significant differences between the two models. In general, the performance of both models is slightly better in forecasting precipitation for the central and western areas of the country. For the lowest precipitation threshold (0.1 mm), a good probability of detection is shown by both models for the first 30 h of forecast, without any significant differences between the two. Score values computed for both regions and models show that the forecast quality drops significantly for the upper thresholds and for later forecast times.
As previously mentioned, a less extensive comparison between the two models was also presented in the reports by Rieger et al. (2021, 2022), where comparable scores were obtained for the forecast of T2M, FF, PS, N, and RR_12h during the 2020 autumn. The similar results obtained between the two studies extend the validity of the findings to a longer time interval, with more detailed evaluation for the cold season to be carried out in the future.
Although the forecast of precipitation still poses some problems that would require further investigation, in general, the ICON-2.8 km configuration for Romanian territory mostly outperforms the COSMO-2.8 km configuration, especially for surface parameters such as FF, RH2M, and PS.


 nueva página del texto (beta)


