1. Introduction
Vegetation indices (VI) are the foremost important metrics to watch ecosystem and land surface processes (Nicholson et al., 1990; Ichii et al., 2002; Wang et al., 2003; Gu et al., 2008). Vegetation changes play an essential role in the environmental process. They are a decent indicator of climate, hydrology, energy balance, and hydrological cycles (Nicholson et al., 1990; Farrar et al., 1994). Recent research suggests that environmental changes, particularly climate change, have led to decreased food security and vegetation cover alterations (Akram et al., 2018; Ali et al., 2019; Din et al., 2022). The ecosystem and vegetation are changing due to climate change (Fahad et al., 2017; Hateffard et al., 2021). The knowledge regarding the long-term variation of VI plays a vital role in determining the climate change pattern and monsoon variability (Amin et al., 2017; Baqa et al., 2022). The interconnectedness of vegetation cover with various ecological processes such as the energy cycle, hydrology, and climate has also been discussed in several studies (Hussain et al., 2020a; Masood et al., 2022; Chandra et al., 2023, De et al., 2023). The role of vegetation in mitigating climate change effects and its importance in studying plant phenology and biomass are also emphasized in literature (Feizizadeh et al., 2013; Sabr et al., 2016; Hassan et al., 2021; Karuppasamy et al., 2022; Naz et al., 2022; Hussain et al., 2023a; Yang et al., 2023a, b). These findings underscore the importance of understanding and monitoring vegetation dynamics in the context of climate change and food security.
The Normalized Difference Vegetation Index (NDVI) is one of the most recognized and commonly used parameters to review vegetation cover and crop health (Sellers et al., 1986; Piao et al., 2003). It indicates the greenness of the land surface and, therefore, vegetation density (Choubin et al., 2017; Sajedi-Hosseini et al., 2018). The Enhanced Vegetation Index (EVI) is another parameter that minimizes canopy-soil variations and improves sensitivity over dense vegetation conditions. The NDVI serves as a valuable tool in monitoring vegetation health and dynamics due to its correlation with chlorophyll content and leaf area index and has wide application in assessing land use/land cover changes (LULC), detecting crop types, estimating crop yield and production, among others (Sultana et al., 2014; Rani et al., 2018, Tariq et al., 2020). NDVI values are indicative of the biological activities of plants and can effectively characterize changes in active surface temperature, providing insights into vegetative cover conditions (Zahoor et al., 2019; Aslam et al., 2021). While the NDVI is particularly sensitive to chlorophyll activity, EVI complements it by capturing structural differences in plants, making it especially useful for delineating tropical forests. Together, NDVI and EVI contribute significantly to our understanding of vegetation dynamics and ecosystem health (Matsushita et al., 2007; Waleed et al., 2022; Vélez et al., 2023).
The variation of different vegetation indices and their relationship with various climatic parameters is vital to understanding the effect of climate change on vegetation expansion. It has been evident that both NDVI (Rouse, 1974) and EVI have a reference to rainfall (Liu and Huete, 1995; Potter and Brooks, 1998; Richard and Poccard, 1998; Wu et al., 2016). The satellite-derived vegetation index is a well-accepted and primarily used method to explore the response of vegetation over a location (Tucker, 1979; Piao et al., 2011; Zhang et al., 2013).
In recent years, satellite-derived vegetation index has been a crucial tool to assess vegetation dynamics at regional to global scales (Myneni et al., 1997; Zhao et al., 2012; Cleland et al., 2006; Schwartz et al., 2006; Ssemmanda et al., 2014; Cao et al., 2018). Satellite-derived NDVI data is a crucial indicator for analyzing the growth of green vegetation and the effect of climate change on vegetation dynamics (Walther et al., 2002; Zhang et al., 2002; Yu et al., 2003; Piao et al., 2006; Philippon et al., 2007; Zhao et al., 2015). It has been seen that the spatial patterns of annually integrated NDVI closely reflect the mean annual rainfall over East Africa and the Sahel (Nicholson et al., 1990). An increase in NDVI was evident in Tanzania from 1982 to 1994, as seen in NDVI imagery (Pelkey et al., 2000).
The intricate relationship between global warming, vegetation cover, and various environmental processes has been discussed by many authors. Global warming, attributed largely to human activities since the Industrial Revolution, has increased land surface temperature (LST). This temperature rise has significant implications for vegetation cover, as outlined by various studies (Nasim et al., 2018; Hussain et al., 2020a, b; Mubeen et al., 2021; Akram et al., 2022). The rise in temperature and decreased precipitation results in more drought conditions and reduced vegetation in Kenya (Ogutu et al., 2008). It has been observed that various weather parameters like precipitation, land surface temperature (LST), soil moisture (SM), and solar radiation significantly impact vegetation growth (Lakshmi and Barbosa, 2012). The regression analysis findings over the Sahiwal region, Pakistan, indicate a significant relationship between LST values and both the Normalized Difference Vegetation Index (NDVI) and Enhanced Vegetation Index (EVI). Specifically, where LST values are lower, NDVI and EVI values tend to be higher and more significant. Conversely, in areas with higher LST values, NDVI and EVI values are lower (Hussain, et al., 2023b). A negative correlation between the NDVI and temperature has been observed in north China (Yang et al., 2023b). The yearly and seasonal variation of NDVI and its relation to precipitation were observed over the Gojeb River catchment from 1982 to 2015 (Dagnachew et al., 2020).
Together with human activities, environmental changes have a significant impact on vegetation (Sha et al., 2020). Long-term variation of vegetation dynamics has been discussed with the help of Advanced Very High Resolution Radiometer (AVHRR) sensors (Eastman et al., 2013). NDVI shows an upward trend with temperature and precipitation before the 1990s, whereas a downward trend in the NDVI has been observed since the mid or late 1990s. Landsat-7 ETM data has been used to find the relationship between NDVI and LST (Mallick et al., 2012 Senanayake et al., 2013). The correlation values between NDVI and TST, SM, and precipitation are -0.45, 0.43, and 0.34, respectively, over Gautam Budha Nagar, India (Sharma et al., 2022). The long-term variation of precipitation and temperature and its effect on the annual crop production has been observed using Landsat data over India (Basistha et al., 2009; Kundu and Dutta 2011; Duhan and Pandey, 2013; Gautam et al., 2020; Dutta et al., 2015; Sahoo et al., 2015; Kundu et al., 2017). The precipitation value at each station has been interpolated using ArcGIS 9.3 to find the spatial variation of rainfall. Duhan et al. (2013) showed that mean annual precipitation has varied from 694 mm (at Westnimar) to 1416 mm (at Mandla). Kundu and Dutta (2011) demonstrated a varying pattern of vegetation dynamics in response to rainfall over the Bundelkhand area. Sahoo et al. (2015) found a good agreement between satellite-derived and meteorological drought indices. The effect of SM on vegetation growth has also been studied by Gao et al. (2014), who used a wireless sensor network to collect soil moisture data.
The significantly increasing trend in vegetation sensitivity to SM in many semi-arid and arid regions across the globe indicates a growing vulnerability of vegetation to changes in SM levels. This trend suggests that vegetation in these regions is becoming more responsive to variations in SM availability, which can have profound implications for ecosystem health, biodiversity, and the livelihoods of communities dependent on these ecosystems (Li et al., 2022). The observed strong positive correlation between SM and vegetation indices with an eight-week lag time over the USA corn belt suggests that changes in SM levels influence vegetation dynamics with a certain time delay (Adegoke and Andrew, 2002). Various techniques, such as discrete wavelet transform, artificial neural network, and feature extraction have been used to estimate the dynamical characteristics of NDVI (Demirel et al., 2010; Yamaguchi et al., 2010; Bhandaria et al., 2012). There are a few studies on the relation between EVI and weather parameters. It has been observed that EVI is the most effective vegetation index compared to in situ data over Asia during the monsoon season (Motohka et al., 2009). It has been observed that EVI can be a better index than NDVI for vegetation monitoring across various ecosystems, as it is insensitive to background reflectance and a better predictor of gross primary productivity (GPP; Rocha and Shaver, 2009). A good correlation between EVI and rainfall and temperature has been observed, with time lag effect, in Zacatecas, Mexico (Olmos-Trujillo et al., 2020). The Moderate Resolution Imaging Spectrometer (MODIS) satellite-derived EVI has been used to estimate ET, which correlates well with the actual data. The polar-orbiting MODIS sensor aboard the Terra and Aqua platforms is well accepted for environmental monitoring of the vegetation indices (Huete et al., 2002). MODIS-derived VIs present improved estimations of spatial, spectral, and radiometric representations of surface vegetation conditions (Tucker et al., 2005; Lu et al., 2015).
This comprehensive study aims to understand the dynamics of VIs and their relationship with various weather parameters in Kolkata, India, and its surrounding region. The study offers valuable insights into the complex interactions between vegetation dynamics and environmental factors in the study region. Vegetation cover plays a crucial role in various aspects of the Earth’s systems and processes, like hydrology and regional and global climate change, variations in the terrestrial ecosystem, soil ecosystems, and others. Overall, vegetation cover is a cornerstone of Earth’s ecosystems, influencing human societies, biodiversity, ecosystem functions, and climate processes. Protecting and sustainably managing the vegetation cover is essential for maintaining ecosystem health, supporting biodiversity, and mitigating climate change impacts.
The study conducted in Kolkata, India, focuses on investigating the impact of various environmental variables on vegetation indices using satellite data from 2003 to 2016. Kolkata, being a densely populated and polluted city in Southeast Asia, experiences significant anthropogenic activities that have led to drastic changes in landscape characteristics and subsequently affect vegetation dynamics. Understanding the long-term variations in weather parameters and their influence on vegetation indices is crucial for sustainable urban environment planning and urban green space management. By analyzing satellite data over a prolonged period, the study seeks to elucidate the relationship between environmental variables and vegetation health in the tropical urban context of Kolkata.
The findings of this study can serve as a valuable reference for researchers, environmental planners, and policymakers involved in sustainable urban development and environmental management. By identifying the key environmental factors influencing vegetation dynamics, stakeholders can make informed decisions regarding land use planning, green space preservation, and mitigation strategies to promote urban biodiversity and enhance the quality of urban environments in a tropical region.
2. Importance of the study location
This study focuses on the spatiotemporal vegetation changes in and around Kolkata, India. Given its geographical location near the Bay of Bengal and within the lower Ganges Delta (Fig. 1), Kolkata experiences a tropical wet and dry climate characterized by a distinct summer monsoon season and significant rainfall, especially during the pre-monsoon period known as kalbaisakhi. The city’s elevation ranges from 1.5 to 9 m, and its landscape features mangrove forests and tidal flats along the Hooghly River. Considering Kolkata’s status as the largest metropolis and a key economic hub in eastern India, understanding the vegetation dynamics in this region is crucial for assessing environmental changes, land use patterns, and their impacts on local ecosystems and livelihoods. By conducting a detailed analysis of satellite-derived vegetation data and considering the unique climatic and geographical characteristics of Kolkata and its surroundings, researchers can uncover valuable insights into the long-term trends and drivers of vegetation dynamics in this region. This information can contribute to informed decision-making processes for urban planning, ecosystem conservation, and climate change adaptation strategies.
3. Dataset
In the present study, monthly data of VIs collected from NASA GIOVANNI have been used in association with meteorological parameters over Kolkata and surrounding locations. The MOD13C2 v. 6 product provides pixel-based VI values of two primary vegetation layers at 1-km spatial resolution. NDVI was derived from the National Oceanic and Atmospheric Administration-Advanced Very High-Resolution Radiometer (NOAA-AVHRR). The EVI has better sensitivity over high biomass regions (Didan et al., 2015). From the MOD13C2 v. 6 product, NDVI has been calculated using Eq. (1):
where NIR and RED are the reflectance in the near-infrared and red channels, respectively. The two channels contain more than 90% vegetation information. Monthly precipitation data was obtained from GPM_3IMERGM v. 06. The estimated precipitation from various satellite passive microwave (PMW) sensors consists of GPM constellations and is computed using the Goddard Profiling Algorithm (GPROF2017). This data has been gridded and inter-calibrated to the GPM Combined Ku Radar-Radiometer Algorithm (CORRA) product. This GPM_3IMERGM provides monthly rainfall with 0.1º × 0.1º spatial resolution (Huffman et al., 2015; McNally et al., 2017, 2019; Skofronick-Jackson et al., 2017; Khan and Gilani, 2021). The average monthly LST values have been taken from the MOD11C3 v. 6 product with 0.05º Climate Modeling Grid (CMG). The CMG granule is a geographic grid that consists of 3600 rows and 7200 columns representing the entire globe. LST values are obtained from the daily average of the corresponding month of MOD11C1 (Wan, 2006; Wan et al., 2015). For SM and ET, Noah 3.6.1 model in the Famine Early Warning Systems Network (FEWS NET) Land Data Assimilation System (FLDAS) has been used. Total ET is related to evaporation and plant transpiration. GPP indicates the amount of carbon compound generated by the photosynthesis process of plants for a given period of time. SIF approximates the GPP. The GPP dataset used in the present study provides monthly average GPP (carbon m-2 d-1) with a spatial resolution of 8 km for the period 1982-2016. This GPP data is based on the Monteith light use efficiency (LUE) improved with spatially and temporally optimized FLUXNET tower site data (Madani et al., 2020). This dataset provides global SIF with a 0.05º × 0.05º spatial resolution from August 2002 to December 2018. The Scanning Imaging Absorption Spectrometer for Atmospheric Chartography (SCIAMACHY) and Global Ozone Monitoring Experiment 2 (GOME-2) instruments onboard the MetOp-A satellite are used to retrieve SIF data at a 740 nm wavelength. The dataset can be used for the research on drought, yield estimation, and land degradation evaluation. The details of the datasets are shown in Table I.
Table I Details of datasets.
| Elements | Period | Data source |
| NDVI | January 2001-December 2022 | MOD13V@ v. 6, NASA GIOVANNI |
| EVI | January 2001-December 2022 | MOD13V@ v. 6, NASA GIOVANNI |
| GPP | January 2001-December 2016 | METOP A satellite |
| SIF | January 2003-December 2018 | METOP A satellite |
| Rainfall | January 2001-September 2021 | GPM |
| LST | July 2002-November 2022 | MOD11C3 v. 6 |
| SM | January 2001-November 2022 | Noah 3.6.1 FLDAS |
| ET | January 2001-November 2022 | Noah 3.6.1 FLDAS |
NDVI: Normalized Difference Vegetation Index; EVI: Enhanced Vegetation Index; GPP: gross primary productivity; SIF: sun-induced chlorophyll fluorescence; LST: land surface temperature; SM: soil moisture; ET: evapotranspiration.
4. Methodology
By examining long-term variations of vegetation indices for the period 2003-2016, authors were able to capture changes in vegetation over time. The spatial variation of VIs has been observed to understand the changes. Studying the spatial variation of VIs over three different years, namely, 2003, 2010, and 2016, can provide valuable insights into changes in vegetation cover, health, and distribution over time. Using linear regression curve fitting to analyze inter-annual variability allows a deeper understanding of how vegetation responds to changes in weather conditions such as precipitation, SM, ET, and LST. Investigating monthly variations of these parameters adds granularity to the analysis, considering the temporal aspect of vegetation dynamics and weather fluctuations. Time average spatial correlation analysis helps to identify patterns across the study area, providing insights into the overall relationship between VIs and weather parameters over the studied period (2003-2016). Furthermore, conducting lag period correlation analysis through the Pearson correlation coefficient allows for exploring the potential delayed effects of weather conditions on vegetation, which can be crucial for understanding ecological processes and predicting future changes. This approach enables the identification of not only the immediate effects but also the delayed impacts of weather conditions on vegetation dynamics. The Pearson correlation coefficient was calculated using Eq. (2):
where r is the correlation coefficient; x i and y i are the values of x and y in the samples, respectively, and and are the mean values of x and y, respectively. The flow chart in Figure 2 shows the methodology.
5. Results and discussion
5.1. Spatial variation
The spatial variation of NDVI, EVI, GPP, and SIF is shown in Figure 3. Different spatial characteristics are observed in different parts of Kolkata and the surrounding region. The characteristics of highly urbanized land use dominate the northern and north-western parts of the study area, whereas the eastern part has an abundance of agricultural land use, wetlands, and also a few pockets of urban land use. A dense forest is located in the southeastern part. NDVI, EVI, GPP, and SIF reflect the nature of vegetation and its chlorophyll concentration in a region. Here, the annual average NDVI, EVI, GPP, and SIF of 2003, 2010, and 2016 have been estimated based on available satellite data. In the study area, it is observed that there are spatial differences in the features of NDVI, which are controlled by the nature of land use and land cover characteristics. A lower NDVI value is observed in the highly urbanized lands and wetlands of the Kolkata urban agglomeration, whereas the region with vegetation cover has a higher NDVI. Fig. 3a-c represents the annual average NDVI value for the periods 2003, 2010, and 2016. It has been observed that over that period of time, the nature and concentration of NDVI have increased in the northeastern corner of the study area. A similar trend has been observed in the northwestern part of the study area, where agricultural fields and settlements dominate the land use characteristics. In the south-eastern corner of the study area, no abrupt change is observed from 2003 to 2016. A decreasing trend in NDVI is observed in the eastern part of the study area, where urbanization is growing faster. A similar kind of spatial and temporal change is observed in the case of EVI (Fig 3d-f). GPP indicates the generation and concentration of carbon during the photosynthesis process by plants. There is a spatiotemporal variation in GPP (Fig 3g-i) in the study area. The higher values of GPP are found in the northeastern, southeastern, and western parts of the study area, whereas the lower values are found in the northwest corner and central to eastern parts. From 2003 to 2016, there is a decreasing trend in GPP in all sectors of the study area. SIF is a functional proxy of terrestrial GPP. The annual average SIF is calculated using METOP A satellite data. In 2003, the higher value of SIF basically concentrated in the north. In the southern, southeastern, and southwestern corners of the study area, a low value of SIF is observed. From 2003 to 2010, a dynamic spatiotemporal change in SIF is observed, whereas there is a sharp increase in SIF in the north, northeast, northwest, and western parts of the study area. However, a sharp decrease in SIF is observed in the east and southeast. From 2010 to 2016, there was a negative change in SIF in all sectors of the study area.
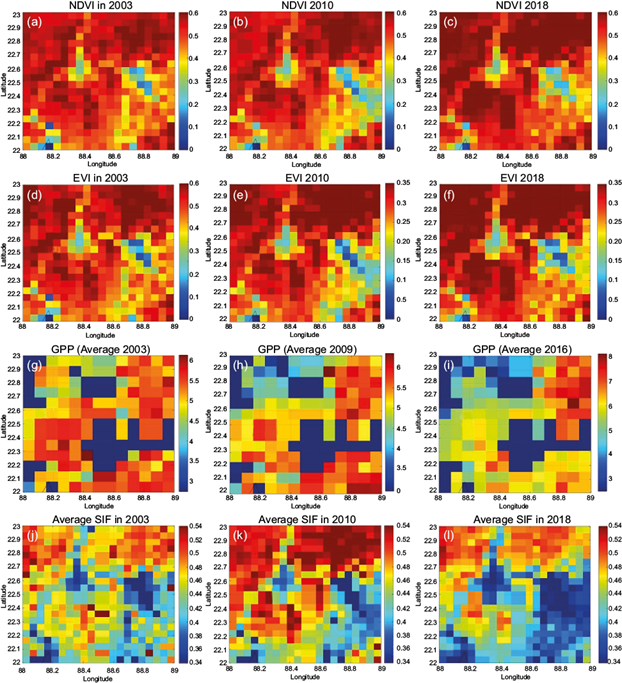
Fig. 3 Spatial variations of (a-c) NDVI for the years 2003, 2010, and 2016, respectively; (d-f) EVI for the years 2003, 2010, and 2016, respectively; (g-i) GPP for the years 2003, 2010, 2016 respectively; and (j-l) SIF for the years 2003, 2010, and 2016, respectively. (NDVI: Normalized Difference Vegetation Index; EVI: Enhanced Vegetation Index; GPP: gross primary productivity; SIF: sun-induced chlorophyll fluorescence.
The findings from the analysis of NDVI, EVI, GPP, and SIF data reveal intriguing spatial and temporal patterns in vegetation characteristics and productivity across Kolkata and its surrounding region (Fig 3). Lower NDVI values are observed in highly urbanized and wetland areas, while regions with vegetation cover exhibit higher NDVI values (Fig. 3a-c). Over time, an increase in NDVI concentration is noted in the northeastern and northwestern parts, where agricultural fields and settlements dominate. Conversely, a decreasing trend in NDVI is observed in the eastern part, indicative of rapid urbanization. Similar to NDVI, EVI shows spatial and temporal changes reflecting variations in vegetation greenness. The trends observed in EVI closely mirror those seen in NDVI, with increasing values in vegetated areas and decreasing values in urbanized regions (Fig. 3d-f). GPP values indicate the generation and concentration of carbon during photosynthesis by plants. Higher GPP values are concentrated in the northeastern, southeastern, and western parts, while lower values are found in the northwestern and central to eastern parts (Fig. 3g-i). A decreasing trend in GPP is observed across the study area from 2003 to 2016, possibly influenced by various factors including land use changes and climate variability. SIF serves as a functional proxy of terrestrial GPP. Higher SIF values are observed in the north and lower values in the southern, southeastern, and southwestern corners. Dynamic spatiotemporal changes in SIF are noted, with sharp increases in the north, northeast, northwest, and western parts from 2003 to 2010, followed by a negative change in SIF in all areas from 2010 to 2016 (Fig. 3j-l). These observations underscore the complex interplay between land use dynamics, climate variability, and vegetation productivity in the study area. The findings provide valuable insights for ecosystem management, urban planning, and climate change adaptation strategies tailored to the specific characteristics of Kolkata and its surrounding region.
5.2. Interannual variability
The interannual variability of the VI associated with various meteorological parameters, namely precipitation, LST, SM content (0-10 and 10-40 cm), and ET, was investigated for the period 2003-2016 (Fig. 4). The maximum and minimum values are 0.69 and 0.36 for VI, 20.76 and 0.00046 mm for precipitation, 36.64 and 24.92 ºC for LST, 40.23 and 16.88 for SM, and 0.000057 and 0.000011 for ET, respectively. Both precipitation and VI show a good periodic variation throughout the study period. An increasing trend has been observed with the help of linear regression for VI, ET, LST with a slope of 0.002, 0.00000004 and 0.0007, respectively. A decreasing trend has been observed for precipitation and SM with a slope of 0.001 and 0.009 respectively.
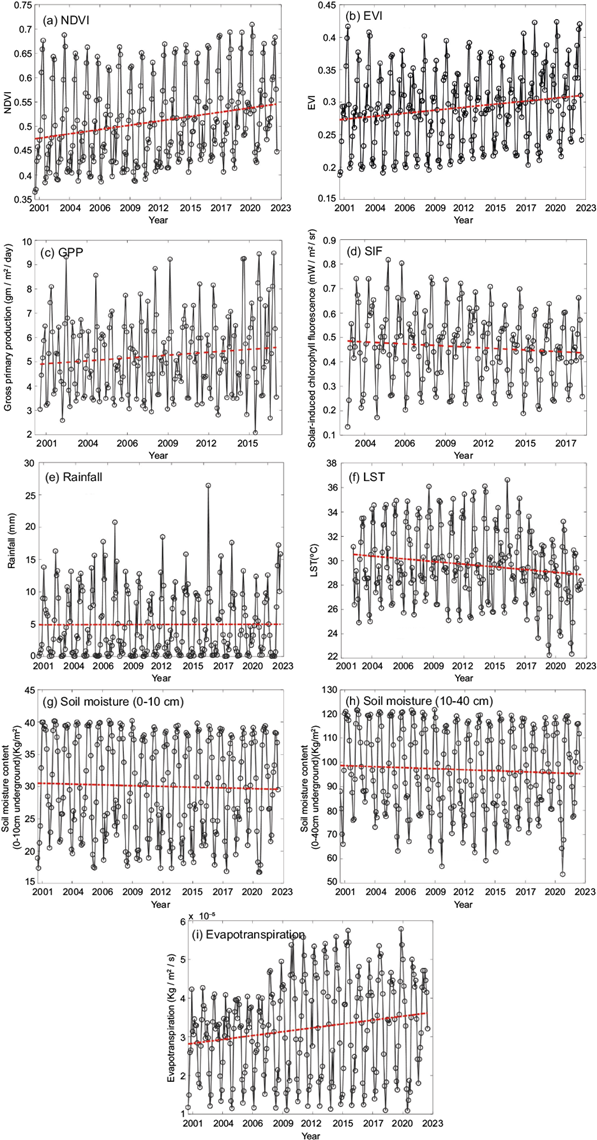
Fig. 4 Yearly variations of (a) NDVI, (b) EVI, (c) GPP, (d) SIF, (e) rainfall (mm), (f) LST (ºC), (g) SM (0-10 cm), (h) SM (10-40 cm), (i) ET (kg m-2 s-1). (NDVI: Normalized Difference Vegetation Index; EVI: Enhanced Vegetation Index; GPP: gross primary productivity; SIF: sun-induced chlorophyll fluorescence; LST: land surface temperature; SM: soil moisture; ET: evapotranspiration). (Continue)
5.3. Monthly variation
The monthly variability of the above parameters is discussed in this section. The monthly average has been calculated for the period 2003-2016 for all parameters and is shown in Fig. 5. It is observed that the average precipitation shows maximum and minimum values in July (36 mm) and December (0.5 mm), respectively. The average values of the maximum and minimum NDVI are observed in September (0.64) and January (0.4), respectively. NDVI values increase from June and decrease after October (end of the extended monsoon). June to September is considered the grassland growing season and agricultural activities over this location. The maximum and minimum EVI average values were observed in September (0.38) and January (0.21), respectively. The maximum and minimum SM’s average values were observed in August (39.12) and February (20.61), respectively. The average value of the maximum and minimum EVI was evident in July (4.45E-05) and January (1.32739E-05). The average values of the maximum and minimum LST were observed in April (34.21 ºC) and January (25.82 ºC), respectively. Both NDVI and precipitation show a good periodic variation. In the winter season, both NDVI and precipitation show minimum values. It can be observed that NDVI is related to water availability, as higher NDVI is found during months with higher precipitation. It has also been observed that there is a time lag between high values of precipitation and VI. The time lag between NDVI and other meteorological parameters is discussed in the following section.
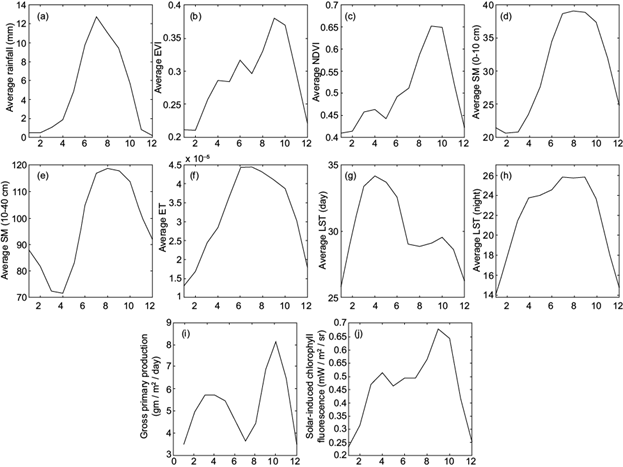
Fig. 5 Monthly variations of average (a) rainfall, (b) EVI, (c) NDVI, (d) SM (0-10 cm), (e) SM (10-40 cm), (f) ET, (g) LST (day), (h) LST (night), (i) GPP, (j) SIF. (EVI: Enhanced Vegetation Index; NDVI: Normalized Difference Vegetation Index; SM: soil moisture; ET: evapotranspiration; LST: land surface temperature; GPP: gross primary productivity; SIF: sun-induced chlorophyll fluorescence.)
5.4. Time average spatial correlation analysis
Spatial analysis consists of locational analysis and the neighboring relationship of phenomena to be studied, whereas time series analysis reflects how observation data changes over a period of time. In this article, spatial time series correlation analysis was carried out to understand the potential interacting pairs of time series across two sequential spatial time series datasets, where a strongly correlated pair of time series indicates that changes of one variable lead to changes in another variable over time. In the present study, spatiotemporal correlation analysis of LST, rainfall, SM, and ET with NDVI and EVI was conducted over the Kolkata conurbation and its surrounding region for 2003-2016. Land use characteristics and their changes have played a dominant role in determining the nature of land cover in this region, whose northern and northwestern parts are dominated by highly urbanized land use characteristics, whereas the eastern part has an abundance of agricultural land use and wetlands and also a few pockets of urban land use. A dense forest is located in the southeastern part of this area. The spatiotemporal correlation of LST, rainfall, SM, and ET with NDVI is shown in Figure 6a-d. A high to very high positive correlation has been observed near the Kolkata conurbation, which indicates that positive changes of LST lead to changes in NDVI over 2003-2016 (Fig. 6a). In the northeastern and southeastern parts of the study area, a negative correlation was found over this period. This relationship is controlled by the land use and land cover characteristics of the region, which, along with climate and soil, predominately determine the nature of vegetation. Here, the positive correlation exists along the conservation or urban agglomeration of Kolkata and its surrounding areas. These characteristics were observed throughout the mentioned period (2003-2016). In the eastern, northeastern, and southeastern parts of the study area, a negative correlation exists between LST and NDVI, where land use characteristics are dominated by agriculture and scattered human settlements.
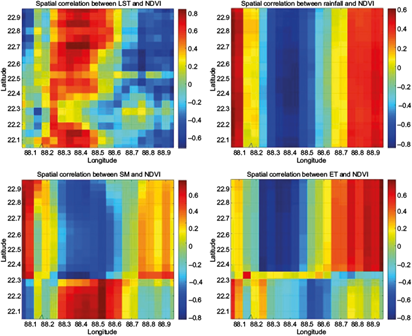
Fig. 6 Time average spatial correlation of NDVI with LST, rainfall, SM, and ET for the period 2003-2016. (NDVI: Normalized Difference Vegetation Index; LST: land surface temperature; SM: soil moisture; ET: evapotranspiration.)
In general, rainfall and NDVI are positively correlated, but the nature of this relation varies, especially due to its land use characteristics and other climatic and physiographic vegetation processes from 2003 to 2016. The positive correlation between rainfall and NDVI exists along the study area’s northeastern, eastern, and southeastern parts; also in the westernmost part of the study area where agricultural land use with high-fertility soil is common. But in the urban agglomeration and its surrounding areas, there is a negative correlation due to the existence of urban land use. Overland water flow is a common phenomenon, and less vegetation concentration has been observed.
The time average spatial correlation of SM and NDVI (shown in Fig. 7 for different parameters) varies spatially. In the study area’s eastern, northeastern, southern, and southwestern parts, SM and the nature of NDVI are positively correlated. The existence of agricultural land with fertile alluvial soil and surface and subsurface water is responsible for such relations. A negative correlation exists between SM and NDVI from 2003 to 2016 in the Kolkata urban agglomeration and its surroundings, where land use is characterized by an overland flow of surface water and lack of tree cover. A negative correlation between SM and NDVI was observed in the southeastern part of the study area, mainly determined by the existence of a mangrove forest and high-salinity soil (Saha et al., 2019).
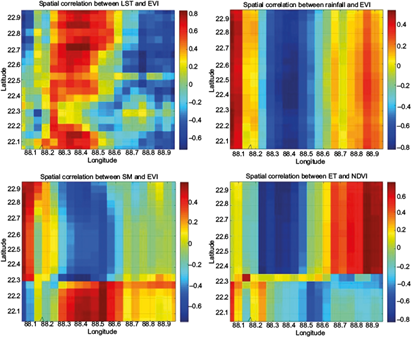
Fig. 7 Time average spatial correlation of EVI with LST, rainfall, SM, and ET for the period 2003-2016. (EVI: Enhanced Vegetation Index; LST: land surface temperature; SM: soil moisture; ET: evapotranspiration.)
Cihlar et al. (1991) found a high correlation between NDVI and ET in the growing period. In the study area, a high positive correlation between ET and NDVI was observed in the eastern and northeastern parts, where agricultural practice is performed throughout the year due to the availability of fertile alluvium soil, SM, and irrigation facilities. However, in the urban agglomeration, a negative correlation was observed due to the urban land use and lack of vegetation availability. A negative correlation was also observed in the southern part of the study area. A low-degree positive correlation was found in the southeastern and western parts of the study area due to the existence of a vegetation surface. A similar kind of spatial correlation exists between EVI, rainfall, SM, and ET; as a result, it is controlled by land use characteristics and associated pedological and climatic elements. Both positive and negative spatiotemporal correlations have been observed between the meteorological parameters and vegetation index, which are mostly controlled by this location’s land use and land cover characteristics.
5.5. Lag period correlation analysis
The lag period correlation analysis between vegetation indices (NDVI, EVI) and meteorological parameters sheds light on the temporal dynamics and interactions between vegetation and environmental factors. In the literature, it has been indicated that the vegetation can respond with a lag in time to meteorological parameters (Sharma et al., 2021; Zhe and Zhang, 2021). The correlation values between NDVI and LST, SM, and precipitation are -0.45, 0.43, and 0.34, respectively, over Gautam Budha Nagar, India (Sharma et. al., 2022). The best correlation coefficient (0.66) between NDVI and precipitation has been observed with a one-month lag over South Tibet (Zhe and Zhang, 2021). Due to this fact, the time-lag effects have been investigated in the present study using the correlation analysis between NDVI and other meteorological parameters (0, 1, 2, and 3 months). The maximum correlation with rainfall (0.72), SM (0.83), ET (0.61), and LST (0.83) was observed with a two-month, one-month, two-month, and one-month lag, respectively, for NDVI for the total study period. Regarding EVI, the same time lag was observed with the meteorological parameters but with a reduced correlation coefficient value. It may be because EVI mainly represents high biomass regions. The correlation coefficients of EVI with rainfall, SM, ET, and LST are 0.52 (two-months lag), 0.68 (one-month lag), 0.49 (two-months lag), and -0.72 (one-month lag), respectively. The variation of meteorological parameters with NDVI and EVI for the best correlation time month is shown in Figures 8 and 9, respectively. The variation of meteorological parameters with GPP and SIF for the best correlation time month is shown in Figures 10 and 11, respectively. The variation of meteorological parameters with GPP and SIF for the best correlation time month is shown in Figures 10 and 11, respectively. A significant positive correlation was observed between NDVI and precipitation for a two-month lag period. Vegetation primarily depends on the natural water supply, which in turn depends on precipitation. Vegetation shows a slow rate of response to rainfall. The NDVI-precipitation correlation further relies on other factors, such as land cover, temperature, SM, and others (Xiong et al., 2003; Wang et al., 2013; Huang et al., 2017). The sensitivity of vegetation is also dependent on SM and ET. SM plays a crucial role in controlling the life span of plants, which affects the evaporation rate and ET of leaves (Xiong et al., 2003; Huang et al., 2017). A positive correlation has been observed between NDVI and ET, as NDVI is directly proportional to vaporized water entering the atmosphere. A negative correlation has been observed between NDVI and LST over this region, which can be triggered by the topography of a particular region (Peng et al., 2020). LST in the urban location has an inverse relation with vegetation due to the effect of land surface materials (Yue et al., 2007). The correlation analysis of VI with different meteorological parameters for different time lag periods is shown in Table II.
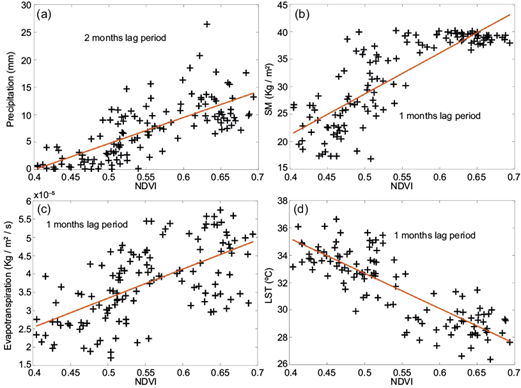
Fig. 8 Best correlation for different lag months of NDVI with (a) precipitation, (b) SM, (c) ET, and (d) LST. (NDVI: Normalized Difference Vegetation Index; SM: soil moisture; ET: evapotranspiration; LST: land surface temperature.)
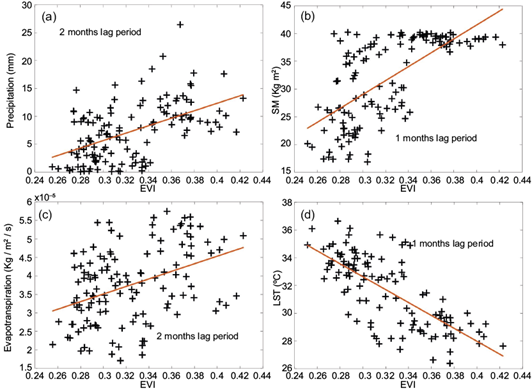
Fig. 9 Best correlation for different lag months of EVI with (a) precipitation, (b) SM, (c) ET, and (d) LST. (EVI: Enhanced Vegetation Index; SM: soil moisture; ET: evapotranspiration; LST: land surface temperature.)
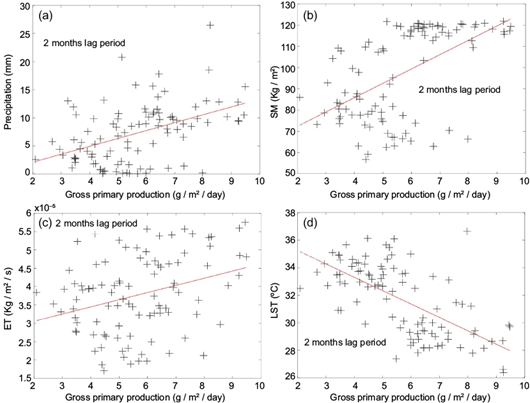
Fig. 10 Best correlation for different lag months of GPP with (a) precipitation, (b) SM, (c) ET, and (d) LST. (GPP: gross primary productivity; SM: soil moisture; ET: evapotranspiration; LST: land surface temperature.)
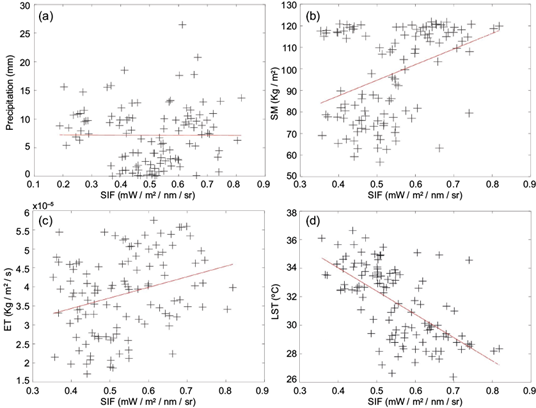
Fig 11 Best correlation for different lag months of SIF with (a) precipitation, (b) SM, (c) ET, and (d) LST. (SIF: sun-induced chlorophyll fluorescence; SM: soil moisture; ET: evapotranspiration; LST: land surface temperature.
Table II Correlation analysis of VI with different meteorological parameters for different time lag periods.
| Elements | 0 month (March-September) | 1 month (April-October) | 2 months (May-November) |
| NDVI | |||
| Rainfall | 0.45 | 0.62 | 0.72 |
| Soil moisture (0-10 cm) | 0.70 | 0.83 | 0.77 |
| Soil moisture (10-40 cm) | 0.72 | 0.85 | 0.76 |
| Evapotranspiration | 0.42 | 0.54 | 0.61 |
| Land surface temperature | -0.78 | -0.83 | -0.64 |
| EVI | |||
| Rainfall | 0.38 | 0.40 | 0.52 |
| Soil moisture (0-10 cm) | 0.67 | 0.68 | 0.52 |
| Soil moisture (10-40 cm) | 0.44 | 0.46 | 0.26 |
| Evapotranspiration | 0.40 | 0.43 | 0.49 |
| Land surface temperature | -0.60 | -0.72 | -0.47 |
| GPP | |||
| Rainfall | 0.19 | 0.21 | 0.46 |
| Soil moisture (0-10 cm) | 0.12 | 0.19 | 0.51 |
| Soil moisture (10-40 cm) | 0.12 | 0.21 | 0.55 |
| Evapotranspiration | -0.09 | 0.03 | 0.32 |
| Land surface temperature | 0.09 | -0.32 | -0.64 |
| SIF | |||
| Rainfall | 0.22 | 0.41 | 0.43 |
| Soil moisture (0-10 cm) | 0.46 | 0.59 | 0.4 |
| Soil moisture (10-40 cm) | 0.47 | 0.62 | 0.38 |
| Evapotranspiration | 0.15 | 0.25 | 0.29 |
| Land surface temperature | -0.49 | -0.63 | -0.33 |
6. Conclusion
This study investigates the long-term characteristics of VIs over Kolkata and its surroundings from 2003 to 2016, using satellite-based observations. NDVI, EVI, GPP, and SIF are analyzed, along with their relation to meteorological parameters such as precipitation, SM, ET, and LST. The following are our main observations:
Interannual variability is observed for VI and meteorological parameters, with the highest and lowest VI values occurring in September and January, respectively. There is a notable increasing trend in VI, ET, and LST, while precipitation and SM show decreasing trends over the study period.
NDVI reflects water availability, showing higher values during months with more rainfall. There is a time lag between peak precipitation and maximum vegetation, typically observed in August-September, coinciding with the monsoon period.
Spatial variations in NDVI are linked to land use characteristics. Areas dominated by agriculture show increased NDVI, while regions undergoing urbanization exhibit decreasing trends. Land use, climate, and soil properties influence vegetation dynamics.
Time lag effects are explored through correlation analysis between NDVI and meteorological parameters, revealing significant correlations within one to two-month periods. NDVI shows positive correlations with precipitation, SM, and ET, while an inverse correlation is observed with LST, influenced by land surface materials and topography.
Overall, the study provides insights into the long-term spatiotemporal dynamics of VIs and their relationship with meteorological parameters in a tropical urban area, aiding in understanding ecosystem responses to environmental changes. Expanding the study beyond Kolkata to other metropolitan cities in India to observe vegetation cover dynamics in relation to meteorological parameters is a commendable initiative. By broadening the scope of the study, researchers can gain insights into the spatiotemporal characteristics of vegetation indices across different urban agglomerations in India and assess the influence of meteorological factors on vegetation health and dynamics. This extended research effort has the potential to contribute significantly to our understanding of urban vegetation dynamics and their relationship with meteorological parameters on a broader scale. By comparing vegetation responses across multiple metropolitan areas, researchers can identify common patterns, drivers, and trends, facilitating the development of a comprehensive model describing how vegetation changes with meteorological effects over the long term in Indian urban contexts. Such a model could have practical implications for urban planning, environmental management, and climate resilience strategies in Indian metropolitan cities. By integrating satellite observations, meteorological data, and vegetation indices, policymakers and urban planners can make informed decisions to promote sustainable urban development, enhance green infrastructure, and mitigate the impacts of climate change on urban ecosystems and human well-being. Overall, the planned extension of the study to other metropolitan cities in India holds great promise for advancing our knowledge of urban vegetation dynamics and informing evidence-based policies and practices for sustainable urban development.


 nueva página del texto (beta)


