1. Introduction
Megacities are regions with a population exceeding 10 million inhabitants (Muramatsu et al., 2021). According to the United Nations (UN, 2019), in 2018, about 6.9% of the world’s population lived in megacities, and it is estimated that by 2030 this number will reach 8.8%. In South America, Brazil has two megacities: São Paulo, with an estimated population of 21.65 million inhabitants in 2018, and Rio de Janeiro, with 13.29 million inhabitants (UN, 2019; UN-HABITAT, 2022). The increase in the population living in these areas directly impacts air quality, which is also influenced by factors such as topography, meteorology, patterns associated with urban mobility, and emissions of different fuel types, among others (Baklanov et al., 2016; Molina, 2021; UN, 2022).
The megacity of Rio de Janeiro corresponds to the Metropolitan Area of Rio de Janeiro (MARJ), which comprises 21 municipalities, has the second largest vehicle fleet in the country with 3.1 million vehicles (Santos and Azevedo, 2021), and a high concentration of industries. It is estimated that vehicular sources are responsible for 77% of the total emissions of atmospheric pollutants in the region and industrial sources for 23% (INEA, 2020). In addition to the variability and exposure to emission sources, other factors, such as the complex topography of the region and the presence of large bodies of water, such as Baía de Guanabara, can also significantly impact pollutant concentration values and reduce the scale of representativeness of air quality monitoring sites (Santos et al., 2016; da Silveira and Carvalho, 2021).
Air quality monitoring in the MARJ started in the late 1960s (Cavalcanti, 2003); however, even with the network’s expansion from the 1990s onwards, the number of air quality monitoring sites is still insufficient when analyzing the territorial extension of the area. Nowadays, the Air Quality Monitoring Network of the Instituto Estadual do Ambiente (State Environment Institute, INEA) has 150 air quality and weather stations spread across the state of Rio de Janeiro (INEA, 2020).
Among air pollutants, high concentrations of particulate matter with a diameter of less than 10 μm (PM10), and ozone (O3) are frequently recorded in the MARJ (Santos et al., 2016; Dantas et al., 2020; Gómez-Peláez et al., 2020; Mendes et al., 2020; Moura et al., 2020; da Silveira and Carvalho, 2021). For the MARJ, several studies have shown that (a) in conditions of intense winds and high precipitation, pollutants such as PM10 and O3 registered lower concentrations (Trindade et al., 1980; Carvalho et al., 2012; Santos et al., 2016; Beringui et al., 2023); (b) high temperatures and low values of relative humidity, absence of precipitation (and, consequently, clear skies), and light winds were associated with high O3 concentrations (Carvalho et al., 2012; Geraldino et al., 2017; Silveira and Carvalho, 2021; Beringui et al., 2023); and, (c) when extended to the west, the South Atlantic Subtropical Anticyclone (SASA; Reboita et al., 2019) contributes with atmospheric stability over the southeast region of Brazil, which is characterized by light winds, low cloudiness and, consequently, absence of precipitation. Under this scenario, there is an increase in the concentration of pollutants throughout the southeast region, as identified by da Silva Júnior and Andrade (2013), Carvalho et al. (2015), Santos et al. (2016), and da Silveira and Carvalho (2021).
Atmospheric stability is related to the Planetary Boundary Layer (PBL) features. It refers to the tendency of the air to resist vertical movements and it is a highly relevant factor to air quality since it directly influences the concentration of pollutants in the atmosphere. In stable atmospheric conditions, convection and turbulence are inhibited, leading to high concentrations of pollutants such as PM10 and O3 precursors in the lower troposphere; in contrast, unstable conditions, with intense buoyancy, convection, and air turbulence, favor the dispersion of pollutants in the atmosphere (Zhang et al., 2012; Crawford et al., 2016; Wang et al., 2016; Bodor et al., 2022).
It is important to emphasize that the association of atmospheric conditions and air pollution can be studied through numerical models. Li et al. (2019) showed the influence of stable conditions on the increase of surface pollutant concentrations in northeast China through a tracer simulation with the Weather Research and Forecasting (WRF) model with chemistry (WRF-Chem). A study in megacities in China also revealed that the induced thermodynamic perturbations and turbulent mixings associated with urbanization processes favor the growth of PBL and the dispersion of pollutants; however, these processes also increase air pollutants emissions, generally increasing aerosol concentrations (Miao et al., 2019).
The impact of the PBL structure on episodes with high concentrations of pollutants in the MARJ has been little explored in the literature. From the observational point of view, this is mainly due to the scarcity of upper air data in the region, where measurements are only carried out at Tom Jobim International Airport through radiosondes twice daily, at 00:00 and 12:00 UTC. Hence, numerical weather forecast models can complement the information obtained from local observations to identify patterns associated with high pollutant concentrations and improve air quality forecasts, even allowing the analysis of the PBL structure in regions without records. In this context, the main objectives of this study are to evaluate (1) the PBL conditions simulated by the WRF model and (b) its relation to the air quality registered during days with high concentrations of O3 and PM10 in the MARJ.
2. Materials and methods
2.1. Study area and data
PM10 and O3 concentrations data from eight sites located in Rio de Janeiro municipality were analyzed: (1) Copacabana, (2) São Cristóvão, (3) Centro, (4) Tijuca, (5) Irajá, (6) Bangu, (7) Campo Grande, and (8) Pedra de Guaratiba, as shown in Figure 1. The 10-minute concentration averages of PM10 and O3 from 2012 to 2015 were used to select air quality episodes with high concentration values (section 2.2). Air temperature, relative humidity, wind direction, and wind speed obtained at these sites at the station level were also used. All data was made available by the Rio de Janeiro City Administration at http://www.data.rio/.
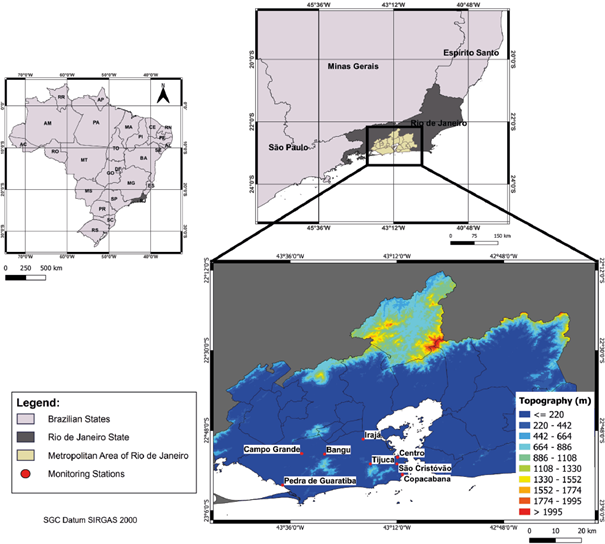
Fig. 1 Location of the Metropolitan Area of Rio de Janeiro (MARJ), Brazil, the spatial distribution of the air quality monitoring sites, and topography (m).
Precipitation data obtained from eight pluviometric stations located in the same neighborhoods as the air quality monitoring sites were obtained through the Rio de Janeiro City Alert System (alertario.rio.rj.gov.br). Cloud cover data from the METAR from Tom Jobim International Airport, available on the Air Force Command Meteorology Network website (REDEMET; www.redemet.aer.mil.br), and soundings data, available from the University of Wyoming website (weather.uwyo.edu/upperair/sounding.html) of the same airport were also considered. Synoptic charts provided by the Center for Weather Forecast and Climatic Studies of the National Institute for Space Research (CPTEC/INPE; http://tempo.cptec.inpe.br/) were also used to analyze large-scale meteorological conditions. Images from the GOES satellite were also used to assist in the cloud cover analysis.
2.2 Cases selection
To select the cases of study, the 8-h moving averages of O3 concentrations and daily averages of PM10 were calculated. Then, the highest moving 8-h averages of O3 concentrations per day and PM10 daily average concentrations were compared to the values established for the final phase of the National Air Quality Standard (PF) (100 μg m-3 for O3 and 50 μg m-3 for PM10) from Resolution 491 of the Conselho Nacional do Meio Ambiente (National Council for the Environment, CONAMA) (CONAMA, 2018). Notably, the first phase of the PFs (PI-1) is still in effect throughout most of the Brazilian states, with values of 140 μg m-3 for O3 and 120 μg m-3 for PM10, and another two phases are intended before the implementation of the PF. We should highlight that CONAMA Resolution 491 considered, as a reference, the values proposed by the World Health Organization (WHO, 2005). However, in 2021, the WHO released a new update on these values (WHO, 2021), indicating even more restrictive concentrations as a reference for the protection of human well-being and health. Adopting more restrictive values is expected to reduce the number of deaths related to air pollution, which accounts for about seven million people annually (Carvalho, 2021).
The criteria to define two cases of study, one for each pollutant, were that at least three of eight air quality monitoring sites had maximum averages higher than the reference values. A seven-day period when PM10 daily average concentrations were higher than 50 µg m-3 was selected during winter and a six-day period during the summer was selected when the maximum daily 8-h O3 concentrations were higher than 100 µg m-3. Winter and summer are when higher concentration levels of PM10 and O3 are recorded in the MARJ, respectively (Carvalho, 2010; Santos et al., 2016; Tsuruta et al., 2018). The first period selected (P1), from August 1 to 7, 2013, during winter, showed daily mean concentrations of PM10 above 50 µg m-3 (Table I) in at least three sites under analysis during the study days. All sites recorded concentrations above the PF in four of the seven days. This shows how compromised the region is when it comes to PM10 concentrations. In four of the eight sites, concentration values were twice or even three times higher than 50 µg m-3 on specific days. For instance, the Irajá site, located in a residential neighborhood with more than 95 000 inhabitants and close to high vehicular traffic areas (Mello, 2017), registered a maximum concentration value of 169.26 µg m-3 on August 2.
Table I Daily average concentrations of PM10 (μg m-3) recorded in the Metropolitan Area of Rio de Janeiro (MARJ) from August 1 to 7, 2013 (P1).
| Monitoring stations | August | ||||||
| 1 | 2 | 3 | 4 | 5 | 6 | 7 | |
| Bangu | 64.13 | 56.78 | 80.07 | 60.35 | 35.79 | 38.74 | 60.88 |
| Centro | 75.96 | 100.79 | 96.33 | 65.58 | 40.35 | 50.83 | 71.13 |
| Campo Grande | 88.21 | 93.29 | 90.21 | 79.74 | 47.04 | 58.71 | 79.75 |
| Copacabana | 74.97 | 101.83 | 97.62 | 95.02 | 64.33 | 67.49 | 69.57 |
| Irajá | 108.00 | 169.26 | 131.96 | 89.13 | 50.57 | 70.25 | 75.91 |
| Pedra Guaratiba | 75.96 | 100.79 | 96.33 | 65.58 | 40.35 | 50.83 | 71.13 |
| São Cristóvão | 76.33 | 107.08 | 107.79 | 80.08 | 50.92 | 61.92 | 61.54 |
| Tijuca | 67.26 | 84.42 | 82.99 | 47.22 | 42.00 | 56.46 | 57.16 |
Records above the reference values are highlighted in bold.
Between January 21 and 26, 2014 (P2), during the austral summer, the 8-h maximum O3 concentrations were above 100 μg m-3 in at least four stations under analysis during the study days (Table II). As identified for P1, at some point all stations considered presented values higher than those recommended for the final phase of CONAMA’s Resolution 491 (CONAMA, 2018).
Table II 8-h maximum O3 concentrations, in μgm-3, recorded at the MARJ from January 21 to 26, 2014 (P2).
| Monitoring stations | January | |||||
| 21 | 22 | 23 | 24 | 25 | 26 | |
| Bangu | 147.85 | 121.49 | 168.83 | 155.14 | 154.29 | 118.94 |
| Centro | 123.58 | 124.80 | 152.75 | 132.80 | 144.69 | 115.78 |
| Campo Grande | 84.82 | 77.21 | 70.40 | 87.98 | 100.99 | 89.76 |
| Copacabana | 38.44 | 43.58 | 50.02 | 38.32 | 56.99 | 38.94 |
| Irajá | 105.10 | 105.82 | 142.24 | 112.57 | 165.91 | 144.14 |
| Pedra Guaratiba | 123.58 | 124.80 | 152.75 | 132.80 | 144.69 | 115.78 |
| São Cristóvão | 62.74 | 65.79 | 73.60 | 57.07 | 82.07 | 69.81 |
| Tijuca | - | - | 129.86 | 83.96 | 136.97 | 128.55 |
Records above the reference values are highlighted in bold.
2.3. Model configurations
Simulations were performed with the WRF model for the two selected periods, with the following objectives: (a) to verify the performance of the model in simulating the conditions of atmospheric stability (since there is a high concentration of pollutants, the hypothesis is that there are stable atmospheric conditions) and the meteorological variables and (b) to analyze their relation mainly in what refers to the influence of atmospheric stability in the concentrations of pollutants recorded in the region. It is worth noting that the WRF is an atmospheric modeling system that includes physical, dynamic, and computational equations and can be applied to weather forecasting, data assimilation studies, and coupled geophysical models (Skamarock et al., 2008).
The data for initialization and generation of initial and boundary conditions were obtained from the Global Forecast System (GFS) with 0.5º spatial horizontal resolution every 6 h through the National Climatic Data Center of the National Oceanic and Atmospheric Administration website (NCDC/NOAA [nomads.ncdc.noaa.gov]). Three nested grids with a resolution of 27, 9, and 3 km (Fig. 2) and 33 vertical levels were considered. The grids were centered at 22.8º S and 43.25º W. All simulations were triggered 24 h before the period of interest to eliminate the spin-up effect of the model. A summary of the model settings can be seen in Table III. Results obtained from da Silveira and Carvalho (2021) were used to define the model settings in this study.
Table III Model configuration and physical parameters.
| Parameterization | Grid 1 | Grid 2 | Grid 3 |
| Points in the x direction | 95 | 97 | 94 |
| Points in the y direction | 95 | 97 | 94 |
| Vertical levels | 33 | 33 | 33 |
| Horizontal resolution | 27 km | 9 km | 3 km |
| Central latitude | 22.80º S | ||
| Central longitude | 43.25º W | ||
| Microphysics | Purdue-Lin (Chen and Sun, 2002) | ||
| Cumulus | Kain-Fritsch (Kain, 2004) * | ||
| Planetary boundary layer | YSU (Hong et al., 2006) | ||
| Surface layer | Eta similarity (Janjić, 2001) | ||
| Short wave radiation | Dudhia shortwave (Dudhia, 1989) | ||
| Long wave radiation | RRTM (Mlawer et al., 1997) | ||
YSU: Yonsei University; RRTM: rapid radiative transfer model.
*Only enabled for grid 1.
2.4. Analyses
The synoptic charts and the WRF results for the 27 km grid and the 3 km grid were used to evaluate the atmospheric patterns on a synoptic scale. The results obtained with the WRF model for the 3-km grid and the meteorological data observed in the region were used to analyze the prevailing meteorological conditions on a local scale.
Initially, we compared the large-scale pattern of the mean sea level pressure between synoptic charts and experiments. A comparison of the cloud coverage followed this analysis. The percentage of the sky covered by clouds was obtained from METAR data where CAVOK means Ceiling and visibility okay, SKC signifies Sky clear (clear below 12 000 for ASOS/AWOS), NSC denotes No significant clouds, FEW represents 1/8 to 2/8 of sky cover, SCT means Scattered with 3/8 to 4/8 of sky cover, BKN is Broken when the sky cover is from 5/8 to 7/8, and OVC indicates Overcast with 8/8 of sky cover (DECEA, 2023).
The conditions of atmospheric stability, PBL height, and vertical profile of the atmosphere were determined. Wind roses were generated from the wind data recorded at the stations to verify the diurnal evolution of the sea breeze using the WRPLOT View software.
The atmospheric stability classification was carried out by calculating the Richardson number (Eq. [1]) as proposed by Stull (1991) due to the Ri number presenting a good performance when compared to the other classification methods and data availability (Mohan and Siddiqui, 1998).
where g is the acceleration of gravity (9.8 m s-2), Δz (m) is the variation in height, Δu (m s-1) is the variation in wind speed, θv (K) is the average temperature virtual potential between the two levels and the term Δθv Δz -1 is the difference in the virtual potential temperature along the vertical.
Calculations of the parameters required for determining the atmospheric stability were performed for the PBL using the data obtained from the upper air soundings. The classification proposed by Clifton et al. (2013) was used: (a) unstable when Ri < -0.01; (b) neutral when -0.01 < Ri < 0.01, and (c) stable when Ri > 0.01.
The PBL height was determined through the visual method using the vertical profile of the potential temperature for the 12:00 UTC upper air soundings. For 00:00 UTC upper air soundings, specific humidity data were also used to determine the extent of the PBL, as proposed by Sánchez (2017), since the vertical profile of potential temperature was almost constant throughout the troposphere. The atmospheric stability simulated was classified through the methodology proposed by Clifton et al. (2013), analogous to the classification made from the observations. The vertical extent of the PBL can be characterized by a layer where the potential temperature and specific humidity are constant. In these cases, the PBL height can be identified as the height where the potential temperature and specific humidity present an abrupt increase and decrease, respectively (Sánchez, 2017).
3. Results and discussions
3.1. Atmospheric conditions of the selected case studies
3.1.1 Mean sea level pressure
Considering the two study cases (from August 1 to 7, 2013 [P1] and from January 21 to 26, 2014 [P2]), the visual comparison between the sea level pressure simulated by the WRF model through the course domain (27 km) and the synoptic chart shows an agreement in simulating the configuration of the high-pressure system in both periods (as an example, see Fig. 3). The climatological configuration of the SASA during the winter is its expansion over southeastern Brazil, and during summer its retraction eastward, leaving the Brazilian area. But, in anomalous situations, the SASA can also expand westward during summer, influencing southeastern Brazil (Reboita et al., 2010; Ferreira and Reboita, 2022). Figure 3 shows that the SASA configuration is more pronounced during winter, a fact verified by the synoptic charts and the model results. In the case study of summer, SASA is showing an anomalous configuration, which should contribute to the pollutant concentration as in Carvalho et al. (2012), da Silva Junior and Andrade (2013), Santos et al. (2016), and da Silveira and Carvalho (2021).
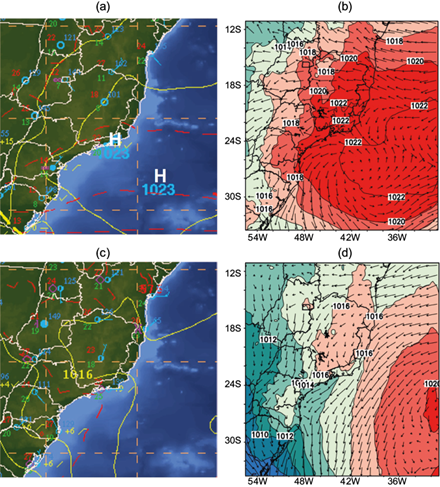
Fig. 3 Synoptic charts of (a) 06/08/2013 at 00:00 UTC and (c) 21/01/2014 at 12:00 UTC, where the yellow lines are the isobars and the blue symbols present the surface synoptic observations (SYNOP). Mean sea level pressure (hPa) and wind (m s-1) simulated by the WRF (27-km grid) of (b) 06/08/2013 at 00:00 UTC and (d) 01/21/2014 at 12:00 UTC, where the arrows indicate wind direction and speed.
3.1.2 Cloud cover
METAR data shows that the percentage of hours with cloud coverage ≤ 2/8 was greater than 69% for P1 and 95% for P2 (Fig. 4). No precipitation was recorded at the eight sites during P1. During P2, there were records of light precipitation in the following stations: Irajá: 2.4 mm on January 22 at 16:00 LT; Bangu: 3.2 mm on January 24 at 21:00 LT; and Campo Grande: 0.4 mm on January 24 at 20:00 LT. Despite the Irajá station recording precipitation values during the afternoon, a favorable time for the formation of O3, no significant drop in concentrations was verified; on the contrary, values above the threshold established for comparison were registered. This is probably due to the low precipitation (insufficient to remove precursors) and the low cloud cover during most of the day.

Fig. 4 Frequency of occurrence of cloud cover classes used daily in METAR messages. (a) In the period from 08/01/2013 to 08/07/2013 and (b) from 01/21/2014 to 01/26/2014 at the Galeão Airport (SBGL).
When compared to METAR data, WRF results for the 3-km grid revealed that the model can satisfactorily represent the cloud cover in the study area, indicating a predominance of clear skies in both periods. As an example, Figure 5a shows, through the 15Z satellite image of August 3, 2013, the predominance of clear skies under RMRJ; the same is verified in Figure 5c through the cloud cover simulated by the model during the first period. Similarly, the 12Z satellite image of January 26, 2014 (Fig. 5b) during the second period, exemplifies the low cloud cover condition over the area and its respective representation through the WRF (Fig. 5d).
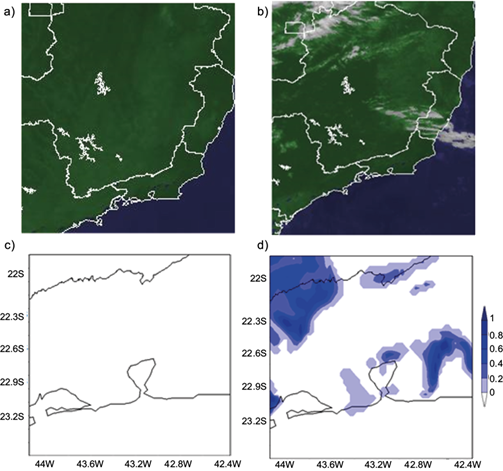
Fig. 5 GOES satellite images (in color) of (a) August 3, 2013 (15:00 UTC) and (b) February 10, 2014 (12:00 UTC). Cloud cover (%) through the 3-km grid (WRF) on (c) August 3, 2013 (15:00 UTC) and (d) January 26, 2014 (14:00 UTC).
It is important to highlight that the absence of precipitation during most days in P1 contributed to high concentrations of PM10 on successive days since it prevents the removal of the pollutant and favors its accumulation. In P2, the predominance of high visibility levels, which implies low or absent cloud cover, favors the formation of O3 since this process depends on the incidence of solar radiation; in contrast, the absence of precipitation hinders the removal of precursors in the atmosphere, favoring their accumulation. Since most of the precipitation recorded during P2 occurred during the night, mostly associated with cloud cover between 1/8 to 2/8 (probably due to the local convection process), it seems not to impact O3 formation in the area. These results agree with those obtained by Santos et al. (2016) for particulate matter and by Carvalho et al. (2015) and Schüch et al. (2019) for O3.
3.1.3 Winds at 10 m
The wind roses for the closest ocean station, Pedra de Guaratiba, exemplify the action of the sea breeze on the region’s coast during the afternoon, when it is more intense (Fig. 6). For both periods (P1 and P2), more intense winds were observed coming from the southwest, a direction typically associated with sea breezes in this area of the MARJ (Dereczynski et al., 2009; Pimentel et al., 2014), which favors the transport of pollutants to regions located northeast of the region (Carvalho, 2010). Due to its location, the meteorological station can be influenced by the sea breeze in both directions (SW and SE) since differences in the SASA position and sea surface temperature can also influence the final direction result. During P1 (Fig. 6a), higher wind speed values (above 3.6 m s-1) from the northeast were also identified, probably associated with the SASA position. For P2, when high concentrations of O3 were recorded, the average wind speed between midnight and noon was below 2.04 m s-1 in all sites. Carvalho (2010) and da Silveira and Carvalho (2021) also identified a similar pattern. The analysis of the direction and wind speed at 10 m with the mixing ratio simulated by the WRF model also showed the sea breeze through most of the period (Fig. 7). In both study periods, the simulations depicted a similar configuration of the sea breeze during the afternoon. In the MARJ, the sea breeze is fundamental in the pollutant dispersion process (Carvalho, 2010; Pimentel et al., 2014 da Silveira and Carvalho, 2021), mainly in periods when the synoptic flow is weak, especially during the afternoons when wind speed is higher.
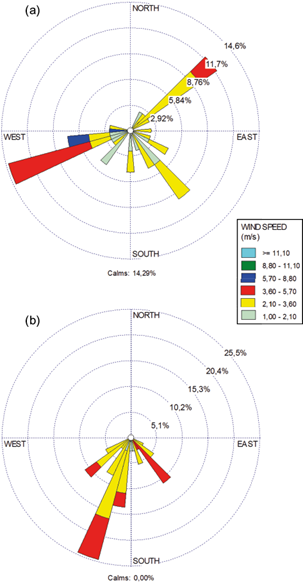
Fig. 6 Winds at 10 m registered between 13:00 and 18:00 LT at Pedra de Guaratiba station for the periods from (a) 08/01/2013 to 08/07/2013 and (b) 01/21/2014 to 01/26/2014.
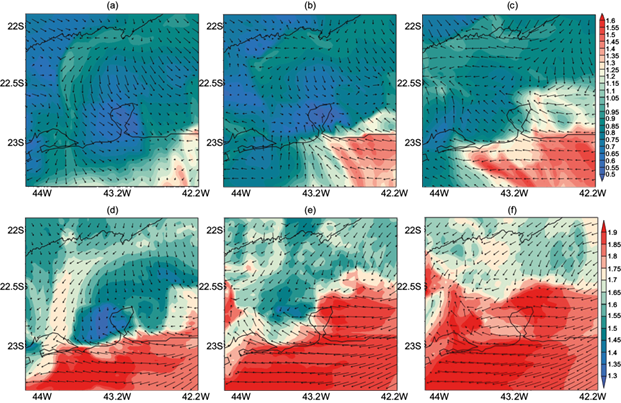
Fig. 7 WRF results for wind at 10 m (m s-1) and mixing ratio (g kg-1) on August 3, 2013 at (a) 15:00 UTC, (b) 18:00 UTC, (c) 21:00 UTC, and for January 23, 2014 at (d) 15:00 UTC, (e) 19:00 UTC, and (f) 21:00 through the 3-km grid (WRF).
Figure 8a illustrates the influence of the sea breeze on PM10 concentrations at the Tijuca and Irajá stations, located in the central and northwestern regions of the MARJ, respectively. As highlighted by Pimentel et al. (2014), the sea breeze over the central region is mainly from the southeast, which may influence the transport of pollutants to the region’s northwest (Carvalho, 2010; da Silveira and Carvalho, 2021). This can be verified on August 3, 2013, when (i) the highest concentrations of PM10 in Tijuca are recorded between 9:00 and 12:00 LT; (ii) the drop in concentrations at the station begins after 13:00 LT when it is possible to verify the breeze’s entrance over the MARJ; (iii) there is an increase in PM10 concentrations in Irajá at 16:00 LT, when the breeze reaches the region. Carvalho (2010) also reported a similar pattern through numerical simulations with an air quality model for the MARJ.

Fig. 8 Diurnal variations of concentrations of (a) PM10 on August 03, 2013 at Tijuca and Irajá stations and (b) O3 on January 22, 2014 at São Cristovão and Irajá stations.
Figure 8b also shows the influence of the sea breeze on O3 concentrations at the São Cristóvão and Irajá stations, located in the central and northwestern regions of the MARJ, respectively. The wind direction data at São Cristóvão changed from east-northeast (between 7:00 and 11:00 LT) to south-southeast (between 12:00 and 20:00 LT). In Irajá, the sea breeze varies from southwest-west-northwest (between 10:00 and 13.00 LT) to south-southeast (14:00-17:00 LT). On January 22, 2014, the highest O3 concentrations are recorded in São Cristovão between 10:00 and 15:00 LT, while the highest values in Irajá are recorded between 10:00 and 17:00 LT. These times are also identified as having the highest incidence of radiation, which demonstrates a typical behavior of O3 formation. However, the action of the breezes may indicate that pollutant transport to the northwest favors higher concentrations in Irajá (compared to São Cristovão). This can be supported by the analysis of the evolution of concentrations, which reveals that from 16:00 LT, the onset of a decrease in O3 concentrations in São Cristovão is associated with an increase in concentrations in Irajá. It is worth mentioning that the São Cristovão station is located in an area with a high vehicular flow, which makes it difficult to draw definitive conclusions regarding O3, since the increase in vehicular flow in the late afternoon can also affect the VOC/NOx ratios, in some cases favoring a decrease in O3 concentrations. Therefore, it is possible to conclude that the sea breeze acts in the transport of pollutants from one region to another within the MARJ, leading to a subsequent decrease in pollutant concentrations in coastal regions and an increase in more distant regions, mainly in those located to the northwest. Although not clear in this study, the recirculation of pollutants due to the sea breeze circulation cell might also be an important feature in the maintenance of high pollutant concentration levels during multiple days, as shown by Grossi et al. (2000), Flocas et al. (2009), and Li et al. (2020).
3.2. PBL height and stability conditions
For both periods, the model simulated PBL height values were satisfactorily represented compared to observations, as shown in Figure 9, which reveals a good ability to predict the variable. The time evolution of the PBL diurnal cycle is also well captured by the model. Since the upper air data is measured at 12:00 and 00:00 UTC (~09:00 and 21:00 LT), it usually does not represent the maximum PBL height, which is found mostly in the late afternoon (Reuter, 2002). It is worth noting that the greatest differences (albeit small) were identified when the PBL height was below 100 m. A small delay in the model results when compared with observations is also clear. Several studies also indicated, based on sensitivity tests with numerical models, that the use of “non-local” PBL parameterizations, such as the YSU parameterization, produces results that are more consistent with observations (Xie et al., 2012; Wang et al., 2014; Banks and Baldasano, 2016; Banks et al., 2016).
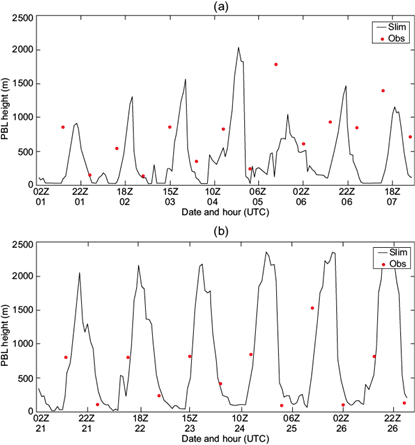
Fig. 9 Height (m) of simulated and observed PBL at Galeão Airport (SBGL) for the period between (a) August 1 and 7, 2013 and (b) January 21 and 26, 2014.
The Richardson number and the classification proposed by Clifton et al. (2013) were used to define the atmospheric stability from observations and modeled data in the study periods. The comparison considered the data simulated by the WRF model on the 3-km grid for the grid point closest to the Galeão International Airport and the data obtained from radiosondes. For P1 (Table IV) at 12:00 and 00:00 UTC, there is an agreement between the model and observations in 70% of the days. Despite representing the PBL height satisfactorily at most times, the model had difficulty simulating the conditions of a neutral atmosphere. As for P2 (Table V), the comparison between observed and simulated data showed agreement in atmospheric stability in 66% (33%) of the days at 12:00 (00:00) UTC (Table V).
Table IV Observed and simulated atmospheric stability conditions from 08/01/2013 to 08/07/2013 at the Galeão Airport (SBGL).
| Stability | ||||
| 09:00 LT (12:00 UTC) | 21:00 LT (00:00 UTC) | |||
| Date (September) | Observed | Simulated | Observed | Simulated |
| 1 | Stable | Stable | Stable | Stable |
| 2 | Unstable | Stable | Stable | Stable |
| 3 | Stable | Stable | Stable | Stable |
| 4 | Neutral | Unstable | Stable | Stable |
| 5 | Unstable | Unstable | Neutral | Unstable |
| 6 | Unstable | Unstable | Neutral | Stable |
| 7 | Unstable | Unstable | Stable | Stable |
Table V Observed and simulated atmospheric stability conditions from 01/21/2014 to 01/26/2014 at the Galeão Airport (SBGL).
| Stability | ||||
| 10:00 LT (12:00 UTC) | 22:00 LT (00:00 ) | |||
| Date (January) | Observed | Simulated | Observed | Simulated |
| 21 | Unstable | Unstable | Stable | Stable |
| 22 | Unstable | Unstable | Stable | Unstable |
| 23 | Unstable | Unstable | Stable | Neutral |
| 24 | Unstable | Neutral | Stable | Neutral |
| 25 | Unstable | Neutral | Stable | Stable |
| 26 | Unstable | Unstable | Neutral | Stable |
During the summer, the model revealed a lower skill in representing nighttime stability, which may be associated with the difficulty of the model in estimating the nocturnal cooling of the surface and lower atmosphere levels. The underestimation of the diurnal cycle amplitude by weather models can be a response to a misrepresentation of the soil properties and land use characteristics (Ács et al., 2014) and/or of an air mass advection (de Bode et al., 2021).
Figure 10 presents the vertical profile of the potential and dew point temperatures from simulations and observations during a specific time and date, chosen according to the availability of observations. The vertical potential temperature profile is generally well represented, with slightly higher differences in the layer below 800 hPa. Models have lower performance in simulating the atmospheric variables in the layers closest to the surface due to the difficulty in representing the mixture in the vertical layer, mainly due to the complex terrain and land use representation (Hu et al., 2013). The WRF has low skill in simulating the dew point temperature (Fig. 10), which can be associated with several factors: use of climatological sea surface temperature, misrepresentation of land use and terrain details, high urbanization and the presence of large bodies of water, and large vegetated areas of our study area. For P1, the temperature and dew point temperature behavior analysis indicated that the model represented wet and dry layers well. For P2, it is observed that the model had greater difficulty in representing the wet layers.
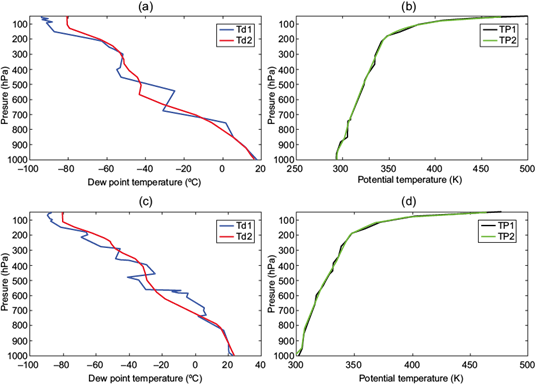
Fig. 10 Simulated and observed vertical profile of (a) dew point temperature and (b) potential temperature on 08/06/2013 at 12:00 UTC; and (c) dew point temperature and (d) potential temperature on 01/22/2014 at 00:00 UTC. (Td1: observed Td, in blue; Td2: simulated Td, in red; TP1: observed θ, in black; and TP2: simulated θ, in green).
3.3 Atmospheric stability vs. pollutant concentration
To evaluate the impact of atmospheric stability on the PM10 concentration, the results of the meteorological station of Pedra de Guaratiba will be presented as an example. Figure 11 shows the evolution of PM10 concentrations recorded at this station and the stability classification estimated from the results of the WRF model during P1. The results revealed stable atmospheric conditions in 67% of the cases, unstable conditions in 26%, and neutral conditions in 6%. This agrees with what is typically observed during the winter in the region when the atmosphere is more conducive to stability conditions due to a lower incidence of solar radiation and SASA performance (Santos et al., 2016; Reboita et al., 2019). The highest concentrations of PM10 occur in the first four days when there is a stable atmosphere during most hours, which is less conducive to the dispersion of pollutants. The lowest concentrations were verified on days 5 and 6 when P1 presented unstable conditions during subsequent times. The times of decrease in concentration on all days also agree with the time when the sea breeze reaches the region. Lower concentrations are also associated with higher PBL heights, and high concentrations are associated with lower PBL heights.
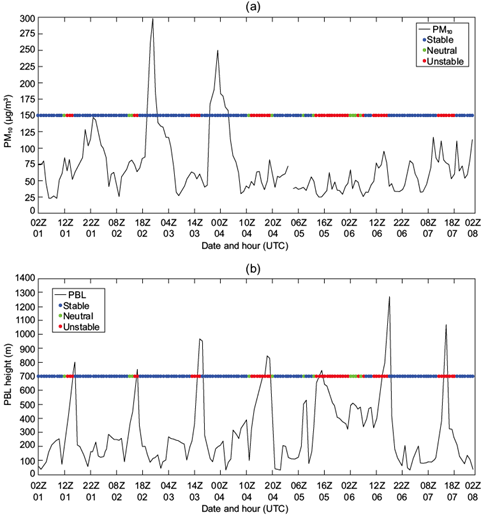
Fig. 11 (a) Stability and concentration of PM10 during the period from 08/01/2013 to 08/07/2013; (b) stability and height of the PBL during the period from 08/01/2013 to 08/07/2013 at Pedra de Guaratiba station.
Figure 12 shows the evolution of O3 concentrations and the atmospheric stability classification at Pedra Guaratiba station during P2. The model results reveal stable atmospheric conditions in 65% of the cases, neutral conditions in 21%, and unstable conditions in 14%. This behavior is atypical for a summer period when the atmosphere presents a period of greater instability, especially during the afternoon due to the intense heating of the surface. The highest ozone peaks occurred around 15:00 LT when the greatest radiation incidence occurred. Most of the time, the model simulates the transition from an unstable atmosphere to a stable one (also reported by Herrera-Mejía and Hoyos, 2019). The predominance of stable conditions during the summer, when high O3 concentrations were registered, may represent a significant association. It is noteworthy that since the formation of O3 requires the incidence of solar radiation, the dependence on stability conditions is often not studied.
4. Conclusions
This study aimed to evaluate the PBL conditions simulated by the WRF model and its impact on air quality during days when episodes of high concentrations of O3 and PM10 were recorded in the MARJ. The influence of SASA in both periods was verified. Under the influence of the SASA, the southeast region predominantly presents clear sky conditions and light winds, which favors the maintenance of episodes with high pollutants concentration in the region. It should be noted that despite different formation mechanisms, periods with high concentrations of O3 and PM10 presented similar meteorological conditions regarding the mean sea level pressure, cloud cover, and winds conditions. All of these conditions were represented satisfactorily by the WRF results. The analysis of the model results and the observations allowed the identification of the sea breeze and the impact on the transport of pollutants from coastal areas to regions further away from the coast (predominantly located in the northeast/northwest direction).
Verification of the vertical profile of potential temperature showed agreement between the results simulated by the WRF and the observations. The comparison of the classification between the atmospheric stability, verified through the Ri number from upper-air observations and WRF results, showed a greater agreement during the day in the summer and at night during winter. The comparison between the PBL height obtained through observations and the model results revealed adequate results. Thus, the results obtained in this study can support the use of PBL height data generated by meteorological models in regulatory air quality models that require such information. However, further studies are needed to expand the verification of the WRF model performance and of other meteorological models for other meteorological situations and regions of Brazil.
The evaluation of the impact of stability revealed that the highest concentrations of PM10 were verified in times of stable atmosphere and with low PBL height. The highest concentrations of O3 occurred during times of atmospheric instability, which coincide with those with the highest incidence of solar radiation; however, the results indicate that stability conditions may be conducive to maintaining the pollutant over the region. In this context, based on the assessment of the high dependence of pollutants on meteorological conditions, it is possible to conclude that meteorological forecasting, combined with knowledge about the emission sources of priority pollutants and the topography of a region, can be used as an indication for the air quality forecast in a region.


 nueva página del texto (beta)


