


 nueva página del texto (beta)
 Inglés (pdf)
 Artículo en XML
 Referencias del artículo
 Enviar artículo por email
 Citado por SciELO
  Similares en
SciELO
Similares en
SciELO 
 Permalink
Introduction
β-carotene is a nutrient of great importance for human health, as it has antioxidant properties that help to reduce the risk of neurological or neurodegenerative diseases such as stroke or Alzheimer’s disease, as well as stress disorders or cancer (Miękus et al., 2019); however, its low absorption capacity and its easy degradation from natural sources has led to the development of microencapsulation methods to improve its stability and bioavailability; thus, allowing to enrich foods (Pino and Aragüez, 2021). Likewise, its use as a nutraceutical ingredient or natural colorant is currently limited by its poor water solubility, high melting point, chemical instability, lipophilic character, and low bioavailability (Gutiérrez et al., 2013; Liang et al., 2013; Qian et al., 2012).
An alternative encapsulating material is collagen extracted from tilapia scales. These scales represent approximately 5 % of the fish live weight and are rich in collagen (41 to 84 %), this content depends on the species, the area in which they were caught, the region and their diet (El-Rashidy et al., 2015; Wang et al., 2013). The use of polymers in encapsulation is very common because of their good encapsulation properties; in this study collagen was used and soy protein isolate was blended to protect the β-carotene, as it was demonstrated that collagen and other polymer blends offer good protection to antioxidant compounds (Feng et al. 2024; Vargas-Muñoz et al., 2020). On the other hand, it is important to analyze the degradation kinetics of bioactive compounds in the encapsulates to compare the effect of the use of wall materials and determine the order and the kinetic rate constant of the degradation reaction. The reaction rate constant, in one or two-order reactions, may not be constant during a chemical reaction, so its proportionality will be associated with reaction rate and reactants concentration to predict product shelf-life (Bosch et al., 2013; Gaffney and Marley, 2018). The aim of this study was to evaluate the effectiveness of collagen extracted from Nile tilapia (Oreochromis niloticus) scales in the encapsulation of β-carotene and to analyze its degradation kinetics in storage at 35 °C.
Materials and methods
Biological material
Tilapia (Oreochromis niloticus) scales were provided by an aquaculture hatchery located in Emiliano Zapata, Veracruz, Mexico. Scales were washed with purified water, dried at the sun for 5 h and stored in an airtight recipient until use. Soy protein isolate (90 % protein) was obtained from Zave Tecnolimentaria S.A de C.V, Mexico. Synthetic β-carotene > 93 % purity, EDTA, NaOH, NaCl and CH3COOH (C2H4O2) were obtained from Sigma-Aldrich, Mexico.
Extraction of collagen from tilapia scales
Collagen extraction was carried out according to Quintero and Zapata (2017) with modifications. First, fish scales were washed with cold water. Non-collagenous proteins were removed by treating the samples with 0.1 M NaOH in a 1:10 (w/v) ratio under continuous stirring for 24 h, changing the alkaline solution at intervals of 12 h; the scale samples were then treated with 0.5 M EDTA (pH 7.5) at a 1:10 (w/v) ratio for 3 days, changing the solution every 24 h; then, the demineralized materials were washed with cold distilled water. Subsequently, the samples were treated with 0.5 M acetic acid for 3 days with continuous stirring. The supernatant was collected after centrifugation at 18,000 × g for 30 min. The supernatant was salted with NaCl to a final concentration of 2 M. Precipitates were obtained by centrifugation at 15,000 × g for 30 min. Finally, the precipitates were lyophilized at 0.05 mBar for 2 days (Labconco freeze dryer, Kansas City, MO, USA) and the moisture content was determined.
Collagen chemical composition
Moisture, ash, protein, and fat contents were determined according to the official methods established by the Association of Official Analytical Chemists (AOAC, 1980).
Encapsulation
Two suspensions of 13 % (w/v) and 0.25 % (w/w respect to wall material dry base) of β-carotene concentration were prepared. The first suspension was made with collagen and a soy protein isolate (1:4 ratio), while the second one was made only with the soy protein isolate as wall material; then, the mixtures were homogenized at 15,000 rpm (Oster blender) at 3-min intervals for 12 min, after freezing at -70 °C; finally, samples were freeze dried at -50 °C and 0.05 mBar for 2 days using a freeze dryer (Labconco Freezone, Kansas City, MO, USA). The above description provided two encapsulates, one with soy protein isolate (EP) and the other one with soy protein isolate and collagen (EPC).
Bulk density
Bulk density determination was performed as follows: 1 g of sample was weighed and placed in a 10 mL graduated cylinder, recording the volume displaced by the sample in mL (FEUM, 2014). Density was calculated with Equation 1.
Where ρ g is the bulk density, m is the mass of the sample and v is the volume occupied by the sample.
Compacted density
Compacted density was carried out as established by FEUM (2014) with some modifications. One g of the sample was weighed and poured into a 10 mL graduated cylinder, followed by ‘tapping’, which consisted of raising the cylinder to a height of 10 cm and returning it to the surface, repeating this operation 250 times, recording the final volume occupied. Equation 2 was used for the calculations.
Where ρ c is the compacted density, m the mass of the sample and v c the compacted volume.
Particle density
Particle density is the mass of the solid fraction divided by the occupied volume, excluding intergranular spaces (Ambrose et al., 2015). Particle density determination was performed as established by Jinapong et al. (2008). One g of sample was placed inside a 10 mL measuring cylinder, then 5 mL of petroleum ether were added and mixed with another 1 mL of ether, and the walls of the cylinder were washed. The particle density was determined using Equation 3.
Hausner index
The Hausner index is a fluidity indicator that helps determine powders cohesiveness. HI values > 1.4 indicate high cohesiveness, values between 1.2 and 1.4 an intermediate cohesiveness, and values < 1.2 indicate low cohesiveness (Islam et al., 2017). The Hausner index determination was carried out using Equation 4.
Where HI is the Hausner index, ρ c the compacted density and ρ g the bulk density.
Compressibility index
The compressibility index, or Car index (CI), is a fluidity indicator that determines the proponsity of a powder to compress (Ambrose et al., 2015). Compressibility values < 15, 15-20, 20-35, 35-45 and > 45 % represent excellent, good, intermediate, little, and very little fluidity (Islam et al., 2017). The Car index was calculated with Equation 5.
Porosity
The porosity results from the relationship between particle density and compacted density; this value represents potential permeability, as well as aeration through bulk solids (Ambrose et al., 2015). The porosity was calculated using Equation 6.
Where ε is the porosity, ρ p the particle density and ρ c the compacted density (Islam et al., 2017).
Assessment of degradation
Samples were incubated at 35°C for eight weeks. The quantification of β-carotene during storage was carried out every week according to Lan et al. (2021) with modifications. A β-carotene calibration curve in solution with acetone was performed, with a concentration range between 0 and 1.25 µg mL-1 (0.025, 0.5, 0.75, 1.00, 1.25 µg mL-1), read in a spectrophotometer (Genesys 20, Thermo Scientific UV/Vis) at 475 nm. The samples (0.25 g) were diluted, mechanically agitated for 5 min, and filtered before evaluation of β-carotene degradation.
Kinetics of β-carotene degradation Zero, first and second order equations (Equations 7, 8 and 9, respectively) were used to determine the reaction order followed by the samples and determined by linear regression. Parameters such as the reaction rate constant k, which was equal to the slope value, and the initial concentration [A] 0 were calculated.
Where [A] refers to the concentration, [A] 0 is the initial concentration, [A] t is the concentration at an arbitrary time, t is the time, and k is the reaction rate constant.
Half-life
The half-life of a reaction, t 1/2 , is the time required for the concentration of a reactant to drop to half its original value. Equation 10 was used:
Where k is the reaction rate constant.
ß-carotene retention
The percentage of ß-carotene retention (TR) in the emulsion was calculated using Equation 11 (Wang et al., 2013).
Where C b refers to the carotene content in the emulsion and C a refers to the carotene content in the samples after treatment (powder).
Encapsulation efficiency
Samples of the EP and EPC encapsulates were weighed (0.25 g) and diluted in acetone. The resulting solutions were read spectrophotometrically at 475 nm. Subsequently, the encapsulation efficiency (EE) was calculated from the ratio of the experimental and theoretical encapsulated mass, according to Equation 12.
Where m exp is the experimentally encapsulated mass (g) and m teo is the theoretically encapsulated mass
Image analysis
Pictures were taken every two weeks of the capsules stored at 35 °C for eight weeks with a camera (Xiaomi, Redmi note 8 pro, 64 MP, Beijing, China) with ultra-high resolution. Once the storage time was over, image analysis was carried out using the Python 3.7.3 program, performing exponential regressions in Scipy 1.5.2, until obtaining the equation that describes the relationship of RGB (red, green, blue) colors with concentration. Images were converted to RGB colors by PIL 9.2.0.
Statical analysis
All determinations were made by triplicate and each value represents the mean of at least three measurements. Significant differences between means of the parameters studied from EP and EPC samples were determined by t-test analysis (SigmaStat 3.5). An alpha level of 0.05 (P ≤ 0.05) was used to determine significance. The values statistically different were indicated by different superscripts.
Results and discussion
Proximal composition of collagen extract
Results of proximal composition of the collagen extract are shown in Table 1. Collagen extraction yield was 13.8 % with a moisture content of 7.87 g/100 g d.s. (dried solids), the collagen ash content was 40 g/100 g d.s. and protein content was of 47 g/100 g d.s. Tilapia collagen extract showed a protein value of 47 %, this value can be close to the amount of pure collagen since collagen is the main rotein extracted by the method used in this work, which correspond to 6.4 % (considering the extraction yield of 13.8 %). The extraction yield of collagen in the literature is reported with low concentration; for example, Pati et al. (2010) and Duan et al. (2009) achieved yields of 5 and 1.35 %, respectively; however, these results correspond to pure collagen. In this work collagen was not purified.
Flow properties
Table 2 shows the results of flow properties. In the case of bulk density for EP, EPC and collagen extract, EP had the lowest values, while collagen had the highest value of bulk density, indicating that EP has more roughness and voids than EPC, whereas collagen has a smoother surface and fewer cavities than EPC and EP according to Acosta-Domínguez et al. (2022) and Lüddecke et al. (2021), who demonstrated that the bulk density is proportional to the roughness and surface irregularities in the powders by AFM (Atomic Force Microscopy). The powder bulk density is a significant parameter for packaging and storage. In general, the bulk density of different food powders is in the range of 300 to 800 kg m-3. Food products with lower bulk density are more susceptible to oxidation and subsequent poor storage stability due to increased air between their voids (Koç et al., 2017).
Table 2 Flow properties of EP, EPC, and collagen
| Property | EP | EPC | Collagen |
| Bulk density (kg m-3) | 180a ± 0.002 | 220b ± 0.006 | 580c ± 0.0 |
| Compacted density (kg m-3) | 260a ± 0 | 290b ± 0.006 | 660c ± 0.0 |
| Particle density (g cm-3) | 1.66a ± 0.0 | 2.5b ± 0.0 | 5.0c ± 0.0 |
| Hausner index | 1.43a ± 0.018 | 1.34b ± 0.070 | 1.132c ± 0.0 |
| Compresibility index (%) | 30.26ª ± 0.904 | 25.53b ± 3.91 | 11.68c ± 0.0 |
| Porosity (%) | 84.20ª ± 0.00 | 88.05b ± 0.25 | 86.68c ± 0.0 |
Data are expressed as means ± sd (n = 3). Significant differences in each row are indicated by different superscripts (P ≤ 0.05).
The incorporation of collagen to the EP samples increases the bulk density, which is desirable because it reduces storage, packaging and transport costs (Baysan et al., 2019). The compacted density was 0.26 g cm-3 for EP, 0.29 g cm-3 for EPC and 0.66 g cm-3 for the extracted collagen. Compaction compresses samples due to forces or pressures, causing a decrease in pore volume; therefore, its value is always higher than bulk density. In this case, collagen showed a higher compacted density than the encapsulated ones, which means the presence of smoother and less porous surfaces in the powders.
The particle density presented values of 1.66, 2.5 and 5 g cm-3 for EP, EPC and collagen extract, respectively. This indicates that the mass of EP occupied a larger volume than that of EPC and collagen extract due to the presence of voids on the surface. Physical parameters such as bulk density, particle density and compacted density affect the powder flow properties and storage stability. Also, increasing bulk density reduces the amount of air trapped in the spaces between the particles, promoting a reduction of the risk of oxidation of powders during storage and increasing storage stability (Carneiro et al., 2013). The results showed that the addition of collagen to the encapsulation caused a significant increase in bulk density, as it is known, powders with high bulk density require less storage space, as they reduce the volume of package compared to powders with low bulk density. In this work, collagen incorporation decreased the values of the Hausner index and compressibility index. Results of EP and EPC flow properties were similar to those of Elik et al. (2021), who encapsulated carotenoids by freeze drying and spray drying using maltodextrin, pectin and waxlike wall materials. They reported the following results of encapsulated carotenoids: bulk density 192.5 and 240.85 kg m-3, Hausner ratio 1.32 and 1.68, Car index 24.51 and 40.62, for freeze drying and spray drying, respectively.
According to Islam et al. (2017), compressibility values < 15, 15-20, 20-35, 35-45 and > 45 % represent excellent, good, intermediate, little, and very little fluidity, respectively. HI values > 1.4 indicate high cohesiveness, values between 1.2 and 1.4 indicate an intermediate cohesiveness, and values < 1.2 indicate low cohesiveness. Thus, using the classification proposed by Islam et al. (2017), in this work a flow with high cohesiveness and intermediate fluidity was obtained for EP, an intermediate flow and cohesiveness for EPC and excellent flow with low cohesiveness for collagen. In this case collagen decreased the cohesiveness of the encapsulation with soy protein isolate. Cohesiveness plays a fundamental role in determining the texture of food, directly influencing its ability to maintain shape and structure. In the case of food powders, cohesiveness has been linked to the water content, wetter powders are more cohesive and difficult to flow; however, the shape of the powder particle, size and interactions also affect cohesiveness and flowability (Düsenberg et al. 2023). Porosity of EP, EPC and collagen was 84.2, 88.1 and 86.7 %, respectively. Porosity represents the aeration capacity of bulk solids, resulting from the relationship between particle density and compacted density (Ambrose et al., 2015). Low porosity may be caused by low oxygen permeability, which implies a lower risk of oxidation (Islam et al., 2017). Based on the above, it is necessary to protect EP and EPC powders with a packaging material that protects them from the environmental factors that cause oxidation of β-carotene.
β-carotene degradation in storage
Table 3 shows β-carotene degradation, including storage time, β-carotene concentration, retention and images of encapsulating (a clear decrease in β-carotene content in EP and EPC can be observed). The β-carotene content was calculated using the equation: y = 0.0013x - 2E-05; R2 = 0.9861, where y represents β-carotene concentration (mg/g d.s.).
Tabla 3 Degradation of EPC and EP at 35 °C.
| Time (weeks) | EPC | EP | ||||
| Concentration (mg/g d.s.) | Retention (%) | Images | Concentration (mg/g d.s.) | Retention (%) | Images | |
| 0 | 1.66 ± 0.04 | 83.39 |

|
1.065 ± 0.047 | 53.267 |

|
| 2 | 0.57 ± 0.11 | 28.76 |

|
0.34 ± 0.0 | 17.32 |

|
| 4 | 0.14 ± 0.004 | 7.14 |

|
0.09 ± 0.0073 | 4.54 |

|
| 6 | 0.029 ± 0.004 | 1.48 |

|
0.018 ± 0.006 | 0.9389 |

|
| 8 | 0.016 ± 0.002 | 0.84 |

|
0.009 ± 0.001 | 0.48 |

|
Data are expressed as means ± sd (n = 3).
After eight weeks, β-carotene content in EP was reduced from 1.06 to 0.009 mg/g d.s., while in EPC reduction was from 1.66 to 0.016 mg/g d.s. Retention of β-carotene in EP was significantly lower than in EPC prior to storage.
The retention of β-carotene in EP and EPC was 53.3 and 83.4 %, respectively. After storage at 35 °C for eight weeks, β-carotene retention was 0.84 % in EPC and 0.48 % in EP. encapsulation efficiency of EPC (66.71 %) was better than that of EP (42.61 %), which may be caused because collagen has a higher affinity for carotenoids than soy protein. As can be seen, both samples showed a large loss in β-carotene content, mainly due to storage temperature; however, it is evident from these data that EPC presented a higher concentration of β-carotene than EP during storage conditions from start to finish.
Kinetics of the degradation of β-carotene in the storage
Figure 1 shows β-carotene concentrations in EPC and EP during storage at 35 °C. The data points were adjusted with kinetic models of 0, 1 and 2 orders.
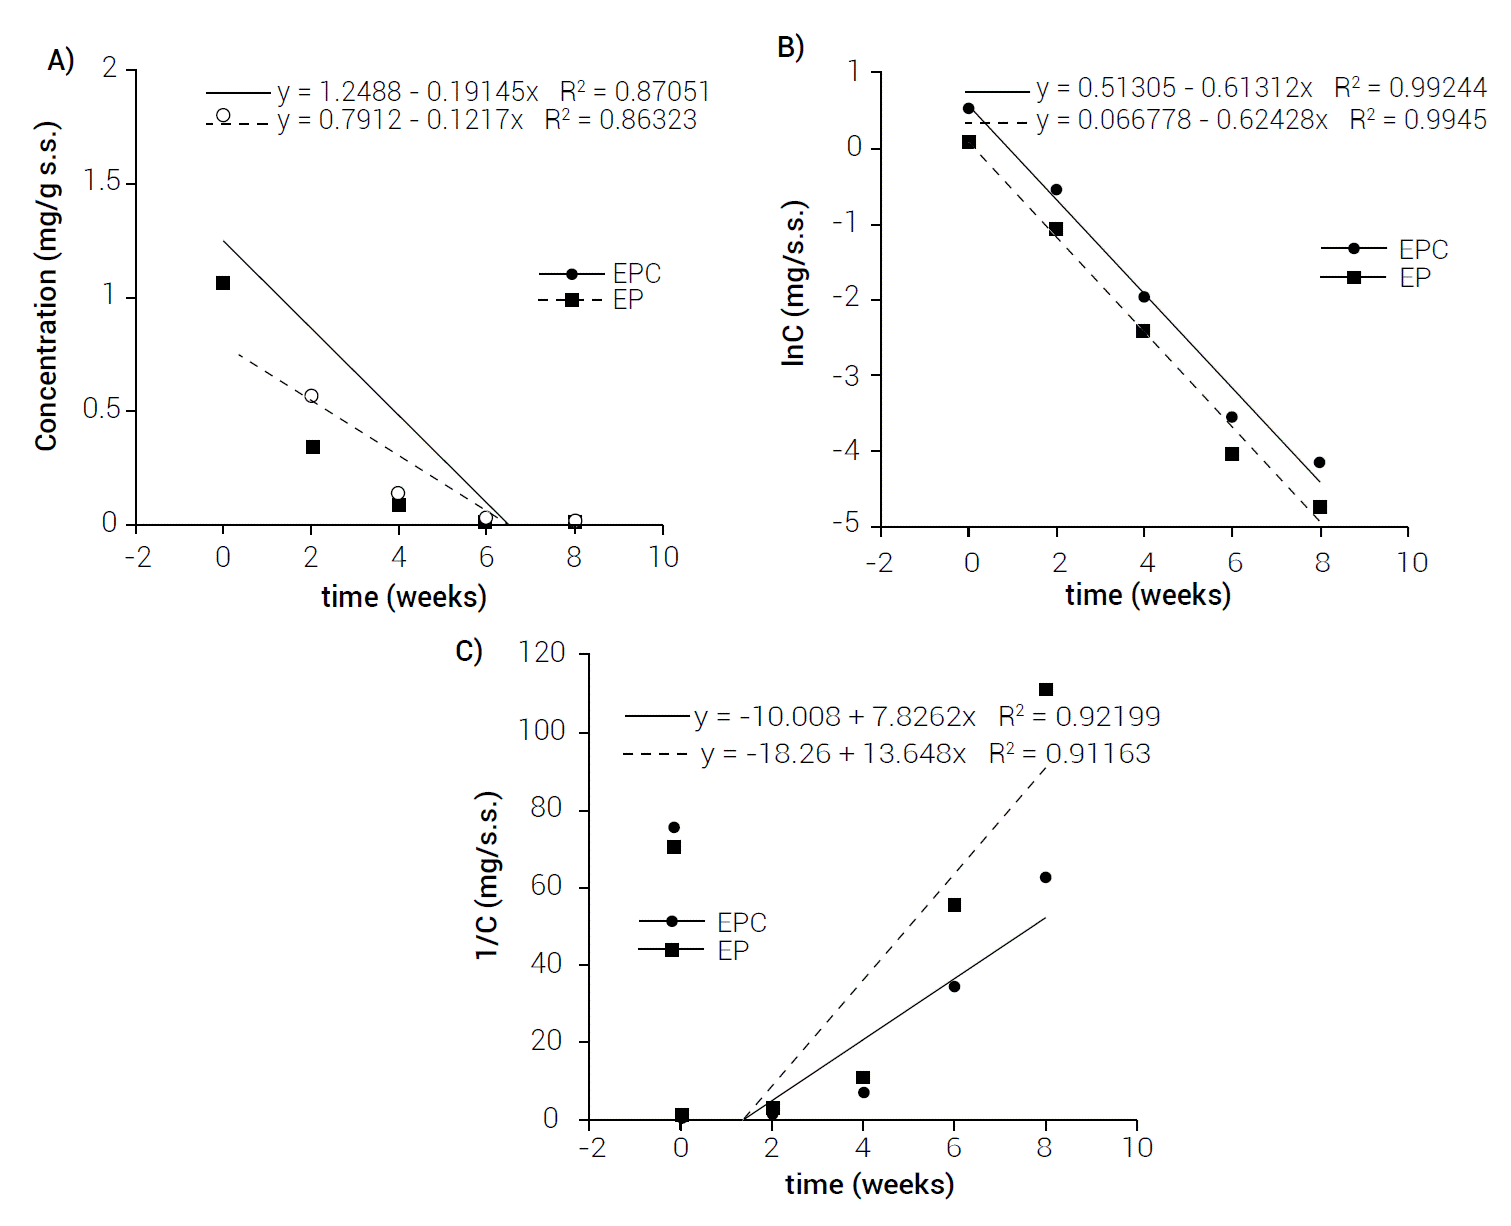
Figure 1 Adjustment of kinetic models of β-carotene degradation during storage at 35°C A) zero, B) one, C) two orders.
According to Gaffney and Marley (2018), the reaction rate changes when reagents concentrations change. The way in which these concentrations change affects reaction speed. This is determined experimentally by measuring reaction rates as the concentrations of the reagents vary. The result is a constant of proportionality between the reaction rate and the reagents concentration. The order of a reaction in a kinetic model is a parameter that provides a mathematical description of time or concentration dependence. The best known models referring to shelf-life studies are zero reactions that represent a linear evolution (retention or degradation) of the parameter, while first and second order reactions represent an exponential evolution of the parameter (Bosch et al., 2013).
In Figure 1 it is possible to see that the linearity of regression in the natural logarithmic scale showed that the degradation of β-carotene at 35 °C in the EP sample follows a first-order kinetics, where the value of the correlation coefficient indicated a good adjustment (R2 = 0.9945). The kinetic constant was k = 0.6243, using this value to determine the half-life time, provided a value of 7.77 days. Also, in Figure 1 it is possible to see that the linearity of the regression in the natural logarithmic scale showed that the degradation of β-carotene at 35 °C in EPC followed a first-order kinetics, where the correlation coefficient value indicated a good adjustment (R2 = 0.9924) as well. The kinetic constant was k = 0.6131, using this value to determine the half-life time a value of 7.91 days was computed. Similar results were obtained by Kong et al. (2018), who encapsulated β-carotene in amylose/starch complexes with ascorbyl palmitate (ASCP), their results showed that degradation follows a first-order kinetic in all their treatments; in addition, they obtained the half-life time of 9.59 days for their β-carotene microcapsules stored at 30 °C for six weeks. This value is similar to that obtained in this investigation.
Image analysis
The results of the imagen analysis are showed in equations yEP and yEPC, both describe the relationship between color and β-carotene concentration of EP and EPC samples (0.25 g), respectively.
Where: x 0 is red (r), x 1 is green (g) and x 2 is the blue of RGB (red, green and blue) scale of the photos taken, and y is the concentration of β-carotene.
Table 4 shows the scale of RGB variables determined by equations yEP and yEPC, and the concentration values obtained by imagen analysis. The error rate of equations yEP and yEPC was 7.2 and 1.5 %, respectively, which corroborates that the equations had a good fit determining the concentration of β-carotene in the EP and EPC samples during six weeks of storage.
Table 4 Variables determined by equation and of RGB scale.
| Time (weeks) | EP | EPC | |||||||
| x0 | x1 | C (mg/0.25 g d.s) | C (mg/g d.s) | x0 | x1 | x2 | C (mg/0.25 g d.s) | C (mg/g d.s) | |
| 0 | 0.464 | 0.408 | 0.266 | 1.065 | 0.464 | 0.404 | 0.419 | 0.416 | 1.667 |
| 2 | 0.477 | 0.427 | 0.086 | 0.346 | 0.460 | 0.425 | 0.425 | 0.143 | 0.575 |
| 4 | 0.447 | 0.424 | 0.022 | 0.091 | 0.465 | 0.455 | 0.443 | 0.035 | 0.142 |
| 6 | 0.425 | 0.475 | 0.0006 | 0.0027 | 0.426 | 0.458 | 0.479 | 0.0076 | 0.0306 |
x0, x1, x2 are the variables of RGB scale that represent the red, green, and blue color, respectively. EP: soy protein encapsulation, EPC: soy protein+collagen encapsulation. C: Concentration.
Conclusions
Collagen proved to be a functional material for encapsulating β-carotene, as EPC has a higher encapsulation efficiency and retention percentage than EP at 35 °C for the eight weeks span of this work. EP and EPC followed a first order kinetics and had a similar half-life as both presented similar kinetic constants. Also, EP was classified as a powder with high cohesiveness and intermediate fluidity, while EPC as a powder with intermediate cohesiveness and intermediate flow, so collagen decreased cohesiveness and increase bulk density of β-carotene encapsulate with soy protein isolate. On the other hand, image analysis provided an equation to predict the content of β-carotene encapsulated in the collagen and soy protein isolate matrix.

