


 nueva página del texto (beta)
 Inglés (pdf)
 Artículo en XML
 Referencias del artículo
 Enviar artículo por email
 Citado por SciELO
  Similares en
SciELO
Similares en
SciELO 
 Permalink
INTRODUCTION
Recently, several countries have committed to international agreements to reduce greenhouse gases (GHG) emissions. Therefore, it is necessary to carry out an evaluation of the most polluting processes. The brick kiln industry represents one of the major small-scale industries which fulfill the growing demand for urban expansion. This industry generates negative impacts on the environment in respect of air quality, human health and vegetation in particular (Skinder et al. 2014). Ceramic bricks are one of the most impacting materials in the whole building process (Martínez-Rocamora et al. 2016), even though this appears to be a very profitable business (Singh and Asgher 2005). China tops global production and its manufacturing process is increasingly dominated by modern technologies (Schmidt 2013). About 250 billion bricks are produced in the Indian industry, which is the world’s second largest-brick producer overall and the largest artisanal producer (Rajarathnam et al. 2014). Nevertheless, the producers of Latin America tend to rely on the most primitive and most polluting types of kilns (Schmidt 2013). There are more than 17 000 artisan bricklayers in Mexico according to the Instituto Nacional de Ecología y Cambio Climático (National Institute of Ecology and Climate Change (INECC 2013).
The brick kilns may be grouped into two broad categories known as intermittent and continuous kilns. Most of the kilns around the world that contribute to the pollution of environments are traditional intermittent (Rajarathnam et al. 2014). It seems therefore fundamental to asses and quantify the environmental impact of this production process (Hoxha et al. 2016).
Life cycle assessment (LCA) is a methodological tool used in industry to evaluate the environmental impacts of products, and improve operation and manufacturing efficiency (Güereca et al. 2015). Actually, the most frequently addressed topics are waste management, construction, agriculture, transport, and chemical sector, among others (Bovea et al. 2017). Some international LCA studies have been conducted to analyze the environmental impacts of buildings (Bribián et al. 2009, Saner et al. 2013, Zhang et al. 2013, Hoxha et al. 2016) and construction materials (Buyle et al. 2013, Castell et al. 2013, Ibbotson and Kara 2013, Lasvaux et al. 2015). Recently, it has been found that construction materials can be responsible for 20-90 % of the global warming potential (GWP) indicator and the variation is mainly due to the building projects and the embodied energy of the materials employed (Hoxha et al. 2016). However, information available on the life-cycle impacts of the traditional brick manufacturing process is limited. The aim of this work is to quantify the environmental impacts of Mexican brick manufacturing scenarios, evaluating an improvement in performance.
MATERIALS AND METHODS
Life cycle assessment (LCA)
An LCA quantifies the potential environmental impact of a product or a service throughout its life-cycle (ISO 2006a). Its main advantages are its elaborate framework for data collection and quantification of environmental exchanges between the system of interest and the environment. The LCA methodology can evaluate opportunities for environmental improvements (Nouri et al. 2012). The International Organization for Standardization has regulated the LCA framework, which consists of four elements: (a) goal and scope definition, (b) inventory analysis (c) impact assessment, and (d) interpretation. The traditional Mexican brick manufacturing process was selected as a case study and the international standards were analyzed (ISO 2006a, b).
LCA goal and scope definition
The objective of this LCA study was to evaluate the environmental impacts of three fired-brick processes under the following conditions:
Scenario I. Traditional intermittent brick manufacturing process in the clamp kiln (Fig. 1a).
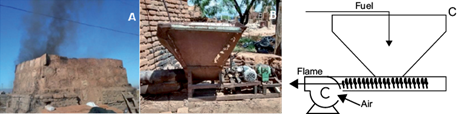
Fig. 1 (a) Traditional clamp kiln, (b) hopper-blower device picture, (c) flow diagram of hopper-blower device
Scenario II. Traditional process adding a hopper-blower (HB) device (Fig. 1b). This device is used to increase the quantity of air blown while mixing it with fuel inside the clamp kiln.
Scenario III. Traditional process adding two HB devices.
The scope of this LCA study covers the stages of raw material extraction, transport to the production floor and production process. This last stage involves preparing mixtures, molding, drying and firing. Figure 2 depicts the system boundaries for the study. The emissions related to the energy embodied in machinery and buildings, as well as the personal transport of the workers were excluded. The “cradle-to-gate” approach deducts the transport of the final product to its point of sale.

The functional unit of this study is the production of one traditional clay fired-brick in standard size (7, 14, and 28 cm) manufactured with 1.29 kg of clay and 200 mL of water, under the operating conditions of the traditional clamp kiln with a 17 000 bricks capacity (average work temperature, 900 ºC).
Inventory database and life cycle impact assessment (LCIA) methods
The inventory analysis collects input and output data to perform a quantitative description of all the material and energy flows across the system boundary. The quantity and quality of data may have a significant impact on the final results (Zhang et al. 2013). The majority of the data for the consumption of fuel and raw materials was collected experimentally in collaboration with local producers. The CO2, CO, and O2 emission concentrations were determined with a gas analyzer (Testo 330-LI with 0.2 L/min) at the combustion kiln outlet. Residual sawdust is widely used as fuel by the brickmakers. In order to measure the concentration of sawdust elements, C, H, N and S were analyzed using a gas chromatograph (EA110, CE Instruments). The chlorine concentration was measured using argentometric analysis.
Mass balance based on fuel characterization was realized to predict the average concentrations of the combustion gas mixture output. In order to calculate the air emissions inventory, the following assumptions were made: (i) the study considered that only N contained in fuel reacts to produce NOx emissions, represented as equivalent nitrogen monoxide, (ii) polychlorinated compounds were represented as equivalent 2,3,7,8-tetrachlorodibenzo-p-dioxin, (iii) the generation of polychlorinated compounds were calculated according to chlorine concentrations in sawdust, with the worst-case scenarios being where all the chlorine generates polychlorinated compounds, and (iv) particulate matter emissions were excluded due to non-homogeneous fire conditions measures, even though particulates are highly significant in brick manufacture.
The life cycle inventory (LCI) data for clay extraction and the environmental impact of transport was calculated using the AP-42 emission factors of the Environmental Protection Agency for non-controlled diesel motors (EPA 1995). All the transport distances were measured by a PC serial port (RS232) GPS system. The considered distances were: (i) 14.6 km between the extraction zone and the brick production zone, (ii) 9.36 km between the water supply zone and the brick production zone, and (iii) 14.65 km between the sawdust production zone and the production zone.
The electricity generation inventory was carried out and the emissions were also calculated according to emission factors AP-42 for natural gas combustion (EPA 2009). The process information was supplied by the combined cycle power plant El Encino (Chihuahua Mexico), which operates using natural gas combustion and has less environmental impacts compared to coal combustion systems (Agrawal et al. 2014).
There are two main categories of LCA databases: the generic database mainly provided by academics and databases provided by the specific industry (Lasvaux et al. 2015). The ecoinvent and GaBi databases were identified as the most complete LCA databases for assessment construction materials (Martínez-Rocamora et al. 2016). The present study was carried out using the LCA software SimaPro 7.3, ecoinvent v. 2.2 database parameters, and in situ measurements. In order to prove the sensibility of the characterization from different perspectives, three different LCIA methods were selected to translate the inventory data into impact categories:
Eco-indicator 99. This method was developed by PRé Consultants with a damage-oriented approach. It has three different approaches, namely egalitarian, hierarchist, and individualist. The egalitarian and individualist approaches are focused more on the radical reality than the hierarchist. This study used the egalitarian perspective of Eco-indicator 99.
Impact 2002+. It was developed by the Swiss Federal Institute of Technology-Lausanne, and it is a combined midpoint, endpoint and damage approach. It provides the distinction between impact and damage categories. This study was carried out using the midpoint approach.
CML 2001. This was proposed by the Leiden University Institute of Environmental Science and is primarily a midpoint approach.
ReCiPe. This method is a joint project effort between PRé Consultants and the Leiden University Institute of Environmental Science. The ReCiPe project is an integrated approach that combines the midpoint approach of CML 2001 with the damage approach of Eco-indicator 99 (Bare and Gloria 2006, Quirós et al. 2015). The ReCiPe method works with two levels of indicators: midpoint and endpoint. The midpoint approach was selected for this study.
Although midpoint indicators are relatively more difficult to interpret in comparison to endpoint indicators, their uncertainty is lower than in the latter (Cappuyns and Kessen 2012). Midpoint methodologies have a more comprehensive coverage of inventory flows than damage methodologies (Bare and Gloria 2006). Furthermore, the guidelines recommend more comprehensive coverage of impacts, more scientifically based modeling and more international consensus within these models, and these are all addressed within midpoint models.
RESULTS AND DISCUSSION
Life cycle inventory (LCI) analysis
The measurements of gas concentrations (Table I) suggest that firing time and GHG emissions will reduce if the amount of air in the combustion system is increased. Elemental chemical analysis of sawdust showed a weight content of 47.92 % carbon, 3.47 % nitrogen and 0.03 % chlorine; sulfur was not detected, hence SOx emissions were not considered in the mass balance. The identified chlorine could be attributed to pentachlorophenol, a commonly used wood preserving agent. The presence of polychlorinated compounds (furans and dioxins) is highly likely in manufactured pentachlorophenol (Tondeur et al. 2010); thus, the combustion of the used fuel (waste sawdust) could generate these compounds (Tchobanoglous et al. 1994) and their presence has significant implications on health effects. However, from the socio-economic perspective of producers, the sawdust used in brick kilns as fuel is a low-cost available option.
TABLE I MEASUREMENTS OF AVERAGE GAS CONCENTRATIONS
| Gas | Scenario I % | SD* % | Scenario II % | SD % | Scenario III % | SD % |
| Carbon dioxide (CO2) | 8.19 | 0.45 | 11.09 | 3.83 | 23.31 | 1.29 |
| Oxygen (O2) | 21.22 | 0.35 | 19.22 | 3.07 | 9.81 | 5.59 |
| Carbon monoxide (CO) | 0.05 | 0.01 | 0.03 | 0.05 | 0.12 | 0.16 |
SD: standard deviation
The electrical power consumption for scenario II (230 W) and scenario III (460 W) was calculated according to each HB motor. The electricity LCI (Table II) was used in an LCA study previously published (López-Aguilar et al. 2016). In this study case, it was assumed that the regional characteristics of electricity production represent the impact of electricity consumption even when it supplies a national electrical network.
TABLE II LIFE CYCLE INVENTORY (LCI) OF ELECTRICITY GENERATION FROM EL ENCINO COMBINED-CYCLE POWER PLANT (660 MW)*
| Outputs to the technosphere | ||
| Inventory category | LCI data | |
| Electricity (MW) | 1.00 | |
| Natural Gas (m3) | 2.15E-04 | |
| Carbon dioxide (ton) | 15.55 E+04 | |
| Carbon monoxide (ton) | 1.16 E+02 | |
| Methane (ton) | 12.16 | |
| Nitrous oxide (ton) | 4.24 | |
| Sulfur dioxide (ton) | 4.52 | |
| Nitrogen oxides (ton) | 4.52 E+02 | |
| Total suspended particles (TSP) (ton) | 9.33 | |
| Total organic carbon ton/month (TOC) (ton) | 15.55 | |
| Volatile organic compounds ton/month (VOC) (ton) | 7.62 | |
*Data collected from the power plant (28º 23’ 22.71’’ N, 105º 55’ 15.93’’ W) in May 2013, calculated with AP-42 parameters (EPA 2009).
The Mexican clay fired-brick manufacturing LCI (Table III) contributes to the development of the national inventory database that represents local materials and processes. According to Güreca et al. (2015) this is an important aspect to increase the use of LCA in Mexico.
TABLE III LIFE CYCLE INVENTORY OF MEXICAN CLAY-FIRED BRICK MANUFACTURING
| Inventory category | Unit | Scenario I | Scenario II | Scenario III | Data collection methods |
| Nature Inlet | |||||
| Air | kg | 11.14 | 4.10 | 2.83 | Mass balance calculation from measurements of O2 excess (gas analysis with Testo equipment) in April 2014. Location: 28º 36’ 54.3’’ N, 105º 57’ 58.25’’ W |
| Technosphere inlet | |||||
| Water | liters | 0.2 | 0.2 | 0.2 | In situ measurements in January 2014. Location: 28º 36’ 54.3’’ N, 105º 57’ 58.25’’ W |
| Clay | kg | 1.29 | 1.29 | 1.29 | |
| Sawdust | kg | 0.86 | 0.62 | 0.41 | |
| Water transportation | km | 1.87 | 1.87 | 1.87 | Information provided by producers and completed with the ecoinvent database (diesel-powered trucks from the US; Weidema et al. 2013) in January 2014. Location: 28º 36’ 54.3’’ N, 105º 57’ 58.25’’ W |
| Clay transportation | km | 18.95 | 18.95 | 18.95 | |
| Sawdust transportation | km | 12.69 | 9.07 | 6.04 | |
| Electricity | kJ | - | 0.58 | 1.16 | Table II |
| Output | |||||
| Bricks | piece | 1.00 | 1.00 | 1.00 | Information provided by the producers in February 201. Location: 28º 36’ 54.3’’ N, 105º 57’ 58.25’’ W |
| Firing time | hours | 16 | 12 | 8 | |
| Air emissions | |||||
| CO2 | kg | 1.29 | 0.92 | 0.62 | Gas analysis with Testo equipment in April 2013. Location: 28º 36’ 54.3’’ N, 105º 57’ 58.25’’ W |
| CO | kg | 8.00 E-03 | 2.00 E-03 | 3.00 E-03 | |
| Excess oxygen (O2) | kg | 3.34 | 1.60 | 0.26 | |
| Nitrogen inert from air | kg | 11.10 | 5.81 | 1.77 | Mass balance calculation based on information provided by producers in April 2013. Location: 28º 36’ 54.3’’ N, 105º 57’ 58.25’’ W |
| Dioxin polychlorinated | kg | 0.13 | 0.09 | 0.06 | |
| NOx (from fuel) | kg | 0.06 | 0.04 | 0.03 | |
| Water (H2O) | kg | 3.25 | 2.32 | 1.54 | |
In order to validate this work, table VIII shows a comparison of traditional brick kiln technology (sawdust as fuel) and tunnel brick technology (pet coke as fuel) applied in Greece (Koroneos and Dompros 2007). Even though biomass (sawdust) is supposed to be a cleaner fuel than pet coke, both studies show similar CO2 emissions. Moreover, any of the reviewed LCA studies consider the category of carcinogens (or impacts related to polychlorinated emissions) in their impact analysis (Khan et al. 2007, Cappuyns and Kessen 2012, Quirós et al. 2015). Table IX shows a comparison of the carcinogens and ecotoxicity categories of the present study with an LCA of traditional soil brick carried out on 16 traditional brick kilns located in India (Kumbhar et al. 2014).
INTERPRETATION
LCA studies could present the limitations of their application in different countries, with the exception of the resources damaged and the damage created by climate change, ozone layer depletion, air emissions of persistent carcinogenic substances and inorganic air pollutants with long-range dispersion. Lopsik (2013) concluded that the limitations and the assumptions made during the LCA study should be taken into account for interpreting impact assessment results.
Also, when using LCA, it is important to make a conscious choice of the database and LCIA methods to be used, knowing the consequences of decisions made in the study (Zhang et al. 2013). According to Rørbech et al. (2014), the selection of a method in specific LCAs may significantly affect its results and comparability with other studies. Thus, a sensitivity analysis was carried out based on comparing the variation of results using the LCIA methods. The analyses of the three scenarios are discussed below.
Eco-indicator 99. The results are shown in figure 3, where a substantial decrease is observed (scenarios I-III) in impact categories like carcinogens, respiratory inorganic, ecotoxicity acidification/eutrophication and climate change. This last category is influenced by GHG emissions. Otherwise, the categories radiation, ozone layer, minerals and fossil fuels show an increase of less than 6.5 % caused by electricity consumption. The land use category remained constant regardless of the presence of the HB device.
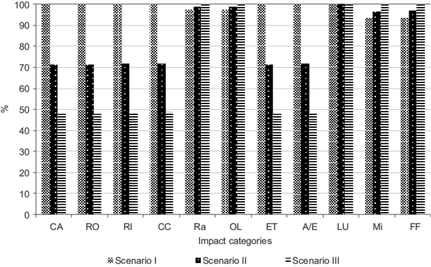
Fig. 3 Average contributions of life cycle impact assessment using Eco-indicator 99 damage approach for scenario I (traditional manufacturing), scenario II (one hopper-blower) and scenario III (two hopper-blowers). CA: carcinogens, RO: respiratory organics, RI: respiratory inorganics, CC: climate change, Ra: radiation, OL: ozone layer, ET: ecotoxicity, A/E: acidification/eutrophication, LU: land use, Mi: minerals, FF: fossil fuels (nomenclature in table IV)
TABLE IV NOMENCLATURE OF IMPACT CATEGORIES FOR FIGURES 4-7
| Eco-indicator 99 | ||
| Carcinogens | CA | DALY |
| Respiratory organics | RO | DALY |
| Respiratory inorganics | RI | DALY |
| Climate change | CC | DALY |
| Radiation | Ra | DALY |
| Ozone layer | OL | DALY |
| Ecotoxicity | ET | PDF • m2 • yr |
| Acidification/eutrophication | A/E | PDF • m2 • y |
| Land use | LU | PDF • m2 • y |
| Minerals | Mi | MJ surplus |
| Fossil fuels | FF | MJ surplus |
DALY: disability adjusted life years, PDF: potentially disappeared fraction, MJ: megajoules
Impact 2002+.Figure 4 shows a decrease through scenarios II and III in the categories carcinogens, no carcinogens, respiratory inorganics, aquatic and terrestrial ecotoxicity, terrestrial and aquatic acidification as well as global warming, which includes GHG emissions. The ionizing radiation, ozone layer depletion and respiratory organics categories present a slight increase of ~3 %, attributed to the addition of HB devices. On the other hand, there is an increase of ~46 % in the score of scenario II comparing to scenario I, whereas scenario III is ~63 % higher tan scenario I. This slight recovery percentage is attributed to the electricity demand characteristic of the fuel consumption (natural gas) of the combined cycle plant under study.
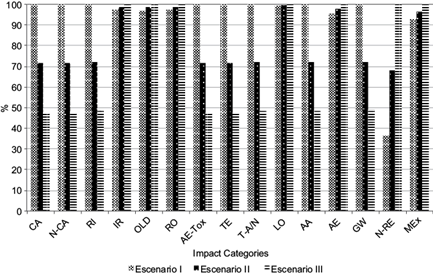
Fig. 4 Average contributions of life cycle impact assessment using IMPACT 2002 midpoint damage approach for scenario I (traditional manufacturing), scenario II (one hopper-blower) and scenario III (two hopper-blowers). CA: carcinogens, N-CA: non-carcinogens, RI: respiratory inorganics, IR: ionizing radiation, OLD: ozone layer depletion, RO: respiratory organics, AE-Tox: aquatic ecotoxicity, TE: terrestrial ecotoxicity, T-A/N: terrestrial acidification/nutrification, LO: land occupation, AA: aquatic acidification, AE: aquatic eutrophication, GW: global warming, N-RE: non-renewable energy, Mex: mineral extraction (nomenclature in table V)
TABLE V NOMENCLATURE OF IMPACT CATEGORIES FOR FIGURE 4
| IMPACT 2002+ | ||
| Carcinogens | CA | kg C2H3Cl eq |
| Non-carcinogens | N-CA | kg C2H3Cl eq |
| Respiratory inorganics | RI | kg PM2.5 eq |
| Ionizing radiation | IR | Bq C-14 eq |
| Ozone layer depletion | OLD | kg CFC-11 eq |
| Respiratory organics | RO | kg C2H4 eq |
| Aquatic ecotoxicity | AE-Tox | kg TEG water |
| Terrestrial ecotoxicity | TE | kg TEG soil |
| Terrestrial acidification/nutrification | T-A/N | kg SO2 eq |
| Land occupation | LO | m2org.arable |
| Aquatic acidification | AA | kg SO2 eq |
| Aquatic eutrophication | AE | kg PO4 P-lim |
| Global warming | GW | kg CO2 eq |
| Non-renewable energy | N-RE | MJ primary |
| Mineral extraction | MEx | MJ surplus |
Eq: equivalent, PM: particulate matter, CFC-11: trichlorofluo-romethane, TEG water: triethylene glycol into water, TEG soil: triethylene glycol into soil.
CML 2001. Both CML 2001 and the ReCiPe methods (Figs. 5 and 6) consider the emissions in a greater number of categories and at different periods of time (10 and 20 yrs). In this method, a decrease in impact categories of ~50 % (scenarios I-III) is observed in the categories acidification, eutrophication, global warming (all of the time lapses presented), human toxicity, fresh water aquatic ecotoxicity (all of the time lapses), marine ecotoxicity infinite, terrestrial ecotoxicity (20a and infinity), marine sediment ecotoxicity (20a and infinity), fresh water sediment ecotoxicity (20a and infinity), and average European (kg of NOx and SOx). An increase greater than 8 % in Ozone layer depletion (for 10a, 20a and steady state), ionizing radiation, photochemical oxidation, malodorous air, equal benefit incremental reactivity, maximal incremental reactivity and maximal ozone incremental reactivity categories, can be seen in figure 5. The categories related to ozone layer depletion remain constant trough the scenarios. In the photochemical oxidation category, a substantial decrease was observed between scenarios I and II; however, comparing scenarios II and III, a moderate increase was detected. The behavior in the photochemical oxidation midpoint category is due to carbon monoxide emissions. Scenario III has a higher percentage of carbon monoxide emissions than scenario II.
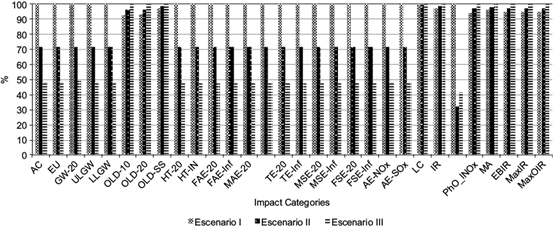
Fig. 5 Average contributions of life cycle impact assessment using CML 2001 midpoint approach for scenario I (traditional manufacturing), scenario II (one hopper-blower) and scenario III (two hopper-blower). AC: acidification, EU: eutrophication, GW-20: global warming 20 years, ULGW: upper limit of net global warming, LLGW: lower limit of net global warming, OLD-10: ozone layer depletion 10 years, OLD-20: ozone layer depletion 20 years, OLD-SS: ozone layer depletion steady state, HT-20: human toxicity 20 years, HT-IN: human toxicity infinite, FAE-20: freshwater aquatic ecotoxicity 20 years, MAE-20: marine aquatic ecotoxicity 20 years, MAE-Inf: marine aquatic ecotoxicity infinite, TE-20: terrestrial ecotoxicity 20 years, TE-Inf: terrestrial ecotoxicity infinite, MSE-20: marine sediment ecotoxicity 20 years, MSE-Inf: marine sediment ecotoxicity infinite, FSE-20: freshwater sediment ecotoxicity 20 years, FSE-Inf: freshwater sediment ecotoxicity infinite, AE-NOx: average European (kg NOx eq), AE-SOx: average European (kg SO2 Eq), LC: land competition, IR: ionizing radiation, PhO: photochemical oxidation, PhO_lNOx: photochemical oxidation (low NOx), MA: malodorous air, EBIR: equal benefit incremental reactivity, MaxIR: maximum incremental reactivity, MaxOIR: maximum ozone incremental reactivity (nomenclature in table VI)
TABLE VI NOMENCLATURE OF IMPACT CATEGORIES FOR FIGURE 5
| CML 2001 | |||
| Acidification | AC | kg SO2 eq | |
| Eutrophication | EU | kg PO4 eq | |
| Global warming 20a | GW-20 | kg CO2 eq | |
| Upper limit of net global warming | ULGW | kg CO2 eq | |
| Lower limit of net global warming | LLGW | kg CO2 eq | |
| Ozone layer depletion 10a | OLD-10 | kg CFC-11 eq | |
| Ozone layer depletion 20a | OLD-20 | kg CFC-11 eq | |
| Ozone layer depletion steady state | OLD-SS | kg CFC-11 eq | |
| Human toxicity 20a | HT-20 | kg 1,4-DB eq | |
| Human toxicity infinite | HT-IN | kg 1,4-DB eq | |
| Freshwater aquatic ecotoxicity 20a | FAE-20 | kg 1,4-DB eq | |
| Marine aquatic ecotoxicity 20a | MAE-20 | kg 1,4-DB eq | |
| Marine aquatic ecotoxicity infinite | MAE-Inf | kg 1,4-DB eq | |
| Terrestrial ecotoxicity 20a | TE-20 | kg 1,4-DB eq | |
| Terrestrial ecotoxicity infinite | TE-Inf | kg 1,4-DB eq | |
| Marine sediment ecotoxicity 20a | MSE-20 | kg 1,4-DB eq | |
| Marine sediment ecotoxicity infinite | MSE-Inf | kg 1,4-DB eq | |
| Freshwater sediment ecotoxicity 20a | FSE-20 | kg 1,4-DB eq | |
| Freshwater sediment ecotoxicity infinite | FSE-Inf | kg 1,4-DB eq | |
| Average European (kg NOx eq) | AE-NOx | kg NOx eq | |
| Average European (kg SO2-Eq) | AE-SOx | kg SO2 eq | |
| Land competition | LC | m2 area | |
| Ionising radiation | IR | DALY | |
| Photochemical oxidation | PhO | kg C2H4 eq | |
| Photochemical oxidation (low NOx) | PhO_lNOx | kg C2H4 eq | |
| Malodours air | MA | m3 air | |
| Equal benefit incremental reactivity | EBIR | kg formed O3 | |
| Maximum incremental reactivity | MaxIR | kg formed O3 | |
| Maximum ozone incremental reactivity | MaxOIR | kg formed O3 | |
CFC-11: trichlorofluoromethane, 1,4-DB: 1,4-dichlorobenzene, DALY: disability adjusted life years
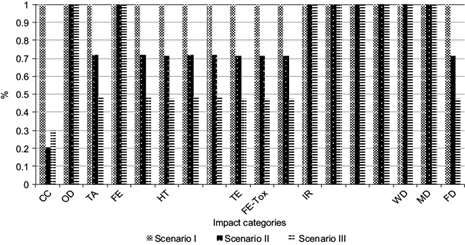
Fig. 6 Average contributions of life cycle impact assessment using ReCiPe midpoint approach for scenario I (traditional manufacturing), scenario II (one hopper-blower) and scenario III (two hopper-blower). CC: climate change, OD: ozone depletion, TA: terrestrial acidification, FE: freshwater eutrophication, Meu: marine eutrophication, HT: human toxicity, POF: photochemical oxidant formation, PMF: particulate matter formation, TE: terrestrial ecotoxicity, FE-Tox: freshwater ecotoxicity, MEc: marine ecotoxicity, IR: ionizing radiation, ALO: agricultural land occupation, ULO: urban land occupation (nomenclature in table VII)
TABLE VII NOMENCLATURE OF IMPACT CATEGORIES FOR FIGURE 6
| ReCiPe midpoint | ||
| Climate change | CC | kg CO2 eq |
| Ozone depletion | OD | kg CFC-11 eq |
| Terrestrial acidification | TA | kg SO2 eq |
| Freshwater eutrophication | FE | kg P eq |
| Marine eutrophication | Meu | kg N eq |
| Human toxicity | HT | kg 1,4-DB eq |
| Photochemical oxidant formation | POF | kg NMVOC |
| Particulate matter formation | PMF | kg PM10 eq |
| Terrestrial ecotoxicity | TE | kg 1,4-DB eq |
| Freshwater ecotoxicity | FE-Tox | kg 1,4-DB eq |
| Marine ecotoxicity | MEc | kg 1,4-DB eq |
| Ionising radiation | IR | kg U235 eq |
| Agricultural land occupation | ALO | m2 area |
| Urban land occupation | ULO | m2area |
| Natural land transformation | NLT | m2 |
| Water depletion | WD | m3 |
| Metal depletion | MD | kg Fe eq |
| Fossil depletion | FD | kg oil eq |
CFC-11: trichlorofluoromethane, 1,4-DB: 1,4-dichlorobenzene, NMVOC: non-methane volatile organic compounds, PM: particulate matter
ReCiPe. In figure 6, a significant reduction of over 50 % (scenarios I-III) is observed in terrestrial acidification, marine eutrophication, human toxicity, photochemical oxidant formation, particulate matter formation, terrestrial ecotoxicity, fresh water ecotoxicity, marine ecotoxicity, and fossil depletion. The other categories remain practically constant. The climate change category decreases 74 % when comparing scenarios I and II, while the comparison between scenario II and III shows an increase of 7 %, which is caused by the use of two HB. The ReCiPe method does not consider the CO gas in its GHG analysis, although this contributes indirectly to the greenhouse effect and also indicates incomplete combustion.
Each LCA database is developed by an organism in a specific location, and the modeled processes are based on its manufacturing characteristics (Martínez-Rocamora et al. 2016). Even when ecoinvent was developed by the Swiss Centre for Life Cycle Inventories, the present study complements this database by including more adequate inventories for Mexico.
A significantly decreasing trend was observed in most of the potential impact categories analyzed using the selected methods. The lower level of emissions arises from the inclusion of one HB device due to the improvement of the manufacturing process efficiency in firing time (Table III). According to Kumbhar et al. (2014) the highly energy-intensive process of traditional brick production needs an efficient fuel burning method to reduce the environmental impact of the production process. Additionally, it was observed that a prolonged firing time had no significant effect on the mechanical and physical properties of bricks.
TABLE VIII COMPARISON OF CO2 EMITTED BY TRADITIONAL BRICK KILNS (MEXICO) AND TUNNEL BRICK KILNS (GREECE)
| Scenario location | Chihuahua, Mexico | Tessaloniki, Greek |
| Technology | Traditional brick kiln | Tunnel brick kiln |
| Capacity (bricks per year) | 8.16 E + 05 | 1.24 E + 06 |
| Fuel type | Sawdust | Pet coke |
| kg-CO2 equivalent per brick | 1.29 | 1.20 |
TABLE IX COMPARISON OF THE CATEGORIES RELATED TO POTENTIAL POLYCHLORINATED EMISSIONS
| Technology | Unit | Chihuahua, México | Maharashtra, India | |
| Traditional brick kiln coal combustion | Traditional brick kiln sawdust combustion | |||
| Functional unit | bricks | 1000 units | ||
| Carcinogens | Pt | 6.57E + 08 | 4.65E - 08 | |
| Respiratory organics | 7.70 | 4.13E - 09 | ||
| Respiratory inorganics | 155.37 | 9.18E - 05 | ||
| Climate change | 7.52 | 4.45E - 06 | ||
| Radiation | 4.28E - 06 | 7.11E - 11 | ||
| Ozone layer | 2.40E - 07 | 2.84E - 11 | ||
| Ecotoxicity | 1.25E + 06 | 7.74E - 10 | ||
| Acidification/eutrophication | 25.20 | 2.67E - 06 | ||
| Land use | -2.77E-02 | -1.80E - 06 | ||
| Minerals | 6.68E - 06 | 7.57E - 07 | ||
Pt: points of life cycle assessment
In this study case, the GHG emissions in CO2 equivalents were calculated from the energy inputs of the various processes in the LCI and they were used as an indicator of energy use. The LCA results identified an improvement opportunity for the energy efficiency of the process by using one HB device in the clamp kiln.
It has been verified that the obtained information is relevant and reliable for the environmental impact comparison, since testing different assessment methods helps to determine the influence on data variations and the sensitivity of processes (Lopsik 2013).
CONCLUSIONS
This study assessed the environmental impacts of three clamp kiln scenarios applying an LCA. It is a contribution to the application of LCA to the environmental assessment and the improvement of traditional processes in Mexico, where the evolution of LCA has been slower than in developed countries.
The LCIA results previously discussed were found to be quite sensitive to changes in GHG emissions, which were used as an indicator of energy consumption. An improved environmental performance was achieved when one device was used, as evidenced by the decrease in emissions.
It was observed that there are residual impacts that increase by adding blowers, such as radiation, eutrophication or depletion of the ozone layer. This study identifies the importance of the life-cycle impacts by improving the environmental performance of traditional technologies, especially in countries where economic and social aspects do not allow the complete replacement or technological upgrade of these processes.
Future studies are recommended to analyze particle and NOx emissions using the HB device during the production stage, even though the firing time decreased.
The inventory information contributes to the development of the national life-cycle inventory (LCI) database and it could be applicable to others countries where the manufacturing process is similar.

