Introduction
The oil industry uses pipeline networks to transport oil through thousands of kilometers. Generally, these pipeline networks are built from steel and cast iron, which need regular inspections. These inspections are required to detect pipeline failures that can cause oil leakage with long-term and irreversible impacts in natural and human environments (Gómez & Green, 2017; Rifai, Abdalla, Razali, Ali & Faraj, 2017; Shu-Jiao, Zong-Zhi, Ru-Jun & Hao, 2016). These oil pipeline failures can be generated by corrosion, cracks, geological hazard, interference from a third party, incorrect operations and inappropriate design (Barros, 2016; Guo et al., 2016; Iqbal, Tesfamariam, Haider & Sadiq, 2016; Liang, Hu, Zhang, Guo & Lin, 2012; Mohamed, Hamdi ( Tahar, 2017; Yuhua ( Datao, 2005; Zhou, Wu, Liu, Li & Qiao, 2016). The main technique used for monitoring these types of failure includes smart pigs (Lima, Freitas, Araújo, Maitelli & Salazar, 2017; Rodríguez-Olivares et al., 2018; Sahli ( El-Sheimy, 2016). The smart pigs contain sensors mounted on a mechanical system that moves within the oil pipes. These sensors can detect cracks and corrosion on the internal surface of the pipes. However, this technique is expensive, and it is not suitable for the detection of oil pipeline damages generated by external sources such as floods, vandalism and illegal oil theft. For these cases, it is necessary to use alternative low-cost techniques that consider both the pipelines and the environment. In addition, these novel techniques require the real-time detection of oil leakage along the pipeline networks. An alternative technique for monitoring oil leakage in pipeline networks is using an unmanned aerial vehicle (UAV) with an infrared camera, which could take images of the infrared radiation related to the oil. By using a global positioning system (GPS) and communication systems, the UAV could send infrared images to a control center in real-time. For this, UAV require to keep a suitable aerodynamic stability coupled with a low drag coefficient. The aerodynamic analysis of the UAV can be done using computational fluid dynamics (CFD) and tests in wind tunnels. Several researchers (Bravo-Mosquera, Botero-Bolivar, Acevedo-Giraldo & Cerón-Muñoz, 2017; Du, Dori, Divo, Huayamave & Zhu, 2018; Jung-Ryul et al., 2015; Panagiotou, Fotiadis-Karras ( Yakinthos, 2018; Pangiotou, Kaparos, Salpingidou & Yakinthos, 2016; Panagiotou, Loannidis, Tzivinikos & Yakinthos, 2017; Raeisi ( Alighanbari, 2018; Shen, Su, Liang & Zhu, 2018; Shukla ( Komerath, 2018; Sóbester, Keane, Scanlan & Bressloff, 2005; Yang, Xue, Cai, Sun & Zhou, 2018) have developed aerodynamic studies of UAV using CFD and tests in wind tunnels; however, most of these UAV do not include the effect of an infrared camera on their outer surface. Thus, the aerodynamic analysis of a UAV with an infrared camera is presented in this research. This design could decrease the inspection costs with respect to techniques that include helicopters and light aircrafts. Furthermore, the UAV design includes winglets to achieve a stable flight during its trajectory along the pipeline network. To determine the aerodynamic parameters of the UAV, CFD models through the ANSYS software are developed. In addition, a scaled model (1:6.5) of the UAV is fabricated employing a 3D printer, which is tested using a subsonic wind tunnel. The drag and lift coefficients determined with CFD models have good agreement with respect to those measured using the subsonic wind tunnel. The winglets of the UAV allow the reduction of vortices and increase the lift force, improving the UAV stability.
This study is structured as follows: Section 2 describes the CFD modeling of the UAV; Section 3 shows the experimental setup; Section 4 depicts the results and discussion related with lift and drag coefficients of the UAV determined with the CFD models and experimental tests; and Section 5 includes the conclusions and future research.
CFD modeling
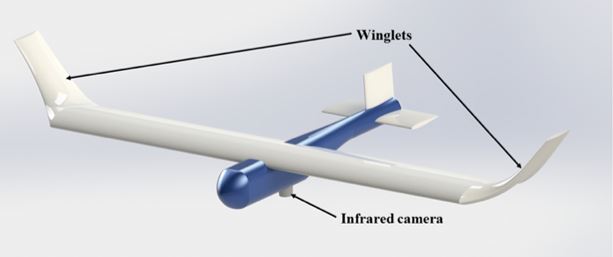
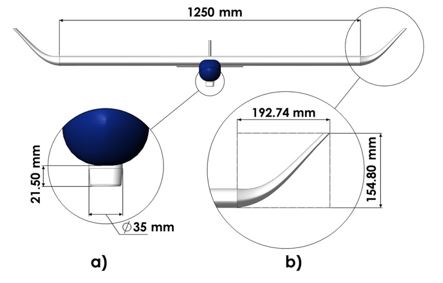
Figure 1 shows the UAV design that considers a wing (1250 mm ( 200 mm) with Eppler 748 sailplane airfoil, two winglets at the wing ends and an infrared camera. Figure 2 depicts the dimensions of the UAV, considering the infrared camera and winglets. The oil leakage in pipeline networks could cause changes in the ground temperature, altering its infrared radiation emission. A GPS and a communication system of the UAV will allow a real-time transmission of these images.
Source: Author’s own elaboration.
Figure 1 3D view of the UAV design with an infrared camera and winglets in the wing ends.
Source: Author’s own elaboration.
Figure 2 Dimensions of wing, a) infrared camera and b) winglets of the UAV.
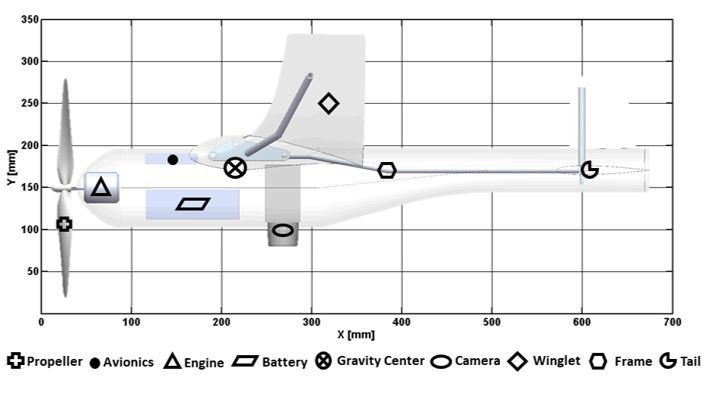
This UAV can be built using expanded polypropylene (EPP), which is light-weight and low cost (Bouix, Viot ( Lataillade, 2009; Frederick et al., 1995). Table 1 indicates the main mechanical properties of the EPP. To increase the stiffness of the UAV, an airframe is fabricated using commercial aluminum tubes with an outer diameter of 7.93 mm and thickness of 1 mm (Figure 3). The weight of the main components of the UAV airframe is described in Table 2. This data is used to estimate the gravity center of the UAV (Figure 4). The total weight of the UAV is calculated considering the payload weight (infrared camera, batteries, motors and electronic components) and empty weight (airframe). To achieve the flight of the UAV, the lift force must be higher than the total weight (21.07 N) of the UAV.
Table 1 Mechanical properties of EPP foam for different densities (Frederick et al., 1995).
| Mechanical properties | Density (kg/m3) | |||
| 20 | 44 | 60 | 80 | |
| Young’s modulus (MPa) | 75 | 215 | 320 | 470 |
| Poisson ratio | 0.00 | 0.03 | 0.04 | 0.03 |
| Yield strength (MPa) | 2.4 | 7.7 | 10.0 | 14.1 |
Source: Author’s own elaboration.
Table 2 Weight of the main components of the UAV design.
| Component | Weight (N) |
| Propeller | 0.332 |
| Avionics | 2.943 |
| Engine | 1.540 |
| Battery | 3.188 |
| Camera | 1.962 |
| Fuselage | 7.406 |
| Frame | 3.708 |
| Total | 21.07 |
Source: Author’s own elaboration.
Source: Author’s own elaboration.
Figure 4 Schematic view of the gravity center of internal components of the UAV.
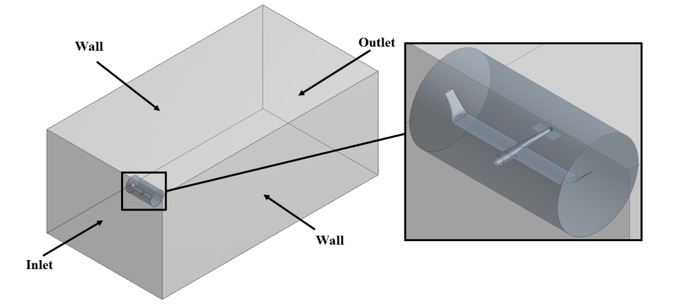
A CFD model was developed using the ANSYS®-CFX software (ANSYS Inc, 2019) to predict the aerodynamic behavior of the UAV. First, the geometry of the UAV model using a CAD software (SolidWorks®) was elaborated, as shown in Figure 5. In this CAD model, the infrared camera is considered, but the propeller of the UAV was negligible. Next, this CAD model is exported to ANSYS®-CFX software and is meshed using tetrahedral elements. For the aerodynamic analysis, a control volume of the fluid is developed. The four walls (top, bottom and sides) of the control volume and the outer surface of the UAV model are evaluated as free slip walls (ideal walls) and as no slip walls, respectively. The temperature and air pressure are determined as 25 °C and 1 atm, respectively. With these values, the numerical simulations and experimentation were conducted; however, the UAV could fly in colder or warner conditions. The changes in air temperature can affect its density, which will alter the values of the drag and lift coefficients of the UAV. The shear stress transport (SST) turbulence model is employed because it is suitable for geometries with curvature profiles and aerodynamic applications (Menter, Kuntz ( Langtry, 2003). In the CFD simulation, a steady state flow is considered. In addition, in the inlet volume is estimated a subsonic flow regime with a velocity range between 1 m/s to 26 m/s and a turbulence intensity of 5%. Also, in the outlet surface is specified a relative pressure of 0 Pa.
Source: Author’s own elaboration.
Figure 5 CAD geometry and boundary conditions of the UAV CFD model.
The SST model contained in ANSYS-CFX software is based on the turbulence model reported by Menter (1993) (Bardina, Huang ( Coakley, 1997; Menter, Carregal-Ferreira, Esch & Konno, 2003; Menter et al., 2003). This SST model employs the best elements of the k − ε turbulence model and k − ω turbulence model by means of a blending function F1. This function has as value of 1 near the wall surface and 0 in the free shear flows and outer part. With these magnitudes of F1, in the near-wall surface is activated the k − ω model; conversely, for the rest of the flow is employed the k − ε model. Thus, the SST model uses the two-equation of the k − ω model near the wall surface and the k − ε model in the rest of the flow. The SST model is suitable for aeronautics flows with high adverse pressure gradients and separation. The SST model uses equations for the turbulent kinetic energy (k) and the turbulence frequency (ω), which can be determined by (Menter et al., 2003):
with
where t is the time; μ is the fluid viscosity; ρ is the fluid density; k is the turbulent kinetic energy; xi is the space coordinate component; i, α, σk, β, β* and σω are model constants; ω is the turbulence frequency; Ui is the mean flow velocity component in the xi coordinate direction; v is the kinematic viscosity; S is the magnitude of the mean vorticity; and y is the distance to the nearest wall surface.
The turbulent eddy viscosity (μt) is given by:
where a1 is a constant and F2 is a second blending function.
The SST model coefficients α, β, σk and σω, described with the symbol φ, are indicated by blending the coefficients of the original k − ω model, named as φ1, through those of the converted k − ε model, called as φ2:
The constants used in the SST model are: β * = 0.09, α1 = 5/9, β 1 = 3/40, σk1 = 0.85, σω1 = 0.5, α2 = 0.44, β 2 = 0.0828, σk2 = 1, and σω2 = 0.856 (Menter et al., 2003).
For the mesh of the UAV CFD model, it is necessary to calculate the distance between the first layer of the mesh and the UAV outer surface. This distance (Δs) is given by (Schlichting ( Garsten, 2017):
where y + is a dimensionless parameter that depends on the turbulence model and U * is the fluid velocity when it has contact with the UAV geometry.
Based on equation (11), a fine mesh is implemented around the first layers of the outer surface of the UAV. The characteristic length (Lc) of the UAV can be calculated using a rectangular section (a width and b thickness) (Cengel, 2014:
The shear stress around the UAV outer surface can be estimated as (Schlichting ( Garsten, 2017):
where U is the fluid velocity, C f is the friction coefficient of the UAV outer surface and Re is the Reynolds number.
The fluid velocity (U * ) around the UAV outer surface is obtained as (Schlichting ( Garsten, 2017):
The magnitude of y+ can be calculated by (Menter et al., 2003):
Experimental setup
Experimental measurements of the lift and drag coefficients of the UAV are developed using a TecQuipment AF100 open circuit subsonic wind tunnel (Figure 6). This tunnel has a test section with dimensions of 0.30 m ( 0.30 m ( 0.60 m.
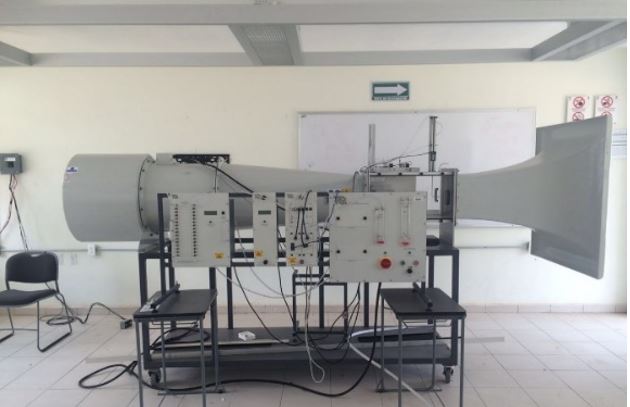
Source: Author’s own elaboration.
Figure 6 TecQuipment AF100 subsonic wind tunnel used in the aerodynamic test of the 3D UAV model.
This tunnel has an aerodynamic balance that measures the lift and drag forces. For the experimental test, the UAV wing is scaled from 1.635 m to 0.25 m using a 3D printer. This 3D UAV model is supported through a circular bar with 12.7 mm diameter and 200 mm length. Thus, the UAV is connected to the aerodynamic balance of the aerodynamic tunnel (Figure 7).
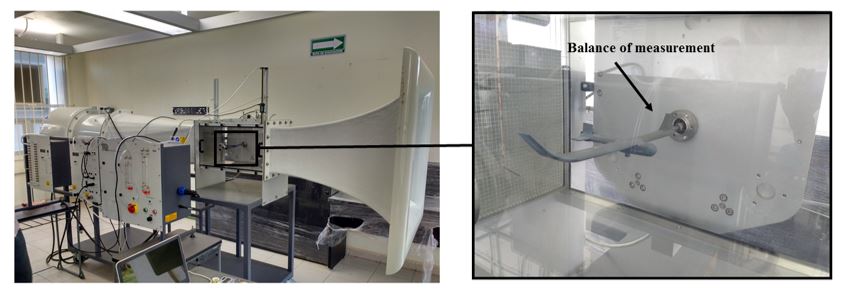
Source: Author’s own elaboration.
Figure 7 3D UAV model used in the TecQuipment AF100 subsonic wind tunnel.
In the experimental test, a similitude criterion is used to obtain the velocities relation between the 3D UAV model and UAV CFD model. For this criterion, the 3D UAV model and UAV CFD model have equal Reynolds number. Table 3 shows the velocities relations between the 3D UAV model and UAV CFD model (Munson, Okishi, Rothmayer & Huebsch, 2009). The maximum velocity that can be reached in the wind tunnel test chamber is 36 m/s. This velocity in the model corresponds to approximately 5.5 m/s in the real-size prototype.
Table 3 Velocities’ relations between the 3D UAV model and UAV CFD model.
| Prototype velocity (m/s) | Model velocity (m/s) |
| 4.0 | 26.1 |
| 4.5 | 29.3 |
| 5.0 | 32.6 |
| 5.5 | 35.8 |
Source: Author’s own elaboration.
where Vm, μm, ρm, lm, V, μ, ρ and l are the velocity, dynamic viscosity, density and characteristic length in the model, and prototype, respectively.
Results and discussion
In the UAV CFD simulations, an air velocity range that goes from 1 m/s to 26 m/s (Reynolds number from 27759 to 721741) is considered, keeping an angle of attack (AoA) of 0°. Figures 8 (a-b) depict the drag coefficient and drag force of the UAV CFD model as function of its Reynold number. The drag forces have an important increment when the velocity increases, while the drag coefficient decreases under the same conditions. The maximum values of the drag coefficient and drag force are 0.0234 N and 7.56 N, respectively, with wind velocities of 26 m/s (Re = 721741).
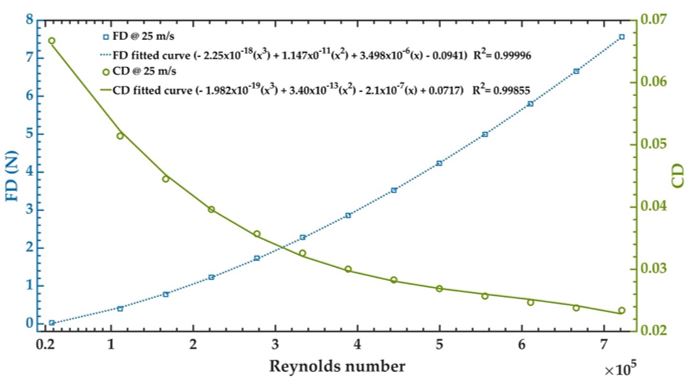
Source: Author’s own elaboration.
Figure 8 Drag force and drag coefficient of the UAV CFD model vs. its Reynolds number.
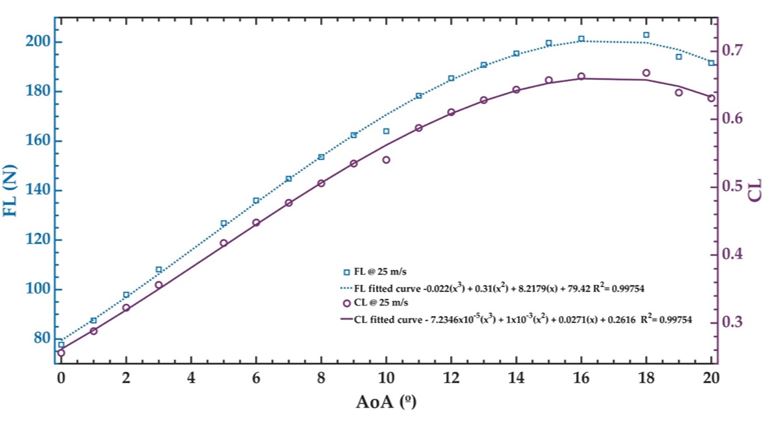
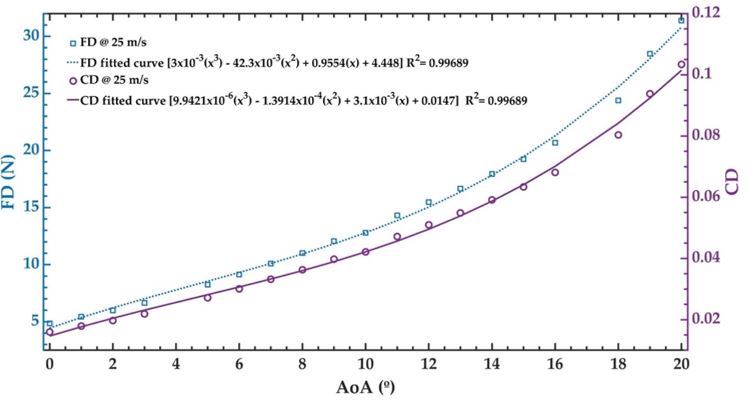
Apart from that, the force and lift coefficient increase as the wind velocity increases (Figure 9). The maximum values of the coefficient and lift force are 0.2294 N and 68.93 N, respectively, with wind speed of 26 m/s (Re = 721741). In other UAV CFD simulations, the AoA is changed between 0° and 20°, keeping a constant inlet velocity of 26 m/s. Figure 10 depicts the lift force and lift coefficient of the UAV as a function of AoA. Lift force and lift coefficient increases when AoA varies between 0° and 18°. Thus, the maximum value (203 N) of the lift force and lift coefficient (0.6684) is achieved with AoA of 18° and decay for AoA higher than 18°. However, these values are decreased for AoA higher than 18°. Figure 11 shows the drag force and drag coefficient as a function of AoA. The values of these aerodynamic parameters are increased when the AoA of the vehicle is incremented.
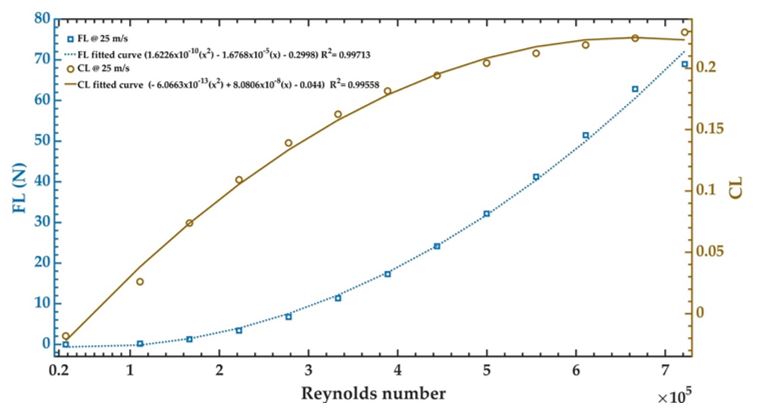
Source: Author’s own elaboration.
Figure 9 Lift force and lift coefficient of the UAV CFD model vs. its Reynolds number.
Source: Author’s own elaboration.
Figure 10 Lift force and lift coefficient of the UAV CFD model vs. AoA.
Source: Author’s own elaboration.
Figure 11 Drag force and drag coefficient of the UAV CFD model vs. AoA.
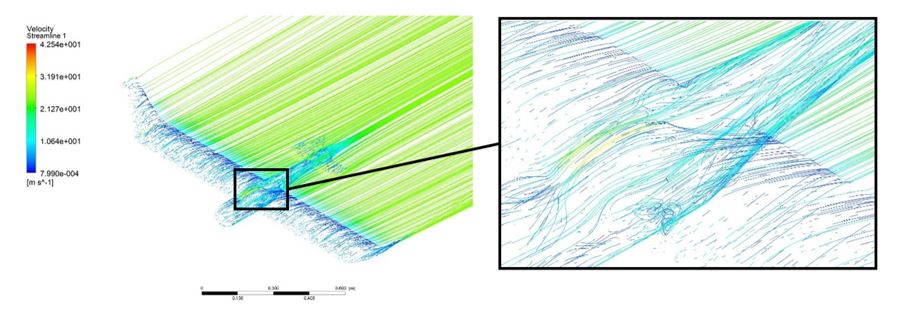
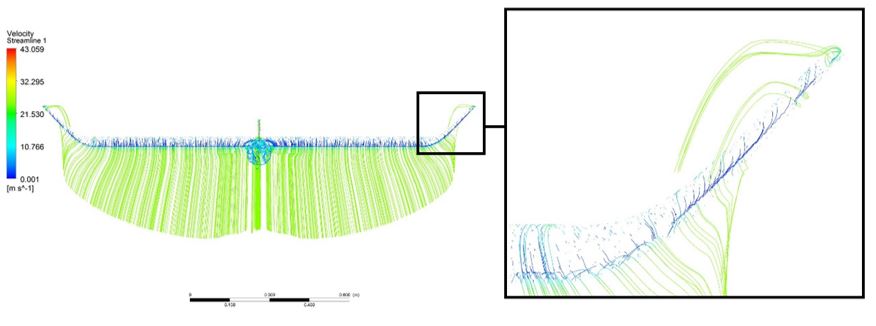
Figure 12 and 13 show the air velocity profile about the surface of the UAV CFD model. For this aerodynamic design, the UAV registers a uniform velocity profile. Moreover, the winglets allow the reduction of air turbulence at the wing ends.
Source: Author’s own elaboration.
Figure 12 Air velocity profile about the surface of the UAV CFD model.
Source: Author’s own elaboration.
Figure 13 Air velocity profile around the winglets of the UAV CFD model.
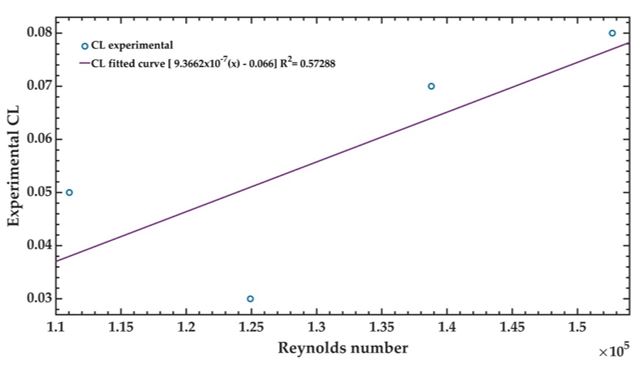
Figures 14 shows the experimental response of the lift coefficients of the 3D UAV model. The experimental values of the lift coefficients increment when the Reynolds number increases. The maximum and minimum magnitudes of the lift coefficients are 0.08 and 0.003, respectively. On the other hand, Figure 15 illustrates the experimental results of the drag coefficients of the 3D UAV model. The maximum and minimum values of the drag coefficients are 0.050 and 0.040, respectively. The drag coefficients obtained with the UAV CFD model have a similar response in comparison with those measured using the wind tunnel. Nevertheless, the lift coefficients of the UAV CFD model registered magnitudes smaller than those measured through the wind tunnel.
Source: Author’s own elaboration.
Figure 14 Experimental lift coefficient of the 3D UAV model using the TecQuipment AF100 subsonic wind tunnel.
Conclusions
An aerodynamic analysis of an UAV model with Eppler 748 sailplane airfoil (wingspan of 1.635 m) was presented. This UAV model includes an infrared camera to detect oil leakage in pipeline networks caused by geological hazard and interference from third party. UAV CFD simulations through the ANSYS-CFX® software were developed to predict the lift and drag coefficients as functions of the Reynolds number and angles of attack (AoA). For an inlet velocity of 26 m/s, the maximum magnitude (0.668) of the lift coefficient of the UAV model was achieved with AoA of 18°. The lift coefficient of the UAV model increased when AoA varied from 0° to 18°. For this AoA, the drag coefficient of the UAV model registered a value of 0.080. The values of the lift coefficient decay for AoA higher than 18°. A scale model (1:6.5) of the UAV was fabricated using a 3D printer. In addition, the lift and drag coefficients were measured through a subsonic wind tunnel. For AoA of 0°, the drag coefficients obtained using the UAV CFD simulations for Reynolds number between 1.11 ( 105 and 1.527 ( 105 have an approximately similar behavior compared with experimental results.
The designed UAV has a suitable aerodynamic behavior that could allow its implementation for low-cost inspections of oil pipelines. The UAV could include a small infrared camera, a GPS and a communication system for real-time transmission of the infrared images related to oil leakage. The infrared camera could be located at the bottom surface of the UAV. This camera could identify by infrared radiation the oil leakages in pipelines caused by geological hazard and interference from third party. The proposed UAV could detect pipeline sections with high risks and recognize the potential failures sources. This UAV could reduce the inspection costs compared to other conventional aircrafts such as helicopters or light aircrafts.


 nueva página del texto (beta)


