Introduction
The average annual concentration of PM2.5 particles in the world’s most polluted cities is nearly 20 times higher than that found in the world’s cleanest city, exceeding 100 μg m-3 (Liang & Gong, 2020; Liu et al., 2019). In recent years, air pollution generated by particulate matter with a diameter less than 2.5 micrometers (PM2.5) has attracted much public and scientific attention due to its considerable health impacts and its relationship with atmospheric radiation, cloud formation, atmospheric photochemical reactions, and light extinction effects. These factors collectively contribute to global climate change. Increased urban activities such as transportation, fossil fuel combustion, manufacturing, entertainment, and recreation result in significant pollutant emissions. Particulate matter is continuously released into the atmosphere due to household emissions, fossil fuel consumption, and road traffic (Amnuaylojaroen et al., 2020). Reportedly, urban ecosystems globally contribute to about 78% of the carbon emissions and air pollutants, affecting the health of more than half of the world’s urban population (Liang & Gong, 2020; Piracha & Chaudhary, 2022). In peri-urban areas -or forest-urban interface- characterized by a combination of residential, productive, recreational, and other uses, the risk of wildfire looms large (Ayala-Carrillo et al., 2022).
Some studies have indicated that PM2.5 exhibits varied multi-scale, short-term, and long-term responses to meteorological factors under different circumstances (Fu et al., 2020). Wildfires are an important source of particulate matter that affects air quality in cities (Carbajal et al., 2015; Yu et al., 2022) and are closely linked to meteorological conditions. In the city of Guanajuato, characterized by a semi-warm and temperate climate type, wildfires typically occur during dry periods, and the warm periods occur in March, April, and May (Barret & Esquivel, 2013; Farfán et al., 2021; Pérez-Verdin et al., 2013). The extent and intensity of a wildfire are directly influenced by vegetation types, weather conditions, and the amount of fuel consumed per unit of the area (Ning et al., 2022; Petrie et al., 2022).
The concentration of PM2.5 can vary due to a range of factors, including land use, population density, urban activity, wildfire, atmospheric chemical reactions, and meteorological conditions. It is known that meteorological conditions are the main driving factors for pollutant accumulation, dispersion, and elimination (Zhang et al., 2022a).
Temperature, precipitation, and wind speed are generally considered the primary meteorological factors affecting air pollutant concentrations in urban areas. Precipitation plays a main role in the wet removal of atmospheric pollutants, representing one of the most important mechanisms in atmospheric self-purification (Zhou et al., 2021). Wind also aids in the dry removal of particulate matter, influenced by geographical location, topography, and climatic conditions. Local emissions can contribute to air pollution, which may then be transported to other areas by prevailing winds, thus influencing the concentration of particles in different regions (Liu et al., 2020). Relative humidity (RH), another meteorological variable, has been found to have minor impacts on increasing PM2.5 concentrations. However, it is suggested that fluctuations in RH exhibit a stronger correlation with PM2.5 concentration. Increasing RH promotes the growth of fine particles in the atmosphere, potentially leading to a sudden surge in PM2.5 accumulation (Yang et al., 2017).
To date, studies on pollutant concentration and dynamics as well as their drivers have predominantly focused on industrial cities. However, little is known about this issue in non-industrial cities, such as tourist and historical settlements (Zhang et al., 2022b).
Our research aims to investigate the effect of meteorological parameters on particle pollution, and the possible contribution of wildfires to PM2.5 concentration. To achieve this, we have chosen the historical tourist city of Guanajuato, Mexico, as the study area. Guanajuato is a significant city with numerous cultural heritage sites that could be affected by air quality and atmospheric deposition. Additionally, the historical mining activity in Guanajuato, spanning from the Hispanic colonial era to the present, adds another noteworthy aspect to our study.
Materials and methods
Study area
The city of Guanajuato is in the central-western area of the state of Guanajuato, Mexico. It boasts a population of 194 500 inhabitants and covers an area of 996.74 km2, equivalent to 3.28% of the state’s total land area (Figure 1b and Figure 1c). The vegetation of the central-west area consists of temperate and tropical forests, xerophilous scrub, and natural grassland. The central area of the state lies at an approximate elevation of 2020 meters above sea level (m. a. s. l.), with its mountainous and rugged terrain located at the coordinates 21° 01′ 4″ N and 101° 15′ 24″ W (Arenas-Monroy et al., 2012; Asch, 2009; Farfán et al., 2021; Woitrin-Bibot et al., 2015).
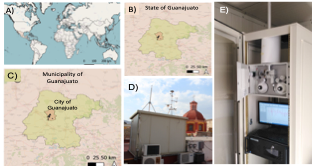
Note. The black dots indicate the population centers in the territory of the municipality. In the center is the downtown area of the city, to the south is the community of Santa Teresa and Puentecillas and to the south southeast is the community of La Sauceda.
Source: Author’s own elaboration.
Figure 1 a) Location of the state of Guanajuato in Mexico (state of Guanajuato in green), b) Location of the Guanajuato municipality within the state of Guanajuato (in orange), c) Guanajuato city within the municipality of Guanajuato (in gray), d) Location of the monitoring station, and e) Sampling equipment.
The mining of minerals in Guanajuato traces back to the arrival of the Spaniards in the region and the subjugation of its indigenous peoples. The Valenciana Mine, established in 1557, holds the distinction of being the city's first and most renowned mining site, setting the stage for mining operations in the area. However, over the years, mining has undergone periods of both boom and decline, such as the one that occurred at the end of the twentieth century, which led to the development of tourism as an emerging economic activity to counteract the consequent effects of unemployment in the mining industry (Bustamante, 2013; Sánchez, 2019).
The city of Guanajuato developed due to the discovery of a geological configuration rich in minerals, the mining of which greatly contributed to its architectural composition (Martínez-Arredondo, 2015). A system of tunnels, constructed underneath the city to relieve frequent flooding, is connected to an underground roadway, built-in 1964 on a vaulted river, that runs from one extreme to another. This historical, emblematic landmark enables greater urban mobility and speeds up the transport and transfer of goods to the city center. The commercial and service activities conducted in the city are the principal sources of pollution (Puy-Alquiza et al., 2016; Zamorategui-Molina et al., 2021). As a tourist destination, the demand for improved infrastructure for the provision of related services has generated higher demand for electricity, fuel, and shopping centers, and it has required the expansion of the city’s road network, given that, currently, there are approximately 80 000 vehicles circulating in the city (Asch, 2009; Sánchez, 2019). However, the covid-19 pandemic that arrived in Mexico and Guanajuato state in February 2020 suspended many activities, including Guanajuato city, but the decrease in vehicle flow does not reflect a reduction in PM2.5 concentration. The vegetation type in the state of Guanajuato ranges from grasslands and scrub in the north and northwest arid region, tropical deciduous forest and subtropical scrub in the southern lowlands, and temperate forests in the mountain ranges (Arenas-Monroy et al., 2012; Farfán et al., 2021).
Mexico has established national ambient air quality standards for both short-term and long-term exposure to PM2.5. The short-term standard corresponds to a maximum of 45 μg m-3 PM2.5 concentration on average over a 24-hour period, while the long-term standard corresponds to an annual mean PM2.5 concentration of 12 μg m-3 (NOM-025-SSA1-2014) (Diario Oficial de la Federación [DOF], 2014). These standards apply to all the thirty-one states that comprise Mexico country (Figure 1a), including the state of Guanajuato (Figure 1b) and, thus, Guanajuato city (Figure 1c).
Data collection
A Met One BAM-1020 device was used for continuous PM2.5 sampling, with data recorded hourly via beta attenuation measurement (BAM) (Gobeli et al., 2008; Nakamura et al., 2022). This device, designated by the US EPA as a Federal Equivalent Method (FEM) for the collection of PM2.5, has its calibration method and a full description detailed in its operation manual1 . Monthly, seasonal, and yearly averages were calculated with at least 75% of the recorded data. Stations for monitoring PM2.5 and meteorological parameters are placed at a height of 15 meters above ground level on the roof of a building located in the center of the city of Guanajuato at the coordinates 21° 01′ 4.04″ N and 101° 015′ 26.61″ W (Figure 1d). The BAM and data logger are in a cabin inside the monitoring station to protect it from weather (Figure 1e).
The meteorological parameters (temperature, precipitation, relative humidity [RH], wind speed [WS], and direction [WD]) were measured using a Vantage Pro weather station (Davis Instruments, Hayward, CA, USA) from January 2016 to December 2020. The station recorded real-time data every hour, every day of the year, and in accordance to the NOM-172-SEMARNAT-2023 (DOF, 2023); more than 75% of the records were considered for validation. Once collected, the meteorological parameters were averaged over 24 hours and used to calculate monthly and yearly averages. Two seasonal cycles were then selected, corresponding to the monthly averages for April to September (spring-summer) and October to March (autumn-winter).
Data analysis
Wind direction was analyzed using wind rose plots developed with WRPLOT View 8.0.2 © 1998-2016 Lakes Environmental software (Suárez-Salas et al., 2017). Anderson-Darling normality tests were applied to the data of the averages of the variables, resulting in a parametric statistic with a normal distribution for the PM2.5 concentration, temperature, and WS. Fischer's least significant difference (LSD - Fisher) analysis was conducted to identify the significant effect of each meteorological variable on the PM2.5 concentration. The correlation between the explanatory meteorological variables was examined and a Spearman’s correlation coefficient matrix was calculated using the software Minitab 17. Annual, seasonal, and monthly correlograms were calculated, compared, and visually assessed, as were the coefficients of each pair of variables.
The land cover and vegetation types for the municipality of the city can be found in the land cover map available at the Subsystem of Geographic Information, Environment, Territorial, and Urban Planning (SEBIO-GTO, 2022).
Results and discussion
Annual variations in PM2.5 concentration, temperature, precipitation, RH, and WS, from 2016 to 2020, in the city of Guanajuato
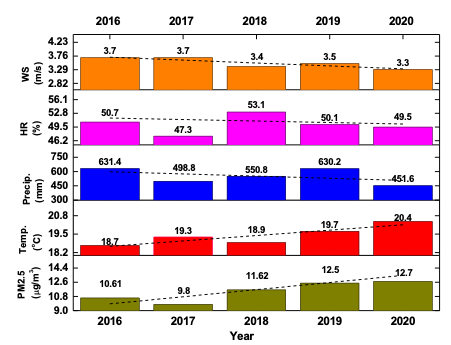
The classification PM2.5 refers to particles with an aerodynamic diameter of less than or equal to 2.5 μm (Yu et al., 2019). The annual mean concentrations of PM2.5 ranged from 9.80 μg m-3 to 12.7 μg m-3, with a tendency to increase, as shown in the dashed line (Figure 2); while the averages for 2016, 2017, and 2018 were below the maximum allowed limit (12 μg m-3), with concentrations of 10.61 μg m-3, 9.80 μg m-3, and 11.62 μg m-3, respectively. For the warmer years, 2019 and 2020, the averages were observed to be above the maximum allowable limit, with 12.5 μg m-3 and 12.7 μg m-3, respectively. As can be seen, the PM2.5 concentration and temperature registered in 2017 were lower and higher, respectively, than the PM2.5 concentration and temperature recorded in 2016 and 2018. This relationship between PM2.5 concentration and temperature can be attributed to both the wildfires that occurred in this period and the long-distance particulate wind transportation driven by meteorological conditions (Amnuaylojaroen et al., 2020; Farfán et al., 2021). Figure 9 shows the wildfires attended and registered by the National Forestry Commission (Conafor, from its Spanish acronym) and does not show the forest fires developed in the forest-urban interface that are not attended by Conafor and therefore are not registered (Ayala-Carrillo et al., 2022; Conafor, 2021).
Source: Author’s own elaboration.
Figure 2 Annual average PM2.5 concentration, temperature, precipitation, relative humidity, and wind speed, from 2016 to 2020.
Source: Author’s own elaboration.
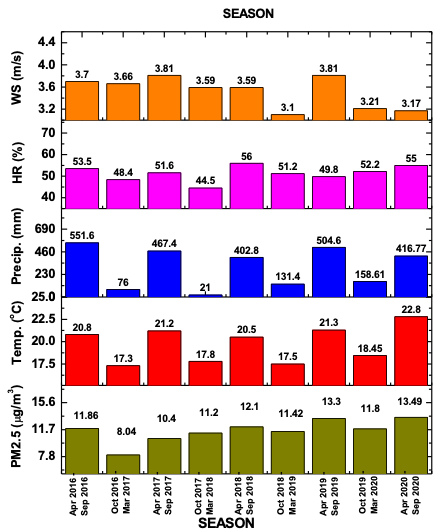
Figure 4 Seasonal average PM2.5 concentration, temperature, precipitation, relative humidity, and wind speed for the seasonal cycles, from 2016 to 2020.
Source: Author’s own elaboration.
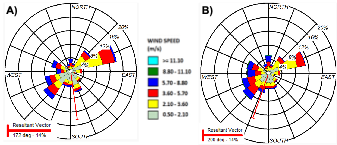
Figure 5 Wind roses: a) First seasonal cycle and b) Second seasonal cycle for 2016-2020.
Source: Author’s own elaboration.
Figure 6 Monthly average PM2.5 concentration, temperature, precipitation, RH, and WS, from 2016 to 2020.
Source: Author’s own elaboration.
Figure 7 Wind roses: a) May 2016-2020, b) May 2026, and c) May 2020.
Source: Author’s own elaboration.
Figure 8 Spearman correlation coefficient for pairs of independent variables: a) Annual, b) Seasonal cycle, and c) Monthly.

Source: Author’s own elaboration.
Figure 9 Fischer's least significant difference (LSD - Fisher): a) Annual, b) Seasonal, and c) Monthly.
The Spearman correlation for these two variables showed a positive association, with a factor of 0.7; and as shown in the dashed line, the temperature has a positive effect on PM2.5 concentration in the city of Guanajuato. It can be said that the average PM2.5 concentration for the years 2016 to 2020 has a direct relationship with the increase in temperature, that is, the higher the annual mean temperature, the higher the mean PM2.5 concentration (Figure 2). Research conducted in some cities with cold winters has reported increases in particulate pollution due to the burning of fossil fuels for heating, indicating that the climate, as defined by the meteorological conditions of each region, is a determining factor that influences the level of pollution recorded (Wang et al., 2014).
Regarding precipitation for the study period, we recorded a maximum of 631.4 mm in 2016 and a minimum of 451.6 mm in 2020, showing a tendency to decrease over time as observed in the dashed line. This is consistent with the historical records, given that the average annual precipitation reported from 1981-2010 by the National Meteorological Service of Mexico was 712.1 mm (INEGI, 2014). Therefore, it can be inferred that low precipitation was observed during the study period. In 2016, the maximum rainfall value was registered along with a higher PM2.5 concentration than that recorded in 2017, while the low rainfall (498.8 mm) recorded in 2017 coincided with the lowest PM2.5 concentration observed during the study period. However, an increase in rainfall was recorded from 2017 to 2019, coinciding with an increased PM2.5 concentration. Finally, the minimum level of rainfall, 451.6 mm, registered in 2020, was 72% lower than the 630.2 mm registered for 2019, a finding which concurs with other research conducted on the influence of precipitation on PM2.5 levels in the air. It has been reported that precipitation facilitates particle drag, thereby cleaning the atmosphere by reducing particle concentration in the air (Liu et al., 2020; Wang & Ogawa, 2015; Xu et al., 2018; Zhao et al., 2020).
The Spearman correlation factor determined between annual average precipitation and PM2.5 concentration shows a small negative value (-0.3), indicating a low association between the two variables on an annual basis. This result can be attributed to the seasonality of rainfall in the city of Guanajuato, mainly occurring between the months of July and September; this implies that the annual average precipitation does not have a significant effect on the annual average PM2.5 concentration.
Previous studies that have focused on evaluating the relationship between PM2.5 concentration and RH have found a positive relationship between low temperature and high RH in winter (Pacsi & Murriel, 2018), while average RH has been reported to have little effect on increased PM2.5 concentration but a strong association with RH fluctuations (Yang et al., 2017). Moreover, there is a direct correlation with warmer seasons, wherein PM2.5 emissions generated by wildfires occur under conditions of high temperatures and low RH (Requia et al., 2019). Additionally, some studies, conducted in a city environment with busy traffic, report a positive relationship between PM2.5 concentration and RH due to poor fuel quality, while the inverse relationship between PM2.5 concentration and RH is associated with proximity to industrial zones outside the city (Zalakeviciute et al., 2018).
Figure 2 shows the annual average RH and PM2.5 concentration from 2016 to 2020. RH ranges from a minimum of 47.3% in 2017 to a maximum of 53.1% in 2018. A direct relationship between both variables can be identified for 2016 and 2018, which concurs with previous research conducted in cities with busy traffic, which found an increase in PM2.5 concentration due to a high RH. However, from 2018 to 2020, an inverse relationship was observed, wherein PM2.5 concentration increased, RH decreased, and temperature increased. This tendency can be attributed to the PM2.5 generated by wildfires on the outskirts of the city. As has been established, RH has an inverse relationship with air temperature, as observed in Figure 2.
The Spearman correlation factor determined between these two variables corresponded to a value of 0.20, indicating a low positive association. Only in the 2016-2018 period was a direct association between PM2.5 concentration and RH found, with contrasting results obtained for the 2018-2020 period. As previously reported, average RH does not have an appreciable impact on increased PM2.5 concentration (Yang et al., 2017), thus requiring that variations in this variable be analyzed over shorter periods.
The annual WS average was recorded at 3.7 m s-1 in 2016 and 3.3 m s-1 in 2020 (Figure 2), showing a tendency to decrease between these years, while the annual average PM2.5 concentration tended to increase over the same period, presenting an inversely proportional relationship between the variables. Lower PM2.5 concentrations were registered in 2016 and 2017, years in which the WS reached 3.7 m s-1, higher values than those registered for 2018 and 2020 (3.5 m s-1 and 3.2 m s-1, respectively). Thus, the highest PM2.5 concentration recorded in 2020 was inversely correlated with a lower wind speed of 3.2 m s-1, with a Spearman correlation factor that corresponded to a negative value of -0.87. This finding indicates a highly significant inverse relationship between the annual average values for WS and PM2.5 concentration, concurring with the results obtained by other research that reported an inversely proportional relationship between these two variables on an annual basis (Cichowicz et al., 2020; Zhang et al., 2018).
Annual wind rose
Figure 3a shows the behavior of the dominant winds and the resulting vector of the study period from 2016 to 2020. As can be seen, the resulting vector in the direction 168o towards the south southeast of the period 2016-2020 is within the limits between the vector resulting from 2016 in the direction 178o towards the south (Figure 3b) and the vector resulting from 2020 in the direction 128o towards the southeast (Figure 3c). Furthermore, 12% of the dominant winds recorded in the study period coincide with 17% of the dominant winds in 2016 and only 6% in 2020 in an east-northeast direction.
Another important coincidence for the study period and 2016 is the dominant winds that go in a southeast direction with 9% and in a south-southwest direction with approximately 8% of the winds for 2020 (Figure 3c). Other wind directions such as those observed towards the north in Figures 3a, 3b, and 3c are very homogeneous among themselves, covering 360° of the cardinal points. This behavior shows that the pollution generated around the city can affect its air quality by increasing the concentration of PM2.5 particles.
On the other hand, most of the dominant winds in the 2016-2020 study period are classified as moderate winds with speeds between 4.0 m/s and 7.0 m/s, and approximately 1% is considered strong winds with speeds greater than 8.0 m/s, favoring a better dispersion of air pollution.
Seasonal cycle variations in PM2.5 concentration, temperature, precipitation, RH, and WS, from 2016 to 2020, in the city of Guanajuato
Two cycles were established for the seasonal analysis conducted by this study: the first corresponding to April to September (spring-summer) and the second to October to March (autumn-winter). Figure 4 shows the PM2.5 concentration and temperature averages for the two seasonal cycles, which both showed a significant increase from 2016 to 2020. The average seasonal PM2.5 concentrations ranged from 8.04 μg m-3 to 13.49 μg m-3, while the average seasonal temperature ranged from 17.3 °C to 22.8 °C. The maximum seasonal averages for PM2.5 concentration and temperature were recorded in the first seasonal cycle (spring-summer), while the minimum averages were recorded in the second (autumn-winter). The Spearman correlation factor for the seasonal averages for PM2.5 concentration and temperature revealed a highly significant positive value of 0.72, indicating a direct relationship.
Research conducted in other cities has found an inverse relationship between the variables PM2.5 and temperature (Pacsi & Murriel, 2018; Yang et al., 2017). As discussed above, low temperatures, which are associated with increased RH and low WS, favor the formation and stagnation of PM2.5 particulate matter. However, we found a larger effect of wildfires, topography, and geographical location on air quality for the city of Guanajuato compared with other large cities. In general, air pollution in large cities is claimed to be driven by traffic.
Rainfall in the city of Guanajuato occurs from May to August (Barrett & Esquivel, 2013). The maximum seasonal averages for both rainfall and PM2.5 concentrations were recorded in the first seasonal cycle (April to September), while the minimum seasonal averages were observed in the second seasonal cycle (October to March). In 2017, a lower PM2.5 concentration of 10.4 μg m-3 was observed in the first seasonal cycle, while a higher concentration of 11.2 μg m-3 was registered in the second seasonal cycle.
The maximum averages for PM2.5 concentration recorded in the first seasonal cycle are attributed to wildfires occurring in the dry months of March, April, and May (Farfán et al., 2020), before the rainy season which occurs from May to August (Barrett & Esquivel, 2013).
The dragging effect of rain on particles is observed in the second seasonal cycle (Tian et al., 2021a), with the minimum seasonal PM2.5 concentration averages recorded (Figure 4). The correlation factor between average seasonal precipitation and PM2.5 concentration shows a positive value of 0.55, indicating a moderate seasonal relationship. This correlation can be attributed to the minimum seasonal PM2.5 concentration averages registered in the second seasonal cycle, during which wildfires were mitigated by the rainy season. Additionally, both the wet deposition of PM2.5 facilitated by the rain and the effect of RH became more significant (Lou et al., 2017; Wang et al., 2019).
Figure 4 presents the variation in seasonal RH averages and their relationship with PM2.5 concentration. The maximum RH average occurred in the first seasonal cycle (April-September), except for 2019, when the minimum RH (RH = 49%) was registered in the same cycle. This finding coincides with the high temperatures and rainfall registered in the first seasonal cycle. The Spearman correlation factor determined a value of 0.55, indicating a moderate positive association between the two variables.
While RH has a minor impact on increased PM2.5 concentration, the fluctuations in RH correlate strongly with increased PM2.5 concentration (Yang et al., 2017). In addition, it has been reported that very dry conditions -with RH < 45%- or dry conditions -with RH = 45-60%- exert a cumulative effect on PM2.5 concentration (Lou et al., 2017). This finding concurs with the results obtained by the present study, from 2016 to 2020, during the dry period, in which seasonal RH averages ranged from 45% to 56%, thus facilitating the increased seasonal average for PM2.5 concentration. Furthermore, the minimum seasonal RH average recorded for the first seasonal cycle of 2017 is attributed to variations in temperature and WS, both of which have an inverse relationship with RH, which increases on days with calm atmospheric conditions (low wind speeds and low temperatures) (Ravi & D’Odorico, 2005).
As the narrow diameter of PM2.5 particles facilitates their diffusion and dilution in the air, PM2.5 concentration gradually decreases with increasing WS (Li et al., 2019). In addition, the speed and direction of the wind, as conditioned by local topography and geography, affect PM2.5 concentration in an area (Cichowicz et al., 2020; Liu et al., 2020). As can be seen in Figure 3, the average seasonal WS recorded by the present study ranged from 3.1 m s-1 to 3.81 m s-1. In the first seasonal period, the maximum average WS coincided with the maximum average PM2.5 concentration, except for the first seasonal cycle of 2017. The opposite occurred in the second seasonal period, during which minimum values were recorded for both variables. The seasonal behavior of WS revealed by the present study does not concur, in most cases, with that reported by other researchers who have found an inverse relationship between these two variables. In conditions of high WS, PM2.5 particles are easily blown away and dispersed, resulting in decreased concentration.
The seasonal Spearman correlation coefficient obtained by the present study (-0.17) for PM2.5 concentration and for WS evidences a low inverse association between the two variables. This low correlation can be attributed to the wildfires occurring in the periods with the highest temperatures and the dry season from March to May (Barrett & Esquivel, 2013; Farfán et al., 2021), during which the maximum seasonal averages for PM2.5 concentrations were recorded. Winds drag PM2.5 particles to various locations depending on the wind direction, thus impacting the air quality of the city of Guanajuato. The inverse effect of WS on PM2.5 concentration was observed during the first seasonal cycle of 2017, during which the average seasonal WS (3.8 m s-1) and average seasonal PM2.5 concentration (10.4 μg m-3) were, respectively, higher and lower than those registered during the first seasonal cycles of 2016, 2018, 2019, and 2020.
Seasonal wind rose
Similar behaviors are observed for the first and second seasonal cycles in all directions: 14% and 11% in the east-northeast direction, 10% and 9% in the southwest direction, and 8% in the west-southwest direction for both cycles (Figure 5). Other wind directions with lower percentages cover 360° in the wind roses of the two seasonal cycles. This behavior of winds in all directions promotes the dispersion of PM2.5 in the city from different external points. Furthermore, based on wind speeds, these are classified as moderate winds with predominant speeds between 4.0 m/s and 7.0 m/s, promoting good dispersion of particles and avoiding stagnation of pollution in the city of Guanajuato.
Monthly analysis of PM2.5 concentration, temperature, precipitation, RH, and WS
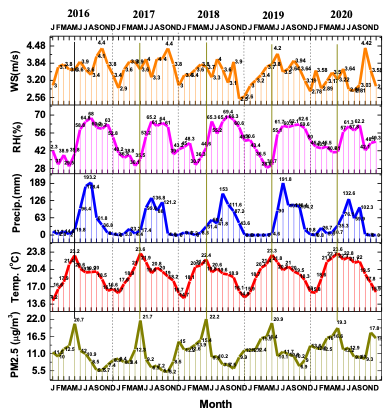
The monthly average variations in PM2.5 concentration, temperature, precipitation, RH, and WS are shown in Figure 6. The monthly average variation in PM2.5 concentration ranged from 22.2 μg m-3 to 5.2 μg m-3. As can be seen, the maximum average PM2.5 concentration coincided with the maximum average temperature in May. In contrast, the minimum monthly average PM2.5 concentration registered in October did not coincide with the minimum monthly average temperature registered in either December or January, from 2016 to 2020.
A constant increase in PM2.5 concentration was observed in October, reaching a maximum peak in December due to increased PM2.5 emissions caused by the use of fireworks during Christmas and New Year celebrations. By February, the PM2.5 concentrations decreased, reaching a minimum peak, coinciding with the beginning of a rise in temperatures during the summer.
The Spearman correlation factor was determined for PM2.5 and temperature, giving a value of 0.31, which indicates a weak positive correlation and agrees with the results obtained. Other studies conducted in large industrial cities with high levels of vehicle traffic have found that the highest concentrations of PM2.5 are recorded during months with lower temperatures or in winter (Fu et al., 2020; Tian et al., 2021b; Yang et al., 2017). However, the present study found a different relationship between these two variables in Guanajuato, a small city of almost 20 000 inhabitants with moderate to warm temperatures. The maximum PM2.5 concentrations registered in May can be attributed to the emissions generated by the wildfires occurring during periods of drought and high temperatures (Petrie et al., 2022). The low PM2.5 concentrations registered in October can be attributed to the combined effects of rain and WS, which promote the wet deposition and dispersion of particles, respectively (Figure 6).
The annual period of rainfall began in May and ended in September in most of the years included in the present study (Figure 6). In 2016 and 2018, the maximum rainfall was recorded in July, corresponding to 193.2 mm and 153 mm, respectively. In 2017, 2019, and 2020, the maximum rainfall, corresponding to 136.8 m/s, 191.8 m/s, and 132.6 mm, respectively, was recorded in August. As can be seen, the minimum average monthly rainfall was registered in 2020, during which year the lowest annual average of 451.6 mm was also registered (Figure 2).
The cleaning effect exerted on the air during the rainy period (May-September), discussed above, is clearly observed in the decrease in PM2.5 concentration every October from 2016 to 2020. As can be seen, the maximum PM2.5 concentration was registered in May, coinciding with the end of the drought period and the beginning of the rainy period. PM2.5 concentration then began to decrease in June and fell to minimum levels by October of each analyzed year, by which time rainfall had decreased considerably or had almost ceased completely. By the end of the rainy season, PM2.5 concentration starts to increase, independent of the decrease in temperature.
The highest PM2.5 concentration was recorded in October 2020, under conditions of low precipitation. In 2016, 2017, 2018, and 2020, rains that occurred in February or March coincided with a slight decrease in PM2.5 concentration, a decrease was not observed in 2019 when no rain was recorded in either February or March. These results are in line with those reported in other studies, which have found that the intensity of precipitation is related to the efficiency of particle removal, with increased precipitation, improving the wet deposition process. Additionally, long periods of precipitation favor the removal of particles larger than 2.2 µm (Zalakeviciute et al., 2018; Zhou et al., 2020). The Spearman correlation factor (-0.42) calculated shows a moderate inverse correlation between the monthly average precipitation and the monthly average PM2.5 concentration.
In areas with less vehicle traffic, RH presents an inverse relationship with PM2.5 concentration (Zalakeviciute et al., 2018). Conditions with higher RH cause the PM2.5 particles to increase in size and, consequently, fall more easily, thus decreasing their concentration in the air (Wang & Ogawa, 2015). In addition, RH increases with lower temperatures and higher winds (Zakaria et al., 2020). Figure 6 shows the maximum RH values from July to November, which coincides with the rainy period and maximum WS. The minimum RH values were recorded in March, April, and May when higher temperatures and minimum WS were recorded (Figure 6). The monthly analysis of RH and PM2.5 concentration reveals a negative correlation factor of -0.48, indicating a moderate inverse relationship, a finding which contrasts with studies carried out in Chinese cities, where the highest PM2.5 concentrations are recorded in winter when low temperatures cause increased demand for residential heating and, consequently, a higher level of particle emissions (Han et al., 2020; Xu et al., 2018). Additionally, the source of PM2.5 differs from one place to another, depending on geographical location and topography as well as the nature of the activities carried out within it. In the city of Guanajuato, a warm climate prevails along with moderate temperatures, meaning that it is not necessary to use heating in winter and, therefore, the highest PM2.5 concentrations are recorded in the warmest months (March, April, and May) and coincide with the minimum RH recorded.
The ventilation effect generated by wind disperses particles, while high WS diminish PM2.5 concentration (Cichowicz et al., 2020; Zhang et al., 2018). Figure 6 shows the variation in the monthly average PM2.5 concentration and WS, with the maximum average WS coinciding with the minimum average PM2.5 concentrations registered in October. Average WS were recorded at a maximum of 4.4 m s-1 in October 2016, 2017, and 2020 and a minimum of 2.5 m s-1 in November 2018. The lowest WS were registered in November, December, and January, coinciding with the period of lower temperatures (Figure 6). The Spearman correlation factor calculated (-0.30) shows a low inversely proportional relationship, which is consistent with the maximum PM2.5 concentrations recorded in May along with average WS of approximately 3.6 m s-1.
Higher PM2.5 concentrations and higher temperatures coincide with the period during which wildfires are common in the city of Guanajuato. Wildfires are an important source of particle emissions during periods of high temperatures, low RH, and low rainfall (Bravo et al., 2002; Tzompa-Sosa et al., 2016). Moreover, particles are transported by wind over long distances (Cruz-Núñez & Bulnes-Aquino, 2019).
Monthly wind rose
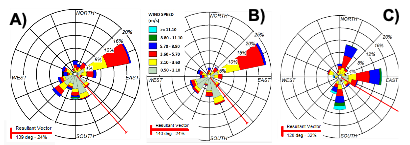
Figure 7 shows the wind rose for May for the study period: a) 2016-2020, b) 2016, and c) 2020. As can be seen, the flags corresponding to May 2016 and 2020 (Figures 7b and 7c) are integrated into the wind rose for the period 2016-2020 (Figure 7a) with a resulting vector in a southeast direction with 24%. In general, the dominant winds for May 2016 go in the direction of the east-northeast with 23% and to the southeast direction with 13%. The same behavior is observed for the same month of 2020 with winds that go to the east with 14%, north-northeast, and toward the south with 13%. This behavior of dominant wind shows that the polluting emissions generated in the grassland area located in the west would disperse towards the center of the city, and the moderate winds with average speeds of 3.0 m/s would promote a good dispersion of PM2.5, preventing its stagnation in the city of Guanajuato.
Correlation matrix and Fischer's least significant difference (LSD-Fisher) from 2016 to 2020
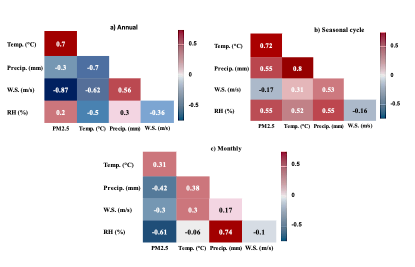
Figure 8 shows the correlation matrix of the Spearman factors of pairs of independent variables for different periods: a) annual, b) seasonal, and c) monthly (short time). As mentioned above, the annual correlation of temperature and PM2.5 concentration was positive (0.6), decreasing to 0.285 in a monthly period. The same behavior is observed with WS but with an annual negative correlation of -0.616, which diminished to -0.32 in monthly analysis. Thus, the correlation of precipitation and RH against PM2.5 concentration varies depending on the period in which the analysis is carried out. For the seasonal analysis, rain shows a positive correlation of 0.55 because the rainy months coincide with the seasonal cycle of maximum PM2.5 concentrations, and its drag effects are observed in the following seasonal cycle, where low PM2.5 concentrations are rerecorded in months with low rainfall. Short-time analysis shows a better correlation between rainfall and relative humidity. This is observed in the monthly matrix for these two variables (0.74).
Fisher's least significant difference (LSD-Fisher) analysis is shown in Figure 9. The letters A, B, C, D, E, F, and G represent the groupings of the means. Differences between means that share a letter are not statistically significant, and differences that do not share a letter are statistically significant. Letter A represents the mean that is significantly higher than letter B, much higher than letter C, and so on. The annual variability of PM2.5 concentration does not show a statistically significant difference between 2019 and 2020. These years have a significantly higher mean (A) than 2018 and 2017, which are represented by the letter B. In addition, 2017 and 2016 share a much lower mean (C). This is due to the annual increase in the concentration of PM2.5. For each variable, the same letter on each horizontal line does not differ significantly at a 0.05 probability level (p > 0.05) (Figure 9a). The temperature shows a significant variation in 2020 indicated by the letter A, which is not repeated in other horizontal lines. This maximum temperature agrees very well with the highest concentration of PM2.5 recorded for the same year. Average annual precipitation behaved the same for all the studied years with no significant variation (A). Despite this, RH and WS showed no significant differences, with the last years having higher values (A) and the first years having the lowest values (B).
Figure 9b shows a significant difference between the two seasonal cycles, spring-summer (SS) and autumn-winter (AW). The SS cycle records the maximums, while the AW cycle records the minimums for the variables studied; these results were consistent with the rainy months of the SS cycle and the least rainy of the AW cycle.
The monthly means shown in Figure 9c demonstrate significant differences in the concentration of PM2.5 and temperature in May. This coincides with the months of the year with the greatest drought, which favors the development of wildfires in the region. For precipitation, RH, and WS there is no significant difference for some months. As can be seen in Figure 9c, the maximum rainfall occurs in July, August, and September (A); the RH registers the highest percentages in the rainy months from June to October (A); and finally, the maximum WS records are generated in the months of April, June, and October (A). As discussed, the maximum concentration of PM2.5 is directly related to the temperature and inversely related to precipitation, relative humidity, and wind speed.
Wildfires in the state of Guanajuato and around the city of Guanajuato (Municipality)
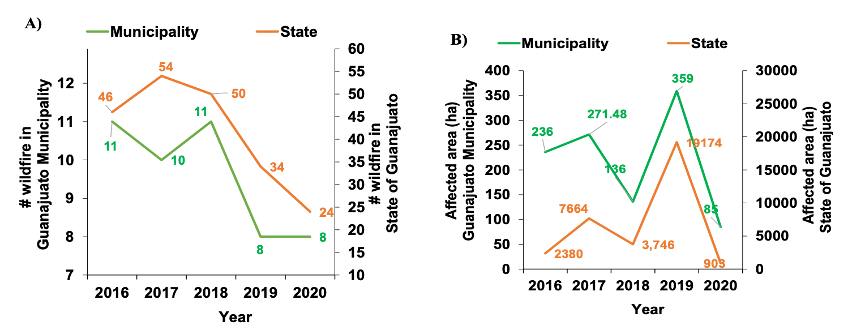
Most of the wildfires occurring in the study area are related to climate anomalies and human activities, including agriculture, livestock, and housing, as well as negligent management of smoking and bonfires (Cruz-Núñez & Bulnes-Aquino, 2019; Galván & Magaña, 2020). Wildfires tend to occur during periods of high temperature and dry climates, and the affected area depends on the vegetation type, the amount of time required to extinguish the fire, site accessibility, and the availability of resources (Farfán et al., 2021; Pérez-Verdin et al., 2013). In 2016 and 2018, eleven wildfires were registered in the municipality around the city, while nine were registered in 2017, eight in 2019, and eight in 2020 (Figure 10a) (Conafor, 2021).
Source: Author’s own elaboration.
Figure 10 a) Wildfires and b) Affected areas by wildfires in both the state and municipality of Guanajuato.
The Wildland-Urban Interface implies wildfire risks, and the estimated burned area for 2019 was 444.66 ha, while 198.95 ha were reported for 2020 (Ayala-Carrillo et al., 2022), greater than those reported by Conafor derived from the wildfire attended in the municipality in 2019 (359 ha) and 2020 (85 ha) (Figure 10b).
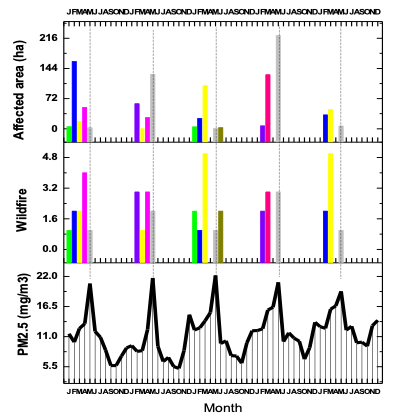
Figure 10 shows the annual variation in wildfires in both the state and municipality of Guanajuato, with the number of fires decreasing in 2020 due to the covid-19 pandemic, during which people were confined to their homes. However, 2019 registered the largest area affected, increasing the PM2.5 pollution in the municipality, despite the lower number of wildfires (Figure 10b). The maximum average temperature of 24.7 °C was registered in 2020, when fewer wildfires were generated, resulting in the smallest affected area (85 ha) for the years included in the analysis in the municipality. This extraordinary situation is attributed to the effect of the covid-19 pandemic, as the residents of the city of Guanajuato were advised to remain at home to avoid exposure to the virus. In 2019, wildfires often occurred in difficult-to-access areas, causing long response times and consuming more forest or grassland (Carbajal et al., 2015). As shown in Figure 11, wildfires occurring in the first months of each year coincide with the maximum monthly averages for PM2.5 concentration, while the number of fires does not match the maximum average temperatures recorded in the month of May each year. This is because most wildfires are entropically generated, covering large, burned areas in the Wildland-Urban Interface, and are not reported by local firefighters (Ayala-Carrillo et al., 2022).
Source: Author’s own elaboration.
Figure 11 Wildfires and affected areas in the municipality of Guanajuato plotted against the monthly average PM2.5 concentration in the city of Guanajuato.
Figures 12a and 12b show the wildfire distribution from 2016 to 2020 and the type of vegetation in the municipality of Guanajuato, respectively. The state map reveals a higher incidence of wildfires in the southern part of the city (Figure 12a). The distribution of wildfires within the municipality of Guanajuato is homogeneous, and PM2.5 emissions generated in any part of the municipality can reach the city. The vegetation around the city of Guanajuato ranges from oak forest, coniferous forest, and deciduous tropical forest in the north and east region; subtropical scrub in the south; xerophytic scrub, grassland, and agriculture in the southern lowlands and southwest (Figure 12b) (Arenas-Monroy et al., 2012; Farfán et al., 2020). As mentioned previously, a high amount of PM2.5 present in the city of Guanajuato can be generated by wildfires occurring around the city in the dry season.
Conclusions
We examined the impact of meteorological variables and dry seasonal months on PM2.5 concentration. Meteorological conditions, such as temperature, precipitation, RH, and WS, are crucial factors influencing the fluctuations in PM2.5 concentrations in non-industrial cities.
The analysis conducted on the relationship between PM2.5 concentration, air temperature, and dry seasonal months showed a positive correlation across all three time periods considered (annual, seasonal, and monthly). This was further supported by Fisher's least significant difference analysis, which showed significant differences in the concentration of PM2.5 and air temperature in May. It was observed that wildfires occurring during the initial months of the year (January, February, March, and April) might contribute to the increase in PM2.5 concentration recorded in May and its decreases in the rainy season. Although PM2.5 concentration shows a resurgence in December, it remains lower than that observed during the driest months when forest fires are more prevalent around the city.
The timing of the rains showed a variable correlation with the concentration of PM2.5, and its effect was more evident in the monthly analysis, where an inverse relationship was observed based on Spearman’s factor; thus, rain drags air pollution, reducing the concentration of PM2.5. When the RH is low, the concentration of PM2.5 increases, and the increase in RH in the rainy period decreases the concentration of PM2.5. The number of particles is reduced due to the increase in their size, generated by the increase in humidity.
WS negatively affects the concentration of PM2.5, observing that the maximum averages in wind speed corresponded very well with the minimum concentration recorded in the month of October. The weak monthly correlation obtained can be attributed to the effect of the other variables on the concentration of PM2.5. The windiest months of the year were April, June, and October, with no significant difference compared to the other months.
Conflict of interest
The authors did not receive support from any organization for the submitted work. No conflict of interest.


 nueva página del texto (beta)


