INTRODUCTION
Seagrass meadows are highly productive marine ecosystems with high benthic macrofaunal density and diversity (Duffy, 2006; Fredriksen et al., 2010; Heck et al., 2003). Benthic faunal assemblages in seagrass beds are not uniform but are influenced by many environmental and biological factors that change across space and time (Ávila et al., 2015; Barnes & Ellwood, 2012; Perez et al., 2009; Pillay et al., 2010). Among the factors that have been suggested to exert a significant influence on seagrass macrofauna are chemical factors, such as salinity (Yamada et al., 2007), physical factors, such as wind disturbance, current velocity or exposure to waves (Ávila et al., 2015; Turner et al., 1999), and biological factors, such as habitat complexity, predation, and species composition (De Troch et al., 2001; Heck et al., 2006; Leopardas et al., 2014). Despite their important ecological role, seagrass meadows are among the most vulnerable habitats of coastal and estuarine ecosystems. Conservation efforts are insufficient to stop their rapid decline resulting from natural and anthropogenic activities (Duarte, 2002; Lotze et al., 2006; Short et al., 2011; Waycott et al., 2009), which, in turn, affects the density and diversity of the associated biota (Pillay et al., 2010).
There are many tropical seagrass meadows in the Gulf of Mexico (Espinoza-Avalos, 1996; Short et al., 2007; Van Tussenbroek et al., 2014). Los Petenes Biosphere Reserve (LPBR) is located along the coast of Campeche, México which harbors a seagrass meadow that extends up to 25 km offshore and more than 80 km through the coast. This seagrass meadow has not natural protection barriers, except the shallow marine floor. Three seagrass species comprise the submerged aquatic vegetation (SAV) of the LPBR, Halodule wrightii Ascherson, Syringodium filiforme Kützing and Thalassia testudinum Koenig, as well as many macroalgae species such as Caulerpa sp. and Halimeda sp. Penicillus sp. and Udotea sp. (Espinoza-Avalos, 1996; Fuentes et al., 2014). It is one of the largest and best-conserved seagrass habitats. However, the benthic macrofauna of this important tropical seagrass meadow is poorly known. There are some studies on the enclosed water body Laguna de Terminos (LT), located 150 km south of the LPBR. In LT, Ávila et al., (2015) found a benthic macrofauna community with high abundance and species richness, dominated by gastropods and bivalves. The benthic macrofaunal community structure of LT is highly influenced by the degree of protection against the wind-driven waves (Ávila et al., 2015). In the same lagoon, Solis-Weiss & Carreño (1985) and Cruz-Ábrego et al., (1994) found a high diversity of benthic macrofauna dominated by crustaceans and polychaetes, related to the distance of the sampling site to the connection of the lagoon with the open sea. Although the dominant macrofaunal groups differ among the mentioned studies, the assemblages seem to be related to similar factors associated with the distance to the open sea.
Considering that the seagrass meadow of the LPBR is located in a shallow open sea (from <0.5 to 11 m of depth) with a more considerable extension than the LT, we hypothesized that the distribution pattern of the benthic macrofaunal assemblages is related to the offshore gradient of environmental and biological variables. The aims of this study were: (1) to describe the macrobenthic community structure at the taxonomic level of classes into the seagrass meadow of the LPBR, and (2) to assess the relationship of the macrobenthic community structure (composition and density) with the environmental and biological variables that change from nearshore to offshore.
MATERIALS AND METHODS
Study area. The study area was the seagrass meadow of LPBR, located on the coast of Campeche, in the southern Gulf of Mexico (Fig. 1a). The sampling was carried out in December 2013 by SCUBA-diving along three transects parallel to the coastline (TA, TB, and TC; Fig. 1b). TA was traced along the longitudinal axis of 90.50°W with a distance of 0.2 to 1.4 km from the coast, TB was traced along 90.58°W at 8.4 km distance from TA, and TC along 90.66°W at 8.4 km distance from TB. Along each transect, four equidistant sampling stations were established, resulting in a total of twelve sampling stations. The resulting polygon covered approximately half of the LPBR marine area (Fig. 1b).
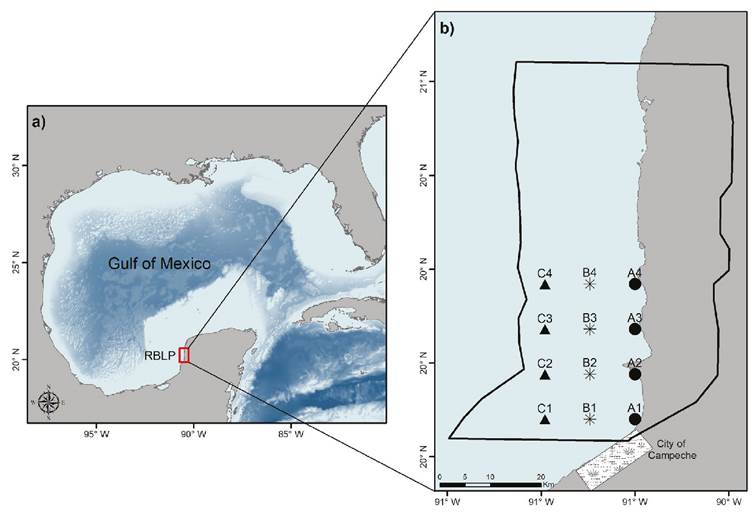
Figures 1a-b a) Location of Los Petenes Biosphere Reserve (LPBR) at the southeastern coast of the Gulf of Mexico; b) Transects (A, B and C) with four sampling stations each. Rectangle represents the San Francisco de Campeche city, Campeche, México. The Polygon in 1b), corresponds to the limits of LBBR.
Biological and environmental data collection. Benthic macrofauna was sampled using a stainless-steel core of 21 cm diameter x 42 cm depth (surface area of 0.03 m2). At each sampling station, three replicate sediment samples were taken. Sediments of the upper 20 cm were sieved through a sieve of 1mm mesh size, and macrofauna was immediately sorted and preserved in 70% ethanol for posterior identification and counting. SAV was sampled with the same core; samples were washed with seawater to clean the surface from sediment and epiphytic organisms. After that, SAV was stored in labeled plastic bags and conserved on ice until the analysis. Additionally, sediment samples were collected with transparent acrylic cores (3.6 cm inner diameter, 20 cm depth) and keep it in a freezer (-18 °C) until organic carbon and granulometry analysis were performed. Another sediment core sample was used for interstitial water extraction by centrifugation, and nitrate and phosphate concentration were measured.
Measurements of water salinity, temperature, pH and dissolved oxygen were made 50 cm above the SAV at each sampling site using a multiparameter probe (YSI 555MPS; YSI Inc., Yellow Springs, OH, USA). Water samples were collected 50 cm above the seagrass using a Van Dorn-type bottle. Nitrate, as well as phosphate concentrations (measured as reactive soluble phosphate), were quantified in water column samples reported as µmol L-1 (Strickland & Parson, 1972).
At laboratory, benthic organisms were washed and identified to Class level according to specialized literature: Polychaeta (De León-González et al., 2009), Bivalvia and Gastropoda (Ekdale, 1974; García-Cubas, 1981; Pérez-Rodríguez, 1980), Malacostraca (Abele & Kim, 1986; Winfield et al., 2007), Asteroidea, Echinoidea, Holothuroidea and Ophiuroidea (Bravo-Tzompantzi et al., 2000). Identified organisms were counted and reported as average density ± standard deviation, i.e., the total number of individuals per square meter (indv. m-2) for each taxonomic category.
The organic content analysis in sediments was measured by titration (Gaudette et al., 1974). The granulometric analysis was achieved by dry sieving with different mesh sizes, and the average particle diameter was calculated (McManus, 1988). Vegetation was identified and separated by species (Hartog & Kuo, 2006). The aerial and subterranean sections of each species were separated to be dried at 60 °C during 72 h and weighed on an analytical balance (Radwag, USA ± 0.001 g). The biomass ± standard deviation of each seagrass species was calculated (g of dry weight m-2).
Data analysis. To examine the spatial distribution of benthic density, It was plotted the average density of total organisms per site, using the Ocean Data View software (Schlitzer, 2016). The contribution of each taxonomic Class to the total density was calculated and plotted using the software SIGMA PLOT (Jandel Scientific Software, San Rafael, CA, USA). To evaluate the community structure of macrobenthic assemblages, macrofaunal density data were statistically analyzed using the PRIMER 6 software (Clarke & Gorley, 2006; Field et al., 1982). A non-metric multidimensional scaling (NMDS) plot was constructed to represent data similarities as distances between points in a low dimensional space. The NMDS plot was based on the Bray-Curtis similarity resemblance matrices. Macrofaunal density data were square root transformed to down-weight the contribution from quantitatively dominant macrofauna Classes (Clarke, 1993). Analysis of similarities (ANOSIM) was applied to test spatial differences among macrobenthic assemblages. Two factors were tested, spatial variation between inshore to offshore transects (TA, TB, and TC) and between latitudinal stations (1, 2, 3 and 4). The contribution of each taxonomic Class to similarities within groups and dissimilarities between groups were explored using the similarity percentages routine (SIMPER).
Principal component analysis (PCA) was performed to determine the importance of the environmental variables characterizing the habitat: T. testudinum biomass, S. filiforme biomass, algae biomass, percentage of organic carbon in sediment, sediment particle diameter, water temperature, salinity, depth, and nitrate and phosphate in the water column and in the sediment (interstitial water). The PCA was made using Euclidean distance matrices on normalized data, which was performed using the PRIMER v6 software package. The ANOSIM was used to analyze the spatial differences as in biological data.
The relationship between biological and environmental variables with the community composition of benthic macrofauna was determined by (1) a BIOENV analysis, which selects the best combination of variables that explain the biological variability, and by (2) a RELATE Analysis, which evaluates the Pearson correlation between the environmental similarity matrix of the most important variables and the biological matrix of all specimens.
Moreover, to visualize which environmental variable showed the relation with macrofaunal density, a one-to-one graphical relation and correlation were run for each biological and environmental variable against the total density of benthic macrofauna. The plotted data were then fitted to different mathematical models using the Marquardt-Levenberg algorithm included in the SIGMAPLOT software (Jandel Scientific Software, San Rafael, CA, USA).
RESULTS
Benthic macrofaunal density and community structure. The total density values of benthic macrofauna in the seagrass meadow of LPBR were heterogeneous. As shown in figure 2a, the highest average densities were concentrated along TB in the middle of the study area (1991.6±378.3 indv. m-2), followed by TC (1741. 7±391.9 indv. m-2) and TA (1544.4±582.9 indv. m-2). As indicated by the high standard deviations of the average macrofaunal density of each transect, there was high variability among sites. Site A1 had the lowest average total density of all sites (966±100 indv. m-2) and C4 the highest average total density (2222.2±252.4 indv. m-2) (Fig. 2a).
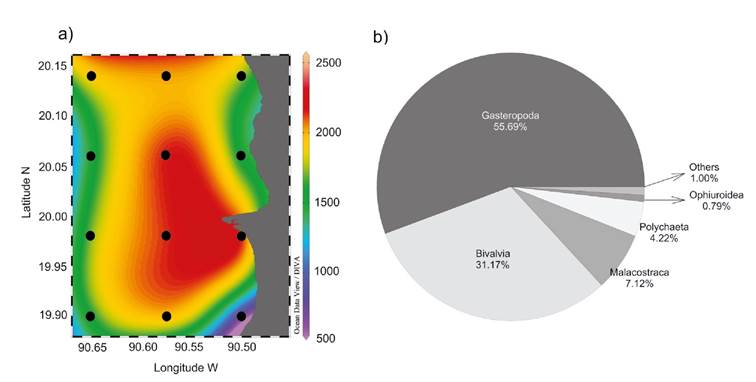
Figures 2a-b a) Average density of benthic macrofauna (indv. m-2); b) Average percentage contribution of taxonomic Classes to the total macrofauna density collected in Los Petenes Biosphere Reserve (Campeche, México).
Benthic macrofauna was composed by 10 taxonomic Classes, ~99% was represented by five Classes with different percent of contribution to the total density: 55.69% Gastropoda (977.77±448.13 indv. m-2), 31.17% Bivalvia (547.22±326.63 indv. m-2), 7.12% Malacostraca (125.00±120.15 indv. m-2), 4.22% Polychaeta (74.07±124.50 indv. m-2), and 0.79% Ophiuroidea (13.88±25.66 indv. m-2). The remaining ~1.01% was composed of 0.47% Sipunculidea (8.33±21.64 indv. m-2), 0.21% Holothuroidea (3.73±13.28 indv. m-2), 0.21 % Asteroidea (3.70±13.28 indv. m-2), 0.05 % Echinoidea (0.92±5.55 indv. m-2) and 0.05% Polyplacophora (0.92±5.55 indv. m-2) (Fig. 2b).
NMDS analysis revealed a community structure commensurate with the spatial distribution of inshore to offshore transect (Fig. 3). All sites of TC were separated from TA and TB stations, whereas the sites belonging to TA and TB showed a discrete spatial separation, except A1 site. The faunal differences among transects were significant, as confirmed by the ANOSIM test (ρ=0.617, p=0.001; Table 1). The macrofaunal composition was significantly different, even latitudinally, ANOSIM test (ρ=0.466, p=0.001). However, variation was given mainly by stations near to the Campeche city, since these were different from the rest of stations (Table 1).
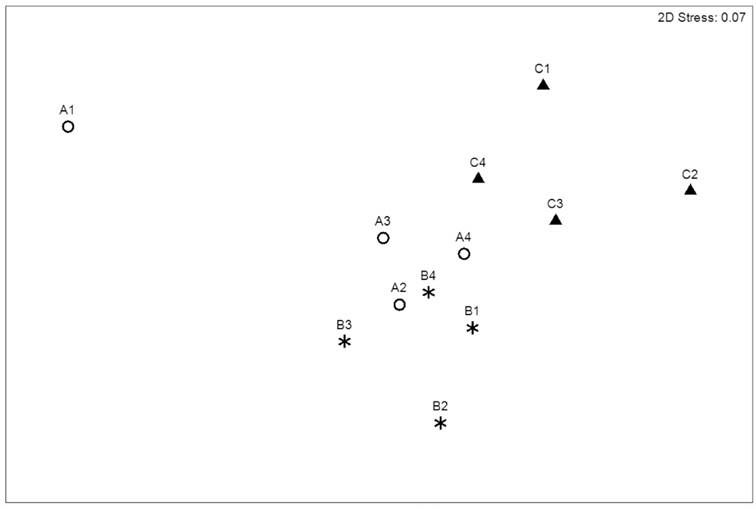
Figure 3 Non-metric multidimensional scaling (NMDS) based on benthic macrofaunal abundance in Los Petenes Biosphere Reserve (Campeche, México).
Table 1 ANOSIM based on the Bray-Curtis similarity matrix of benthic macroinvertebrate abundances among inshore to offshore transects.
| P | P | |
| Global Inshore-offshore transects | 0.617 | 0.001 |
| TA vs TB | 0.546 | 0.003 |
| TA vs TC | 0.5 | 0.008 |
| TB vs TC | 0.843 | 0.001 |
| Global Latitudinal Stations | 0.466 | 0.001 |
| S1, S2 | 0.506 | 0.01 |
| S1, S3 | 0.568 | 0.006 |
| S1, S4 | 0.543 | 0.005 |
| S2, S3 | 0.358 | 0.04 |
| S2, S4 | 0.272 | 0.08 |
| S3, S4 | 0.235 | 0.08 |
(TA = transect A; TB = transect B, TC = transect C) and latitudinal stations in the seagrass meadow of LPBR (S1 = stations 1; S2= stations 2, S3= stations 3, S4= stations 4). ρ = sample statistic; p = Significance level of sample statistic.
The heterogeneity of the community structure was reflected in the spatial distribution of the five most abundant Classes. Gastropoda were numerically dominant along TB (Fig. 4a), Bivalvia were numerically dominant in deepest stations (TC) (Fig. 4b), Malacostraca were more abundant near the coast (TA) (Fig. 4c), Polychaeta densities were highest at deep stations (Fig. 4d), and Ophiuroidea were distributed in TB and TC stations (Fig. 4e). Holothuroidea was found only along the most distant to the coast transect (TC), and only adult individuals were found.
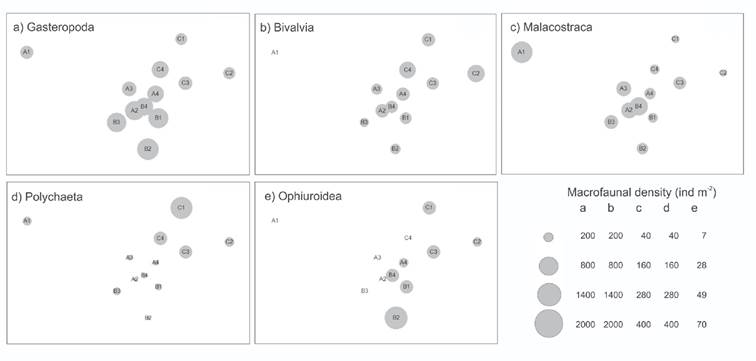
Figures 4a-e Densities of the five dominant Classes of benthic macrofauna superimposed on the NMDS. a) Gasteropoda; b) Bivalvia; c) Malacostraca; d) Polychaeta; e) Ophiuroidea in Los Petenes Biosphere Reserve (Campeche, México).
Gastropoda and Bivalvia were the most important invertebrates defining the community structure. The SIMPER analysis revealed that Gastropoda and Bivalvia contributed most to the similarity within TA (56.67% and 23.15%, respectively) and also within TB (Gastropoda 51.83%, Bivalvia 28.06%) (Table 2). TC was also characterized mainly by Bivalvia (40.08%) and Gastropoda (36.11%) (Table 2).
Table 2 Similarity results of the SIMPER test based on benthic macrofaunal abundances of different transects.
| Av. Sim | Sim/SD | Cont. % | Cum% | |
| TA (Av. Sim = 72.26) | ||||
| Gastropoda | 40.95 | 9.77 | 56.67 | 56.67 |
| Bivalvia | 16.73 | 1.05 | 23.15 | 79.82 |
| Malacostraca | 10.10 | 0.88 | 13.98 | 93.80 |
| TB (Av. Sim = 83.27) | ||||
| Gastropoda | 43.16 | 10.31 | 51.83 | 51.83 |
| Bivalvia | 23.36 | 9.23 | 28.06 | 79.89 |
| Malacostraca | 11.06 | 3.27 | 13.28 | 93.18 |
| TC (Av. Sim = 77.28) | ||||
| Bivalvia | 30.97 | 5.74 | 40.08 | 40.08 |
| Gastropoda | 27.90 | 7.26 | 36.11 | 76.19 |
| Polychaeta | 11.97 | 3.35 | 15.49 | 91.68 |
(TA = transect A; TB = transect B, TC = transect C). Av. Sim = average of the similarity, Sim/SD = ratio of average contribution divided by SD, Cont.% =percentage of contribution, Cum% = culminated % contributions.
The presence of Gastropoda and Bivalvia varied among transects, and the variations in density contributed to the distinction of the faunal assemblages. The dissimilarity between TA and TB (25.64%) was due to Bivalvia (25.05%), Gastropoda (24.50%), and Malacostraca (20.64%). The difference between TA and TC (30.63%) was due to Bivalvia (28.31%), Malacostraca (19.80%), and Polychaeta (18.06%). Finally, Gastropoda (26.98%), Bivalvia (18.46%), and Polychaeta (17.96%) determined the difference between TB and TC (28.32%), (Table 3).
Table 3 Dissimilarity results of the SIMPER test based on benthic macrofaunal abundances of different transects in Los Petenes Biosphere Reserve (Campeche, Mexico)
| TA vs TB | TA vs TC | TB vs TC | |||||||
| Av. Diss = 25.64 | Av. Diss = 30.63 | Av. Diss = 28.32 | |||||||
| Av. Diss | Diss/SD | Cont. % | Av. Diss | Diss/SD | Cont.% | Av. Diss | Diss/SD | Cont. % | |
| Bivalvia | 6.42 | 1.10 | 25.05 | 8.67 | 1.06 | 28.31 | 5.23 | 1.55 | 18.46 |
| Gastropoda | 6.28 | 1.58 | 24.50 | 4.70 | 1.28 | 15.34 | 7.64 | 1.77 | 26.98 |
| Malacostraca | 5.29 | 1.69 | 20.64 | 6.06 | 1.61 | 19.80 | 3.58 | 1.35 | 12.65 |
| Ophiuroidea | 2.72 | 1.10 | 10.60 | 1.55 | 0.74 | 5.07 | 2.38 | 1.12 | 8.41 |
| Polychaeta | 2.29 | 1.06 | 8.94 | 5.53 | 1.51 | 18.06 | 5.09 | 1.48 | 17.96 |
(TA = transect A; TB = transect B, TC = transect C). Av. Diss = average of dissimilaritie, Diss/SD = ratio of average contributions, Cont.% = percentage contribution, Cum% = culminated % contributions.
Environmental variables. The PCA analysis grouped the sampling sites according to an environmental conditions gradient. Three groups were clearly defined, representing all transects TA, TB, and TC (Fig. 5). The first two principal components (PC) explained 59.4% of the total variance; PC1 (38.1% variation) and PC2 (21.3% variation) (Table 4). The most important variables defining PC1 were the organic carbon load (r =0.437), T. testudinum biomass (r=0.390), salinity (r =0.388), depth (r=0.386), and water temperature (r=0.362) (Table 4). The most important variables defining PC2 were related to nutrient concentrations, i.e., phosphate (r =0.563) and nitrate (r =0.528) in the interstitial water of sediments, as well as phosphate concentration in the water column (r =0.413) (Table 4).
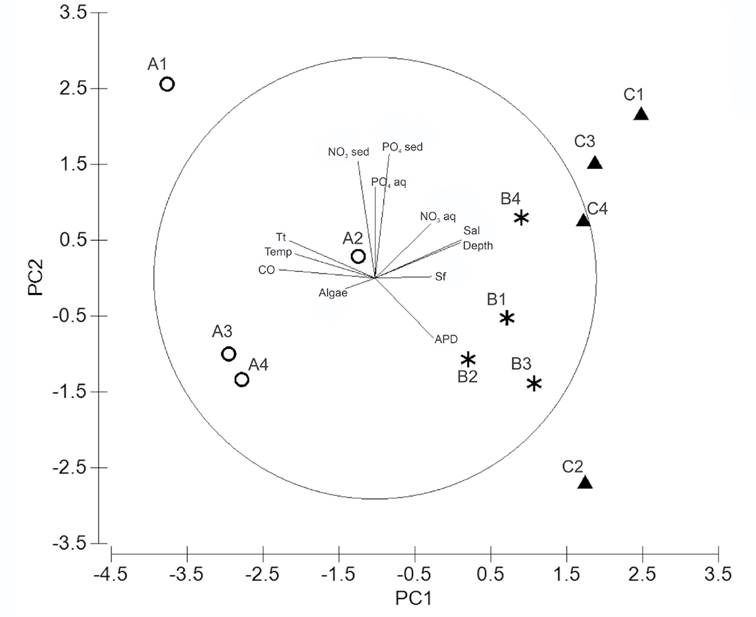
Figure 5 Principal component analysis performed with environmental variables in Los Petenes Biosphere Reserve (Campeche, México). Transect A (○), Transect B (*), and Transect C (▲). APD: average particle diameter; Sf: Syringodium filiforme biomass; Sal: salinity; NO3 aq: nitrate in water column; PO4 aq: phosphate in water column; PO4 sed: phosphate in interstitial water of sediment; NO3 sed: nitrate in interstitial water of sediment; Tt: Thalassia testudinum biomass; Temp: water temperature; CO: organic carbon percentage in dry sediment; Algae: algae biomass.
Table 4 Eigenvalues and correlation matrix loadings of the significant principal components (PC) of environmental variables in Los Petenes Biosphere Reserve (Campeche, Mexico).
| Variables | PC1 | PC2 |
| Thalassia testudinum Biomass | 0.39 | 0.171 |
| Syringodium filiforme biomass | -0.255 | 0.007 |
| Algae biomass | 0.136 | -0.049 |
| Organic carbon percentage in sediment | 0.437 | 0.039 |
| ɸ Sediment average particle diameter | -0.263 | -0.271 |
| Water temperature | 0.362 | 0.109 |
| Salinity | -0.388 | 0.173 |
| Depth | -0.386 | 0.161 |
| NO3 in water column | -0.251 | 0.245 |
| PO4 in water column | -0.001 | 0.413 |
| NO3 in sediment | 0.077 | 0.528 |
| PO4 in sediment | -0.064 | 0.563 |
| Eigenvalue | 4.57 | 2.56 |
| Variance (%) | 38.1 | 21.3 |
| Cumulative (%) | 38.1 | 59.4 |
The spatial pattern of the environmental variables was confirmed by the ANOSIM analysis (ρ = 0.41, p =0.002), which showed that the abiotic conditions changed from nearshore to offshore. Whereas TA was significantly different from TB (ρ =0.51, p =0.029) and TC (ρ =0.84, p =0.02), TB was not different fr om TC (ρ =0.15, p =0.14).
The T. testudinum biomass was high in inshore stations (2163.3±1407.3 g m-2 in TA), but low or zero in offshore stations (183±175 g m-2 in TB and 417.5±431.6 g m-2 in TC) (Fig. 6a). By contrast, S. filiforme biomass was high in the middle and offshore stations (TB: 594.6±467.2 g m-2 and TC: 500.3±691.9 g m-2), but absent in all stations near the coast (TA: 0 g m-2). The algae biomass ranged from 0 g m-2 to 155 g m-2 and represented less than 7% of the total SAV biomass (Fig. 6b).
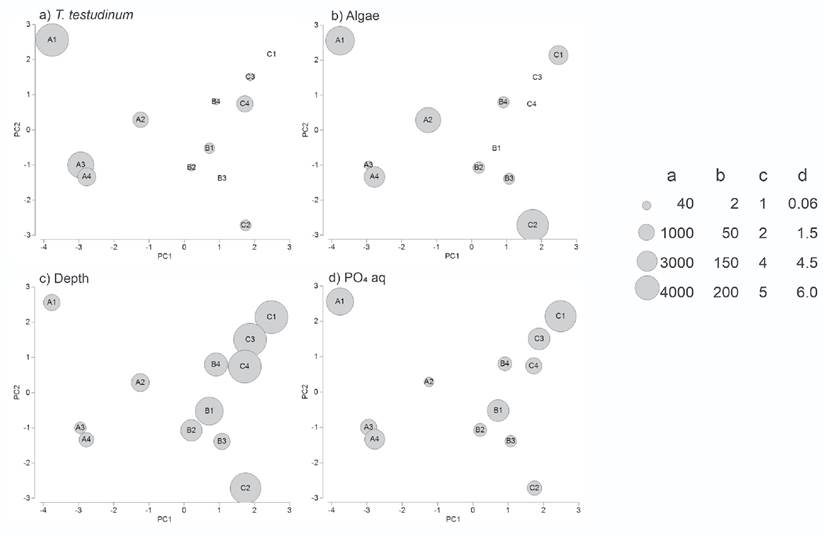
Figures 6a-e Most correlated environmental variables superimposed on the NMDS configuration of the sampling stations in Los Petenes Biosphere Reserve (Campeche, México). a) Thalassia testudinum biomass; b) Algae biomass; c) Depth; d) PO4 concentration in the interstitial water in sediment.
Average sediment particle diameter ranged from 0.54±0.40 mm in TA to 0.97±0.42 mm in TC. The organic carbon content in the sediment ranged from 6.72±2.11% in TA to 2.69±1.12% in TB, and 1.65±1.04% in TC (Fig. 6c). TA was the shallowest transect with an average depth of 1.9±0.3 m, while the average depth of TB was 2.9±0.8 m, and the deepest transect was TC with 4.9±0.3 m of average depth. Accordingly, the temperature changed gradually offshore, with the highest average temperature in TA (28.0±0.66 °C), and lower temperatures in TB (27.1±0.36 °C) and TC (26.4±0.4 °C). Average salinity values increased from the coast to offshore with values of 28.0±1.9 in TA, 33.0±1.2 in TB, and 35.0±1.1 in TC.
Nutrient concentrations in the water column as well as in the interstitial water of the sediment were homogeneous. Nitrate measured in the water column showed values from 7.66±6.76 µmol L-1 in TA, 10.48±2.08 µmol L-1 in TB, and 11.55±4.77 µmol L-1 in TC. The phosphate concentrations in the water column were 2.08±1.51 µmol L-1 in TA, 1.34±4.77 µmol L-1 in TB, and 2.66 ± 1.92 µmol L-1 in TC. Phosphate concentrations in the interstitial water ranged from 1.42±1.63 µmol L-1 in TA and 1.40±1.31 µmol L-1 in TB to 2.00±1.34 µmol L-1 in TC (Fig. 6d). Nitrate measured in the interstitial water varied from 22.98±5.16 µmol L-1 in TA to 19.35±6.58 µmol L-1 in TB and 20.56±6.23 µmol L-1 in TC (Fig. 6e).
Relation between the benthic macrofauna with the environmental variables. The BIOENV analysis showed a strong correlation between the community structure of the LPBR and the group of environmental variables: T. testudinum biomass, algae biomass, depth, and phosphate concentration in the water column (ρ =0.69, p =0.023%). However, T. testudinum biomass alone had a Pearson correlation of 0.57, the highest of any individual variable, and also was present in the five best combinations of environmental variables (Table 5). The highest correlation of the four environmental variables was confirmed by the RELATE analysis, which significantly matched the similarity matrix of these variables with the biological matrix (ρ =0.697, p =0.0008).
Table 5 BIOENV results for the higher Pearson correlation for each number of environmental and biological variables with the macrobenthic community.
| Number of variables | Environmental variables | Pearson correlation |
| 1 | Tt | 0.570 |
| 2 | Tt, Al | 0.609 |
| 3 | Tt, Al, PO4 aq | 0.681 |
| 4 | Tt, Al, De, PO4 aq, | 0.697 |
| 5 | Tt, Al, De, PO4 aq, NO3 se | 0.693 |
Abbreviations of environmental variables are as such: Tt: Thalassia testudinum biomass, Al: Algae biomass, PO4 aq: PO4 concentration in interstitial water of sediment column, NO3 se: NO3 in interstitial water of sediments. The Global test for the 999 permutations to find the highest Pearson correlation give a ρ= 0.697 and Significance level p= 0.038.
Moreover, when we probe the correlation of environmental variables with benthic macrofaunal density, instead of macrofauna community composition, the highest correlation was given by T. testudinum biomass (r2 =0.7) (Fig. 7). Interestingly, the relation between benthic macrofauna density and T. testudinum biomass was not linear but follow a Log normal distribution with a peak of maximal benthic macrofaunal density at 2200±73.34 ind m-2 in a T. testudinum biomass of 800 -1200 g m-2 (Fig. 7).
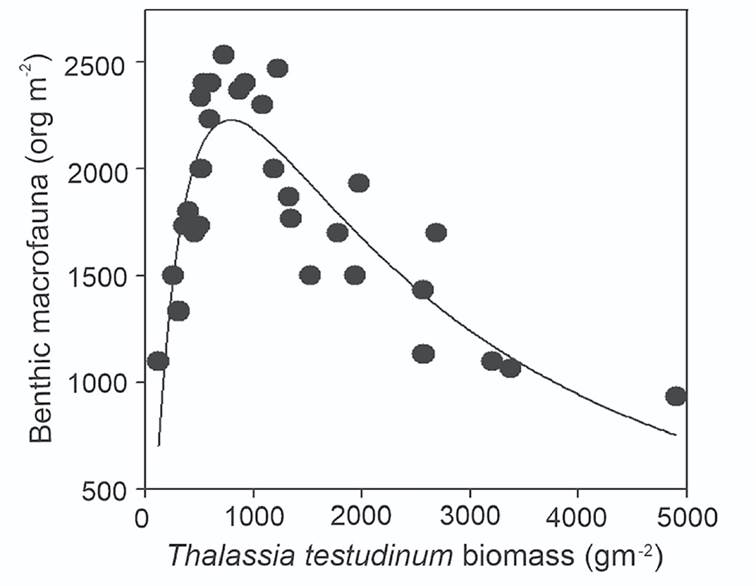
Figure 7 Relationship between benthic macrofaunal density and Thalassia testudinum biomass at Los Petenes Biosphere Reserve (Campeche, México). The continuous line represents the fit of the data to the mathematical model y= a exp [-0.5 * (ln (x/x0)/w)2], where a is the peak of maximum benthic macrofaunal density, w is the width peak and x0 is the T. testudinum biomass content at maximum benthic macrofaunal density.
DISCUSSION
The benthic macrofauna from the tropical seagrass meadow of the LPBR was composed by 10 taxonomic Classes. Their community structure responds to the heterogeneity of environmental and biological variables that change according to the environmental gradient identified from inshore to offshore. The four most important variables influencing the community structure were T. testudinum biomass, algae biomass, depth, and phosphate levels in the water column.
It is known that seagrasses increase the availability of habitat structures for the associated fauna (Orth et al., 1984). In LPBR, T. testudinum biomass resulted to be the most important regulator of the macrobenthic community structure and density. The importance of algae, which in LPBR account for less than 7% of the total SAV, is probably related to food availability for many gastropod species, since seagrass is less palatable and less nutritive than algae (Hemminga & Duarte, 2000). Changes in macrofaunal composition and biomass with depth may be due to changes in light availability that affect the productivity of seagrasses directly, thus indirectly altering the community structure of the benthic macrofauna in LPBR. Phosphate concentration in the water column and sediments is not a common variable known to influence benthic macrofauna but that influence the SAV, which in turn affects benthic macrofauna. The high values of phosphate found in LPBR are most probably due to continental discharges, as a higher phosphate load was found in stations nearest to the Campeche City.
In LPBR, more taxonomic Classes were identified and a different community structure of benthic macrofauna was found compared to other tropical seagrass meadows, as an example: the Morrocoy National Park of Venezuela (Bitter-Soto, 1999) the Card sound and Apalachee Bay in Florida (Brook, 1977; Dugan & Livingston, 1982) and even in Laguna de Terminos, Mexico (Ávila et al., 2015). We suggest that this difference is due to the high degree of exposure to the open sea since LPBR is a large seagrass bed that extends around 20 to 25 km from the coast to the open sea and, except for the seagrass structures, lacks mechanical protection from waves. This study is particularly contrasting to the enclosed lagoons or estuaries of the previous mentioned studies. Given that the LPBR is an extensive seagrass bed, it presents gradual variability in the environmental conditions, which could be reflected in a highly variable community structure. The highest environmental variability was found along TA that is near to the coastline, where an important mangrove swamp occurs. TA receives an important and continuous input of underground water (Bauer-Gottwein et al., 2011; Perry et al., 2009), and the mangrove forest contributes to an increase on the environmental heterogeneity and the faunal migration.
In this study, the maximal benthic macrofauna density was found at an optimal amount of seagrass biomass. Lower or higher densities of vegetation were associated with lower benthic macrofaunal density and diversity. Lower T. testudinum biomass provides a less complex spatial structure and less available food (Duffy, 2006). By contrast, high vegetation biomass produces a high accumulation of organic matter in the sediment with subsequent anoxia and high sulfide concentrations, which is toxic for seagrasses and many benthic species (Calleja et al., 2007; Koch et al., 2007). Particularly at the site with the highest seagrass biomass (A1), Bivalvia were absent, and only three macrobenthic taxonomic Classes were present (Gastropoda, Malacostraca, and Polychaeta). This finding is remarkable, as bivalves, especially Lucinid clams, are essential for the biogeochemistry and health of seagrasses (Reynolds et al., 2007; Van der Heide et al., 2012). Three stages of symbiosis between seagrasses, bivalves, and sulfide-oxidizing endosymbiont bacteria have been reported, increasing seagrass production (Van der Heide et al., 2012). However, an excessive seagrass below-ground biomass obstructs the burrowing activity of Lucinids, causing an increase of their mortality rate (Rattanachot & Prathep, 2015). Therefore, the absence of bivalves at sampling site A1 could thus be a result of the high seagrass biomass and especially the below-ground seagrass biomass. The lack of the Lucinids symbiont bivalves at site A1 could be causing an instability of the seagrass ecosystem since no consumption of the H2S by sulfide oxidant endosymbiotic bacteria could increase toxicity in sediments and, as a consequence, the decrease of the macrofauna density and diversity. We found that only a small range of seagrass biomass is related to the maximal benthic macrofaunal density, which suggests that seagrass biomass has a strong influence on the benthic macrofaunal density in the tropical seagrass meadow of LPBR.
The community structure and particular environmental characteristics observed at the sampling site A1 could be reflecting the human impact in LPBR. This sampling site is located at 3 km from a wastewater discharge of Campeche City. It is known that waste-water discharges of urban settlements lead to high inputs of organic carbon and nutrients, eventually changing biodiversity and disturbing marine ecosystems, such as seagrass ecosystems (Duarte, 2000; Laurila-Pant et al., 2015; Pillay et al., 2010). Site A1 showed the lowest benthic macrofaunal density and diversity, and the highest SAV biomass, phosphate concentration in the water column and the highest percentage of organic carbon in the sediment. Moreover, the phosphate concentrations measured in the water column at sites A1, were almost one order of magnitude higher compared to the rest of the sampling sites of the LPBR and also compared to other nearby sites in the Yucatan peninsula (Herrera-Silvera et al., 2004). Bivalves are highly susceptible to contaminants and disappear from highly eutrophic seagrass meadows, such as those close to seaweed farms (Lyimo et al., 2009). Similar results had already been reported in a UNESCO biosphere reserve seagrass meadow (Bologna et al., 2008), they found that the most anthropogenically impacted site presented the highest seagrass biomass but the less dense and diverse macrofauna community. However, to assess the potential pollution source, its impact on the seagrass ecosystem, and the capacity for resilience of the LPBR tropical seagrass bed, it is necessary to evaluate the health status of the seagrass meadow from the LPBR by conducting a long-term monitoring program. In that way, our study provides the baseline to begin this kind of monitoring programs.
The community structure of VAS and benthic macrofauna of the LPBR turned out to be complex. In the present study, we showed the presence of the seagrass species T. testudinum and S. filiforme, several macroalgae genera, and macrobenthic specimens belonging to 10 taxonomic Classes, which help us to identify different biodiversity interactions between them. Yet, more features of this important ecosystem should be studied to have a better understanding of the ecological regulation mechanisms of this natural reserve, which is still considered as one of the most extensive and best-conserved seagrass meadows in México (CONANP, 2006). The better understanding of seagrass ecosystems is necessary to establish their good reputation and contribute to sound management strategies of seagrass ecosystems around the world.


 nueva página del texto (beta)


