INTRODUCTION
The chemical composition of shales provides important information on regional tectonic setting, provenance, weathering conditions, and sediment recycling (Roser and Korsch, 1988; McLennan et al., 1993; Cullers, 1995). The geochemistry of fine-grained sediments, in particular trace elements, is believed to represent the average composition of the upper continental crust more than any other sedimentary rocks (DaPeng et al., 2012), as they preserve the provenance signature and diagenetic history (Baioumy and Ismael, 2010; Mondal et al., 2012; Spalletti et al., 2012). In fact, the geochemical composition of clastic sediments is a complex function of variables such as source material, weathering, physical sorting, and diagenesis (Nagarajan et al., 2007a, 2007b; Moosavirad et al., 2012; Armstrong-Altrin et al., 2013, 2015; Madhavaraju, 2015). However, many studies proved that the geochemical composition of clastic sediments are useful to understand the source-area weathering conditions (Selvaraj and Chen, 2006; Gupta et al., 2012; Raza et al., 2012) and provenance (Cullers, 2000, 2002; Armstrong-Altrin, 2009; Fatima and Khan, 2012; Madhavaraju, 2015; Ramachandran et al., 2016). Likewise, certain trace elements and their ratios and REE patterns of the clastic sediments are believed to be an effective tool for the reconstruction of source rock composition because they are not significantly redistributed in the course of sedimentation, lithogenesis, and metamorphism (Fu et al., 2010; Etemad-Saeed et al., 2011; Zaid, 2012).
Certain elements actively participate in various geochemical processes taking place in marine environments and they may become authigenically enriched or depleted in sediments depending on the availability of free oxygen during deposition; as a result, the distribution patterns of such elements are extensively used to understand the variations in paleo-redox conditions in both modern marine sediments and ancient rocks (Calvert and Pedersen, 1993; Canet et al., 2004; Algeo and Maynard, 2004; Tribovillard et al., 2006; Nagarajan et al., 2007b; Madhavaraju and Lee, 2009; Madhavaraju et al., 2015a).
The clay mineralogical composition of sediments can reflect the effects of several paleoenvironmental conditions (climate, sea level fluctuations, tectonic activity as well as continental and basin morphology). The clay minerals study is considered to be a powerful tool for the interpretation of weathering conditions and paleoclimate in the source area (Chamley, 1989; Madhavaraju and Ramasamy, 2001; Madhavaraju et al., 2002; Ruffell et al., 2002; Ahlberg et al., 2003; Deconinck et al., 2005; Dera et al., 2009).
For the present study, shale samples were collected from the exposed section of the Mural Limestone located near the town of Tuape, northern Sonora. Major, trace and rare earth elements, and clay minerals were analyzed from samples collected at several stratigraphic level of this section. The purpose of the present study is to identify the paleoclimatic changes recorded in the shale sequences, to assess the intensity of source area weathering, and to infer paleo-redox conditions in the Tuape section of the Mural Limestone.
GEOLOGY OF THE STUDY AREA
The Lower Cretaceous Mural Limestone, well exposed in northern Sonora, Mexico (Figure 1), was deposited on a shallow marine platform during Aptian-Albian time (Scott, 1987). These sedimentary rocks show similar stratigraphic characteristics and are correlative with rocks exposed in southern Arizona and New Mexico in the United States of America (Ransome, 1904; Cantú-Chapa, 1976; Bilodeau and Lindberg, 1983; Mack et al., 1986; Dickinson et al., 1989; JacquesAyala, 1995; Lawton et al., 2004). Various geochemical and isotopic studies have been undertaken on the carbonate rocks of the Mural Limestone to understand their depositional and diagenetic environments (Madhavaraju et al., 2010; Madhavaraju and González-León, 2012; Madhavaraju et al., 2013a, 2013b; 2015b). Regionally, the Mural Limestone overlies and underlies thick fluvial successions consisting of reddish brown sandstone, siltstone and conglomerate of the Morita and Cintura Formations, respectively. In addition to that, the Glance Conglomerate that underlies the Morita Formation is composed of cobbleto boulder-conglomerate with local interbeds of volcanic flows and tuffs. These formations together compose the Bisbee Group which represent syntectonic rift deposits that were deposited in the Bisbee basin of northern Sonora and southeastern Arizona (Bilodeau et al., 1987; Lawton et al., 2004). Mural Limestone has been divided into six members in Sonora by Lawton et al. (2004): Cerro La Ceja (CLC), Tuape Shale (TS), Los Coyotes (LC), Cerro La Puerta (CLP), Cerro La Espina (CLE) and Mesa Quemada (MQ) members.
The Tuape section spans from the basal Cerro La Ceja to the Mesa Quemada members at the top of the Mural Limestone (Figure 2) (Lawton et al., 2004; González-León et al., 2008; Ramírez-Montoya, 2014 ). The CLC Member consists of bioclastic limestone, sandstone, siltstone and shale. The limestone beds are grey, brown and dark yellowish brown, and locally sandy. Siltstone beds are grey, green and reddish brown with calcareous nodules. Shale beds are brown and green and locally contain silty materials. The TS Member is mainly composed of grey to black shale, shaly limestone and subordinate amount of siltstone and fine-grained sandstone. Limestone occurs as thin beds which contain oysters and ammonites. The LC Member consists of thin beds of brown shale, calcareous siltstone, shaly limestone, massive brown siltstone, fine-grained sandstone and bioclastic limestone. The CLP Member is mainly composed of black shale and thin beds of fine-grained sandstone and fossiliferous limestone. The CLE Member is composed mostly of massive limestone with thin beds of siltstone, mudstone, fine-grained sandstone and shaly limestone. The MQ Member includes green shale, light grey to red siltstone, sandstone and bioclastic limestone. Earlier studies confirmed that the Mural Limestone ranges from late Aptian to early Albian (Lawton et al., 2004; González-León et al., 2008; Madhavaraju et al., 2013b).
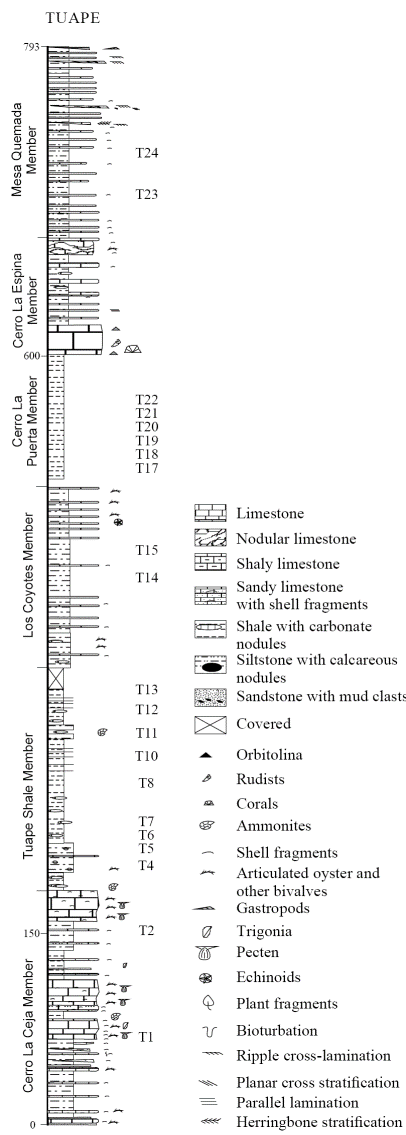
Figure 2 Lithostratigraphic section of the Mural Limestone in Tuape (modified after Lawton et al., 2004). T1-T24 indicate stratigraphic position of the shale samples collected in the present study.
MATERIALS AND METHODS
Twenty one samples were selected for major, trace and rare-earth elements geochemistry. Major, trace and rare earth elements concentrations were analyzed at Instituto de Geología, Universidad Nacional Autónoma de México, México. Each collected sample was powdered in an agate mortar, and fused-glass beads were prepared for major elements analysis. Major elements composition was obtained by X-ray fluorescence in fused LiBO2/Li2B4O7 disks using a Siemens SRS-3000 X-ray fluorescence spectrometer with an Rh-anode X-ray tube as a radiation source. X-ray absorption/enhancement effects were corrected using the Lachance and Traill (1966) method, included in the SRS-3000 software. The geochemical standard JGB1 (GSJ) was used to determine data quality (Table 1). The analytical accuracy errors were better than ±2% for SiO2, Fe2O3, CaO and TiO2 (1.15%, 0.66%, 1.43%, 0.63, respectively) and better than ±5% for Al2O3, MgO, Na2O and K2O (3.32%, 3.57%, 4.17%, 4.17%, respectively). The accuracy errors of MnO and P2O5 were more than ±5% (5.26%, 7.14%, respectively). One gram of sample was heated to 1000 oC in porcelain crucibles for one hour to measure the loss on ignition (LOI).
Table 1 Comparison of major oxide data for GSJ reference sample JBG1 with GSJ certificate of analysis data (Imai et al., 1995) as well as limits of detection (LOD) data for XRF analyses.
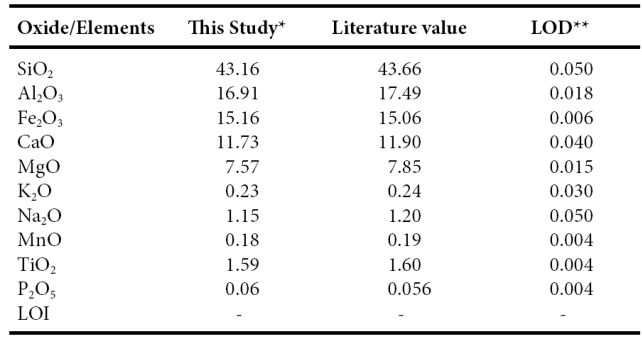
*Major elements in wt % are by XRE ** LOD (limit of detection) in wt% - :not determined or not reported
Trace and rare earth elements were determined by an Agilent 7500 ce Inductively Coupled Plasma Mass Spectrometer (ICP-MS) according to standard analytical procedures suggested by Eggins et al. (1997). The analytical results for the IGLa-1 and GSR2 obtained in the present study were compared with the published values (Table 2) reported by Govindaraju (1994) that allowed to improve the quality and accuracy of the analysis. The analytical precision errors for Ba, Cr, Sc, V, Y, Sr, Zr, Nb and Rb were better than ±4%, while for Co, Zn and Pb were better than ±6%. The analytical accuracy errors of certain trace elements (Cu, Ni, Th and U) were better than ±10%.
Table 2 Comparison of data of trace and rare earth elements and GSR2 reference samples.
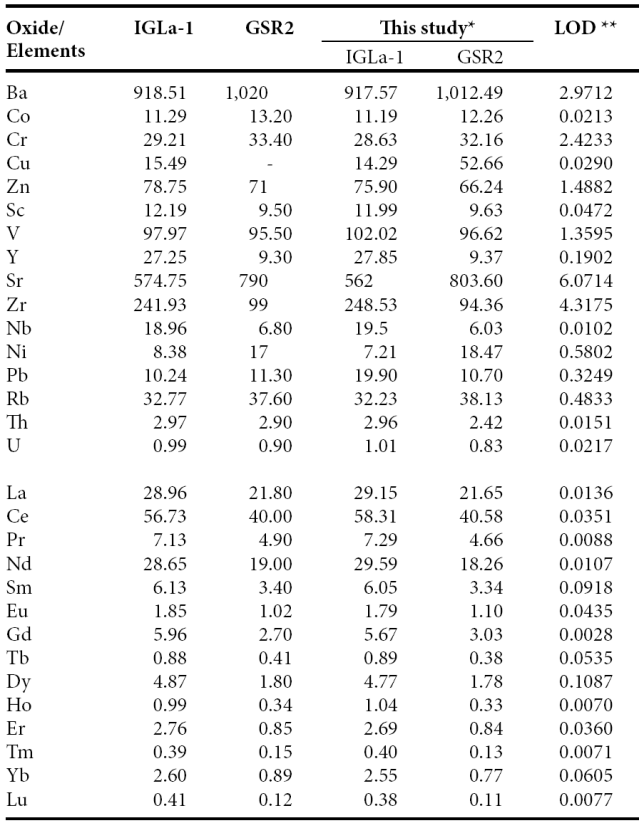
*Trace and rare earth elements in ppm by IC-MS. **LOD (limit of detection) in ppb - : not determined or not reported
The accuracy errors for rare earth elements such as La, Ce, Pr, Nd, Sm, Dy, Ho, Er and Lu were better than ±4%, and, Eu, Gd, Tb, Tm and Yb were better than ±10%. The detection limits for the instrument used in this study are given in Table 2. They generally obey the findings suggested by Verma et al. (2002), Santoyo and Verma (2003), and Verma and Santoyo (2005). Rare earth elements were normalized to chondrite values of Taylor and McLennan (1985) for preparing REE-normalized diagrams. The Eu/Eu* (Eu anomaly) is calculated using the value of Eu (Eusample/Euchondrite) and the predicted value of Eu* is obtained from the interpolation from the chondrite normalized values of Sm and Gd.
Twelve samples were selected for the clay minerals study. Samples were prepared following standard XRD procedures (Brindley and Brown, 1980; Moore and Reynolds, 1989). For whole-rock mineralogy analysis samples were ground with an agate pestle and mortar to <75 μm and mounted in aluminum holders for X-ray powder diffraction analysis. For clay mineral analysis, the <2 μm fraction was separated by gravity settling, washed and concentrated by centrifugation and prepared for X-ray diffraction (XRD) by sedimentation onto round glass slides. Measurements were made using a Shimadzu XRD-6000 diffractometer at Instituto de Geología, Universidad Nacional Autónoma de México, México. This equipment operated with an accelerating voltage of 40kV and a filament current of 30mA, using CuKα radiation and graphite monochromator. Clay samples were examined by XRD in the air-dried form, saturated with ethylene glycol (EG) and after heating (550 °C). We compared patterns produced from air dried with EG solvated preparations. All the preparations were measured over a 2θ angle range of 2-70° (air-dried) and 2-40o (glycolated and heated) in steps of 0.02° and 2 seconds integration time. Profiles were analyzed using Shimadzu software. Peak positions ("d" spacings) were standardized against quartz 100 peak taken at 4.26 Å. To obtain statistically representative values, all samples were analyzed by duplicate. All the measurements were done under the same analytical conditions and calibrated using international reference materials (NIST 675 and NIST 640d). All values given here are of relative clay mineral abundance, i.e., abundance of that particular clay mineral relative to the total clay mineral assemblage of a sample. Total organic carbon and total nitrogen concentrations were analyzed using a CHNS 2400 series II Perkin Elmer elemental analyser at Instituto de Geología, Universidad Nacional Autónoma de México, México.
RESULTS
Clay mineralogy
The bulk mineralogy of the shales is listed in Table 3. The shales from the CLC Member (Figure 3) yielded the following results: illite (54%) and smectite (37%) are the commonest clay minerals whereas kaolinite (9%) is present in minor amount (Figure 3). The associated non-clay minerals observed in this member are quartz, feldspar, calcite and phyllosilicate. The TS Member is dominated by illite (40 - 70%) (Table 4). Larger fluctuations are observed in the chlorite (4 - 40%) and kaolinite (14 - 42%) contents. The chlorite content decreases towards the top of this member; kaolinite shows an increasing trend towards the top of the TS Member (Figure 3). The LC Member shows high content of chlorite (48%) and illite (39%) than kaolinite (13%). The CLP Member show large variations in chlorite (14 - 67%), illite (17 - 50%) and kaolinite (16 - 46%) contents. The MQ Member is dominated by both illite (30 - 46%) and chlorite (31 - 40%) followed by kaolinite (23 - 30%).
Major elements
Slight enrichment of SiO2 is noticed in CLC, LC and MQ members (61.2 - 62.5%; 61.0 - 61.8%; 62.3 - 65.1%; respectively) over TS and CLP members (53.6 - 61.0%; 52.6 - 57.7%; respectively). The content of Al2O3 is comparable in the five members of the Mural Limestone (CLC: 14.2 - 14.7%; TS: 11.7 - 15.5%; LC: 14.4 - 15.1%; CLP: 12.4 - 14.5%; MQ: 14.1 - 15.0%; respectively). TS and CLP members show higher concentration of CaO (2.77 - 11.47%: 5.81 - 10.51%; respectively) than CLC, LC and MQ members (3.26 - 3.70%; 3.36 - 3.84%; 2.17 - 2.88%; respectively). K2O contents are higher than Na2O in the studied shales (Table 5). Overall, the shale samples have low MgO, MnO, TiO2 and P2O5 contents (Table 5).
The classification of the shale samples into mafic, intermediate and felsic compositions uses the calculated (SiO2)adj values (Le Bas et al., 1986). Such classification has been used by few workers (Hayashi et al., 1997; Armstrong-Altrin, 2009). Most of the samples fall in the felsic compositional field whereas few samples fall in the intermediate compositional field (Figure 4). The ratio K2O/Al2O3 can be used as an indicator of the original composition of ancient mudrocks. K2O/Al2O3 ratios for clay minerals (0.0 to 0.3) are markedly different from those for feldspars (0.3 to 0.9; Cox et al., 1995). In the present study, K2O/ Al2O3 ratios lie in the range of values for clay minerals, particularly between 0.13 and 0.21, which suggest that the clay minerals present in them are mostly of kaolinte and illite compositions.
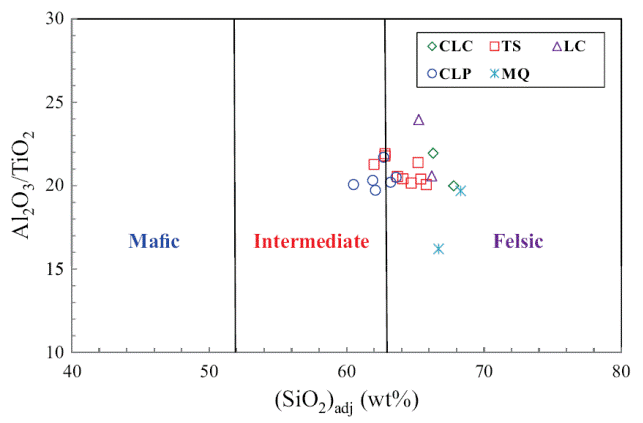
Figure 4 Al2O3/TiO2 vs. (SiO2)adj relationship for shales of the Mural Limestone. The fields based on (SiO2)adj are from Le Bas et al. (1986).
Trace elements
The concentrations of trace elements of the shales are given in Table 6. The trace elements were normalized using North American Shale Composite values (NASC) (Gromet et al., 1984) and are plotted in a multi-element diagram (Figure 5). In comparison with NASC (Figure 5), CLC and TS members show similar concentration of Sr and Ba contents and slightly depleted in Rb content. LC and CLP members are slightly enriched in Sr content and slightly depleted in Rb and Ba with respect to NASC. In the MQ Member, the large-ion lithophile elements such as Rb and Ba show moderate depletion whereas Sr show slight depletion compared to NASC. The clear positive correlation observed between Rb and K2O (r = 0.81, n = 21) suggest that their distribution are mainly controlled by clay minerals. However, absence of such correlation observed between Ba and K2O (r = 0.32, n = 21) suggest that their distribution are not controlled by the clay minerals.
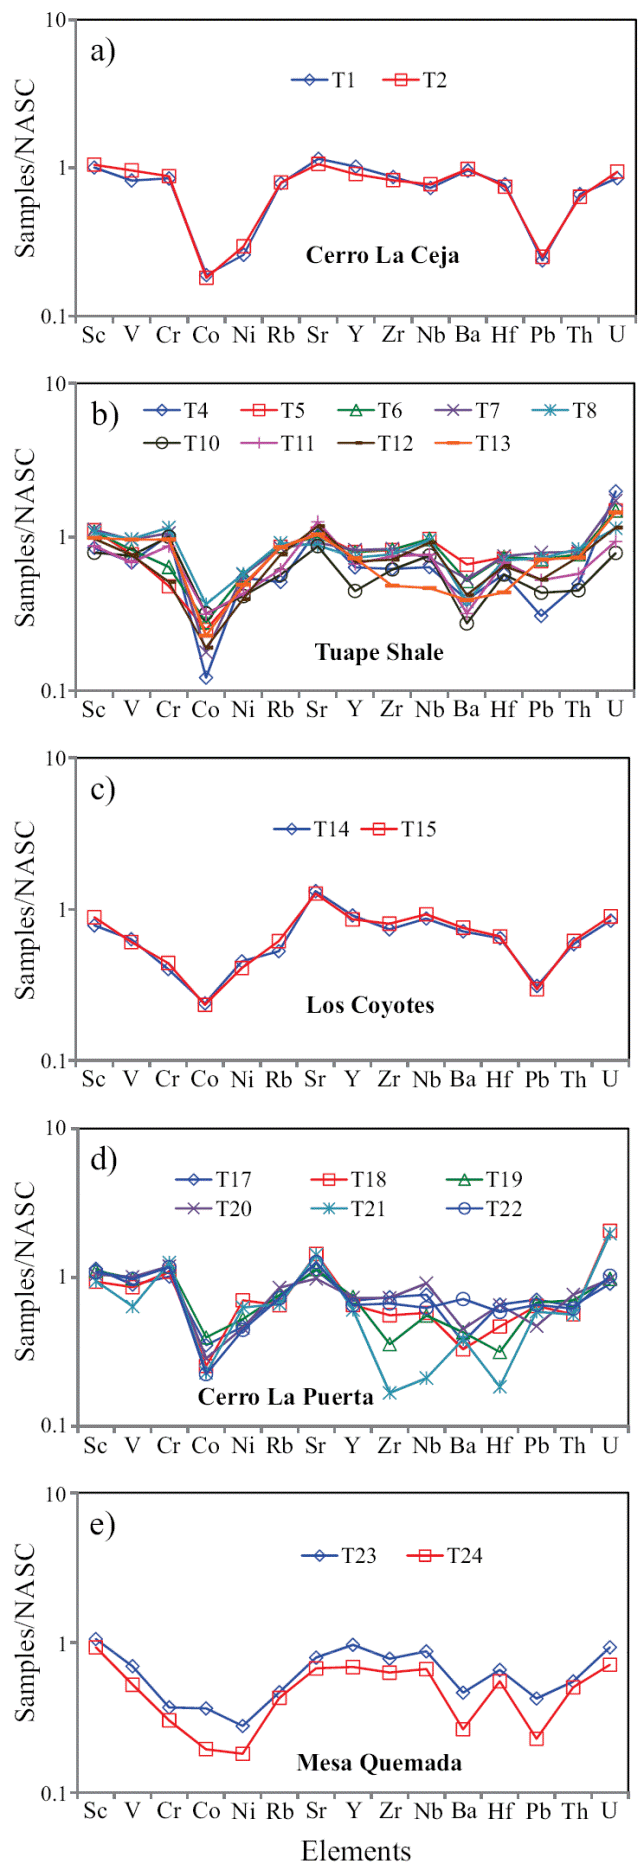
Figure 5 a) NASC-normalized trace elements diagram for shales of the Cerro La Ceja Member of the Mural Limestone; b) NASC-normalized trace elements spider diagram for shale samples of the Tuape Shale Member; c) NASCnormalized trace elements diagram for shales of the Los Coyotes Member; d) NASC-normalized spider diagram for shales of the Cerro La Puerta Member; e) NASC-normalized trace elements diagram for shale samples of the Mesa Quemada Member of the Mural Limestone.
In NASC normalized diagram, most of the shales are depleted in high field strength elements (Zr, Hf, Y, Nb, Th and U). Few shales (T1 and T2) have similar concentration of Y with respect to NASC. Most of the shales from TS and CLP members are enriched in U compared to NASC. Positive correlation of Al2O3 with Nb and Y (r = 0.58; r = 0.54; respectively) reflects that these elements are probably hosted by clay minerals. In addition, Th shows strong correlation with Al2O3 (r = 0.65) implying that they may be controlled by clay minerals. Uranium contents show no correlation with Al2O3 content (r = -0.37), indicating that this element is not controlled by the clay minerals, but might be associated with other phases.
The shales are significantly depleted in Co content relative to NASC. Most of the shales show moderate depletion in Ni content compared to NASC. In comparison with NASC (Figure 5), shales show similar concentration of Sc. In CLC, TS and CLP members, the transition trace elements such as V and Cr show either slight depletion or slight enrichment whereas LC and MQ members show moderate depletion compared to NASC. The transition trace elements (V, Cr, Co and Ni) show no correlation with Al2O3 (r = 0.16; r = -0.43; r = 0.07, r = -0.30; respectively) which suggest that these elements were not controlled by the clay minerals (Armstrong-Altrin et al., 2014).
The concentrations of the redox-sensitive trace elements (Mo, U, and V) are given in Table 6. The CLC, LC and MQ members show low concentrations of Mo (0.62 - 0.69 ppm; 0.60 - 0.65 ppm; 0.67 - 0.68 ppm, respectively; Table 6) than TS and CLP members (0.65 - 3.09 ppm; 0.67 - 1.05 ppm; respectively). Under reducing conditions, the modern marine sediments are enriched with Mo where free H2S is present, with Black Sea reduced sediments containing 2 - 40 ppm and Saanich Inlet sediments 50 - 125 ppm (Crusius et al., 1996), which are noticeably higher than the average Mo concentrations in normal shales (1 ppm) (Wedepohl, 1971, 1991) and in black shales (10 ppm) (Vine and Tourtelot, 1970). Uranium enrichment is found in the lower part of the TS Member and in the lower and middle parts of the CLP Member. However, CLC, LC and MQ members show low content of U (2.30 - 2.55 ppm; 2.27 - 2.42 ppm; 1.92 - 2.51 ppm; respectively). Low contents of U are found in sediments deposited in oxygenated conditions in marine environment (Somayajulu et al., 1994), whereas sediments deposited from the oxygen minimum zone show high U contents (Barnes and Cochran, 1990; Klinkhammer and Palmer, 1991; Sarkar et al., 1993; Somayajulu et al., 1994; Nath et al., 1997). Significant variations in vanadium content are observed among different members in the Tuape section.
Rare earth elements
The concentrations of rare earth elements are given in Table 7. The shale samples show large variations in ΣREE content among different members suggesting that the observed variations may be due to compositional variability. ΣREE contents positively correlate with Al2O3, suggesting that the ΣREE contents in these shales are controlled mainly by the clay minerals. In general, chondrite-normalized REE patterns (Figure 6) are stepped with considerable LREE enrichment, ((La/Sm)cn: 2.46 - 7.12, 4.81 ± 1.22, n = 21; cn refers to chondrite normalized values), flat HREE ((Gd/Yb)cn: 1.23 - 1.72, 1.35 ± 0.13, n = 21) with significant negative Eu anomalies (Eu/Eu*: 0.56 - 0.73, 0.65 ± 0.05, n = 21).
Table 7 Concentration of rare earth elements (ppm) in shales from Tuape section of the Mural Limestone.
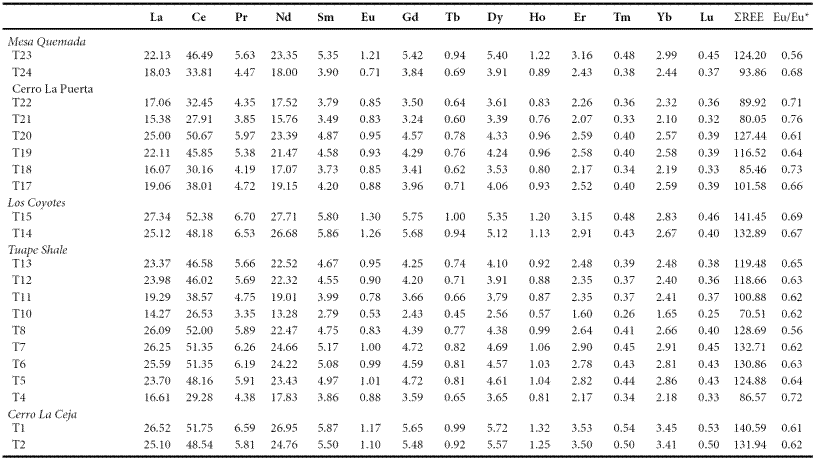
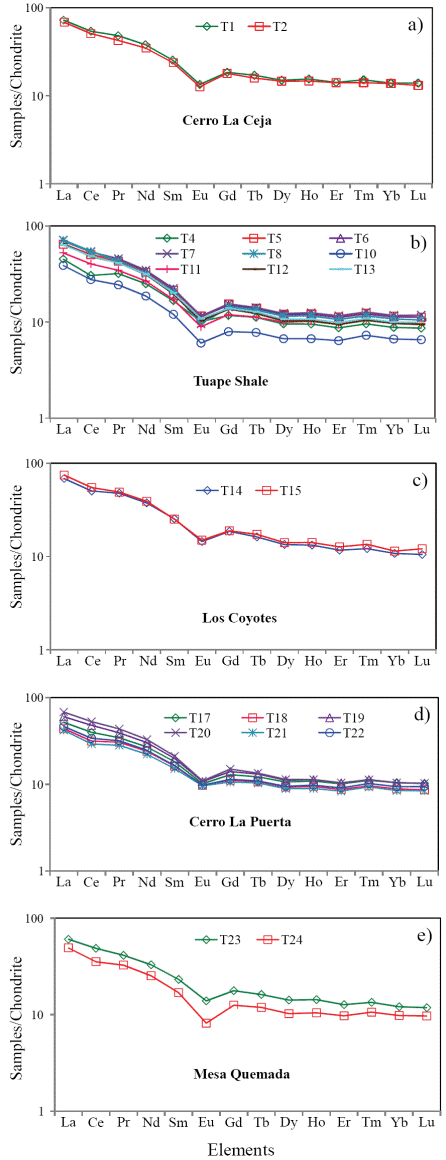
Figure 6 a. Chondrite normalized rare earth elements patterns for shales of the Cerro La Ceja Member; b. Chondrite normalized rare earth elements patterns for shales of the Tuape Shale Member; c. Chondrite normalized rare earth elements patterns for shales of the Los Coyotes Member; d. Chondrite normalized rare earth elements patterns for shales of the Cerro La Puerta Member; e. Chondrite normalized rare earth elements patterns for shale samples of the Mesa Quemada Member of the Mural Limestone.
Distribution of total organic carbon and total nitrogen concentrations
A distinct variation in total organic carbon (TOC) content is found in the Tuape section, with values that range between 0.33% and 3.08%. The low variations in TOC content are observed in the Cerro La Ceja Member (0.85 - 0.91%; Table 6). The sudden increase in TOC content is noticed in the base of the Tuape Shale Member, and then gradually decrease in TOC value (1.18%) and the values then increase to 1.91%. Again, low TOC content is observed in the Los Coyotes Member. A gradual increase in TOC content (1.9%) is noticed in the base of the Cerro La Puerta Member, and higher values of TOC are noticed in the middle part of this member (T18: 2.82%; T21: 2.42%). The Mesa Quemada Member has low TOC content (0.33 - 0.45%). The Al normalized distribution of total organic carbon (TOC) content of the Tuape section is shown in Figure 7. In this section, TOC concentration show significant positive shift in the lower part and slight increase in TOC values in the upper part of the TS Member. Likewise, two positive shifts are noticed in the CLP Member. Such positive shift in the TOC curve in the TS and CLP Members suggest that the depositional basin experienced fluctuations (oxic/anoxic) in the bottom water condition during the deposition of these shales. Total Nitrogen concentrations are higher in the TS and CLP members (0.04 - 0.08%; 0.04 - 0.06%; respectively) than CLC, LC and MQ members (0.04%; 0.04%: 0.03 - 0.04%; respectively).
DISCUSSION
Paleoclimate
In marine settings, the variations in bulk-rock mineralogy and clay fraction may record paleoenvironmental changes and/or a diagenetic overprint (Westermann et al., 2013). As a consequence, before making any paleoenvironmental interpretation, it is essential to estimate the diagenetic changes in the clay mineral assemblages. Most authigenic clay-mineral formations (recrystallization and the formation of new minerals) occur during burial diagenesis. It has been demonstrated that burial diagenesis may result in the replacement of smectite by chlorite and illite in calcareous beds and marly interbeds, respectively, and an increase of the proportion of regularly mixed interstratified illite-smectite (I/S) with the burial depth (Chamley, 1989; Kübler and Jaboyedoff, 2000; Godet et al., 2008). In the studied section, the regular mixed I/S is completely absent which indicates a significantly lower diagenetic overprint (Godet et al., 2008). Furthermore, the diversity of the clay minerals and the presence of significant variations (>5%) in the mineralogical composition and the lack of any continuous vertical trend within the studied section suggest a relatively low impact on the primary environmental signal by burial diagenesis (Duchamp-Alphonse et al., 2011). Hence, the trends observed in the clay-mineral assemblages in the present study can be used as paleoenvironmental proxies.
The clay mineralogical assemblages of the Tuape section have provided information on the environment of deposition and climatic conditions that prevailed during late Aptian-early Albian age. During the late Aptian, the source area experienced a warm climate with alternating wet and dry seasons, deciphered from the dominance of smectite and illite in the CLC Member. The rock-derived clay minerals (illite and chlorite) are dominant in the lower part of the TS, LC, upper part of the CLP and MQ members, suggesting the predominance of physical weathering over chemical weathering. Chlorite and illite are formed during the initial stages of weathering processes (Nesbitt and Young 1984, 1989; Weaver 1989; Fürsich et al., 2005). The dominance of illite and chlorite in the sedimentary rocks indicate relatively fast erosion in the provenance area (Fürsich et al., 2005). This pattern is typical of a paleoclimate change from warm and humid (seasonal) to arid or semi-arid (Ruffell and Batten, 1990; Madhavaraju et al., 2002). In addition, the dominance of detrital chlorite could be an indication of an increasing continental landmass and reflecting more proximal depositional environments (Duarte, 1998).
The marked increase in kaolinite content (at the expense of mixedlayer clays) in the upper part of the TS and lower part of the CLP members suggest a change in the source area weathering from seasonal climates to chemical weathering. The occurrence of kaolinite indicates a source region which experienced intense weathering under possibly tropical conditions (Biscaye, 1965) where increasing rainfall favoured ionic transfer and pedogenic development of kaolinite (Leung and Lai, 1965; Millot, 1970; Wang and Chen, 1988). We interpret the kaolinite as the end-product of rock degradation in the hinterland and in situ weathering profiles. The increasing concentration of kaolinite indicates the high water-rock ratio in the source area along with a humidsubtropical to tropical climate (Raucsik and Varga, 2008). Hence, the occurrence of both rock (illite and chlorite) and soil derived (kaolinite) clay minerals in the upper part of the TS and lower part of the CLP members suggests a warm and humid (seasonal) sub-tropical climate.
Paleoweathering conditions
The weathering intensity in the sedimentary rocks may be evaluated by using the relationship between alkali and alkaline earth elements (Nesbitt and Young, 1982). During weathering, the labile elements (Na, Ca, and Sr) are mainly leached from the weathering profile leaving behind the insoluble elements (Al, Ba, Rb) (Nesbitt et al., 1980). These chemical changes are transferred to the sedimentary record (Nesbitt and Young 1982; Wronkiewicz and Condie, 1987), thus providing a useful tool for monitoring source area weathering conditions.
A chemical index widely used to determine the degree of source area weathering is the Chemical Index of Alteration, CIA (Nesbitt and Young, 1982). This index can be calculated using molecular proportions of the following oxides: CIA = (Al2O3/Al2O3+CaO*+Na2O+K2O)*100, where CaO* is the amount of CaO associated with the silicate fraction of the rock. CIA value gives the relative proportions of secondary aluminous clay minerals to primary silicate minerals like feldspars (Nesbitt and Young, 1982). Most of the shales show higher concentration of CaO (2.17 - 11.47%). Hence, the CaO values in these samples are not considered as CaO* and are not used for CIA calculation. For the present study, we have followed the method proposed by McLennan (1993) to calculate the CaO* in the sedimentary rocks. The CaO* content was calculated using the following methods: a) if the content of CaO was less or equal to the Na2O content, then we use the CaO value for further calculation, b) if the CaO content was higher than Na2O, then Na2O value was considered as CaO* value (Bock et al., 1998; Gallet et al., 1998; Roddaz et al., 2006; Újvarí et al., 2008). The higher CIA values (76 to 100) in the sedimentary rocks suggest the intense chemical weathering in the source region (Fadipe et al., 2011; Srivastava et al., 2013; Újvarí et al., 2013), whereas low values (50 or less) indicate the near absence of chemical weathering and also reflect cool and arid conditions (Fedo et al., 1995).
The CIA values of the shales are given in Table 5. The shales from CLC, TS, LC, CLP and MQ members show small variations in CIA values (CIA: 69 - 70; 62 - 68; 63 - 64; 60 - 65; 59 - 65; respectively). CIA values of the present study are higher than the average NASC value of 57 (Gromet et al., 1984) and slightly lower than the typical shale values (PAAS: 70 - 75; Taylor and McLennan, 1985). Therefore, the observed CIA values in the shales indicate the moderate chemical weathering intensity in the source rocks.
Another index to measure the chemical weathering of sediments and sedimentary rocks is Plagioclase Index of Alteration (PIA: Fedo et al., 1995), which can be calculated as follows: PIA = [(Al2O3 K2O)/ (Al2O3+Na2O+CaO*-K2O)] × 100 (molecular proportions). The PIA values of CLC, TS, LC, CLP and MQ members (PIA: 77 - 79; 66 76; 66 - 68; 63 - 72; 62 - 68; respectively) are consistent with CIA values which further support that these shales undergone moderate intensity of chemical weathering.
In addition, Al2O3 - (CaO*+Na2O) - K2O (A-CN-K) diagram (molecular proportion; Fedo et al., 1996; Figure 8) which categorizes the differentiation of compositional variations associated with chemical weathering and/or source rock composition (Deepthi et al., 2012; Ghosh et al., 2012). The A-CN-K diagram (Figure 8) displays a moderate loss of Ca, Na and K in the shale samples, as they tend to plot between feldspar join line and A apex. Therefore, the positions of samples in the A-CN-K diagram, as well as their CIA and PIA values, indicate that these sediments were generated from a rock source affected by moderate intensity of chemical weathering. The degree of weathering in the source area was higher than that of NASC and this is shown by the moderate depletion not only in the elements selectively leached from weathering profiles, such as Na, Ca and Sr (Nesbitt et al., 1980; Wronkiewicz and Condie, 1987), but also in the relatively large cations, such as K, Rb and Ba. These elements are mainly fixed on clays such as illite. In particular, the CIA values of the samples collected from the weathering profile are more or less parallel to the A-CN line of A-CN-K plot (Nesbitt and Young, 1984; Fedo et al., 1995).
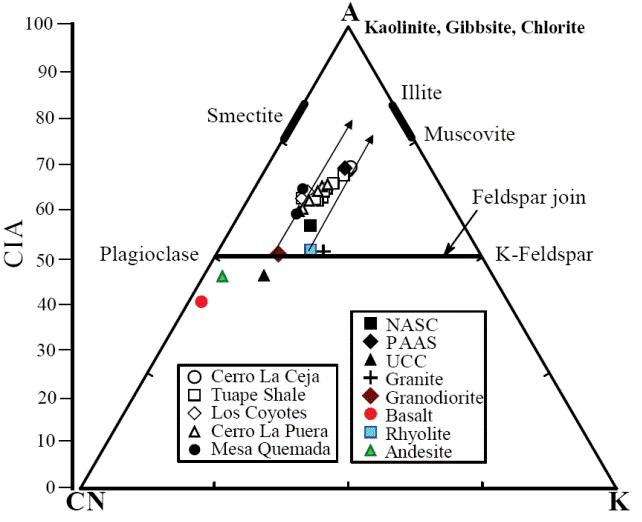
Figure 8 A-CN-K diagram showing the weathering trend of the Mural Limestone (after Nesbitt and Young, 1982). A: Al2O3; CN: CaO* + Na2O; K: K2O (molecular proportions).
Provenance
Trace element compositions could potentially be a source of information to determine provenance. The high field strength elements Zr, Hf, Y and Nb are relatively immobile in the sedimentary environment (as do Al and Ti), thus they reflect provenance composition (Taylor and McLennan, 1985). Al2O3/TiO2 ratios in clastic sedimentary rocks are considered as a powerful tool to understand the types of source rocks (Garcia et al., 1994; Andersson et al., 2004), since the ratio < 14 in sediments is indicative of mafic source rocks, whereas ratios ranging from 19 to 28 reveal felsic source rocks. Al2O3/TiO2 ratios in the shales of the Mural Formation, which range from 16 to 22 (Table 5), suggest that these sediments have been derived predominantly from felsic source rocks.
The REE patterns and size of Eu anomaly in the sedimentary rocks can be considered as an important clue to unravel the source rock signatures (Taylor and McLennan, 1985; Madhavaraju and Lee, 2010; Fu et al., 2010; Armstrong-Altrin et al., 2013). In general, the felsic rocks mainly exhibit higher LREE/HREE ratios and negative Eu anomaly, while mafic rocks show lower LREE/HREE ratios with little or no Eu anomaly (Cullers et al., 1987; Cullers, 1994). All shale samples analyzed in this study have fractionated chondrite-normalized REE patterns, negative Eu anomalies (Eu/Eu*: 0.56 - 0.76; Table 7), LREE enriched, and flat HREE patterns (LREE/HREE: 5.14 - 6.75). Such REE patterns suggest that the original source area was felsic in composition.
Paleo-redox conditions
Significance of higher TOC/TN values in the black shale sequences
The marine organic matter, usually has TOC/TN values between 5 and 8 (Emerson and Hedges, 1988; Meyers, 1994); however, higher TOC/TN values (between 20 and 40) are common in AlbianCenomanian black shales deposited around the world (Rau et al., 1987; Meyers, 1989; Dumitrescu and Brassell, 2006). The higher TOC/TN values are also found in modern sediments deposited under areas of high productivity. Verardo and MacIntyre (1994) mentioned that the higher values indicate more rapid loss of nitrogen than carbon during sinking of marine organic matter from the photic zone. In the present study, most of the black shales of TS and CLP members show TOC/TN values between 20 and 40 (except one sample that show lower value of 17). According to Van Mooy et al. (2002), the degradation of marine organic matter differs significantly in suboxic and oxic conditions. Oxygen-deficient zones commonly are well-developed under areas of high productivity because the large fluxes of sinking organic matter deplete dissolved oxygen. Hence, the observed high TOC/TN values in TS and CLP members suggest that they were deposited in association with oxygen depletion that had developed under conditions of high productivity. Few black shale samples of TS and CLP members (T4, T18, T22; Table 6) show extremely higher TOC/TN values indicating that these samples contain important proportions of land-plant organic matter. The TOC/TN value of 81 in the carbonized wood in the lower Cenomanian sample clearly identifies the organic matter of this sample as land-plant woody tissue (Meyers, 1994). In addition, such higher TOC/TN values (between 40 and 60) are also observed in the lower Cenomanian and Albian samples from Ocean Drilling Program (ODP) Leg 2017 drill-sites on Demerara Rise sequences, offshore of northeastern South America (Meyers et al., 2006).
Multi-proxy trace element patterns
The organic-rich black shales of Phanerozoic age are enriched in Mo, U and V (Brumsack and Gieskes, 1983; Brumsack, 2006; Coveney et al., 1991; Sun and Puttmann, 1997; Nijenhuis et al., 1999; Warning and Brumsack, 2000; Yarincik et al., 2000; Mangini et al., 2001; Tribovillard et al., 2004; Wilde et al., 2004). Uranium and vanadium enrichments are mainly associated with anoxic to euxinic bottom-water conditions during the time of deposition (Mangini et al., 2001). The adsorption of Mo onto humic substances is a possible mechanism to transfer this element from the water column into the sediment, and under euxinic conditions, by rapid uptake by authigenic/syngenetic sulfides (Algeo and Maynard, 2004).
The multi-elements proxies are more suitable for the analysis of the paleo-redox conditions rather than a single elemental proxy (Tribovillard et al., 2006). In this connection, the trace elements such as Mo, U and V are utilized because these elements are least vulnerable to primary and secondary complications (Tribovillard et al., 2006). The Al normalized distribution of Mo, U and V contents of the Tuape section is shown in Figure 7. In this section, Mo and U concentrations show positive shifts in the lower part of the TS Member. However, no such positive shifts are observed in the vanadium curve. Likewise, Mo, U and V curves show small positive shift in the upper part of the TS Member (Figure 8). For the CLP Member, Mo curve shows a small positive shift, whereas U curve shows two positive shifts in the lower part of this member. In this member, two positive shifts of U are remarkable. However, CLP Member shows no such positive shift in the V curve (Figure 7). The observed positive shift in the Mo, U and V curves in the TS and CLP members suggest that the depositional basin experienced the suboxic/anoxic bottom water condition during the deposition of these shales.
U/Th and Ni/Co ratios of marine sediments are considered as a reliable proxies to deduce the bottom water oxygenation conditions of the depositional environment (Dypvik, 1984; Wignall and Myers, 1988; Madhavaraju and Ramasamy, 1999; Hatch and Leventhal, 1992; Jones and Manning, 1994; Rimmer, 2004; Nagarajan et al., 2007a; Madhavaraju and Lee, 2009; Madhavaraju and González-León, 2012; Madhavaraju et al., 2016). A low U/Th ratio (< 0.75) suggests oxic conditions, whereas high U/Th ratio (> 1.25) indicates anoxic conditions (Jones and Manning, 1994). The CLC, LC and MQ members show lower U/Th ratios (0.28 - 0.32; 0.31 - 0.32; 0.31 - 0.37, respectively; Figure 9) than TS and CLP members (0.30 - 0.88; 0.28 - 0.80, respectively; Figure 9). The lower part of the TS Member and the lower and middle parts of the CLP Member have higher values of the U/Th ratio (> 0.75). The observed variations in U/Th ratio suggest that the fluctuation in U/Th ratio are mainly due to variations in oxygenation level from oxic to suboxic conditions.
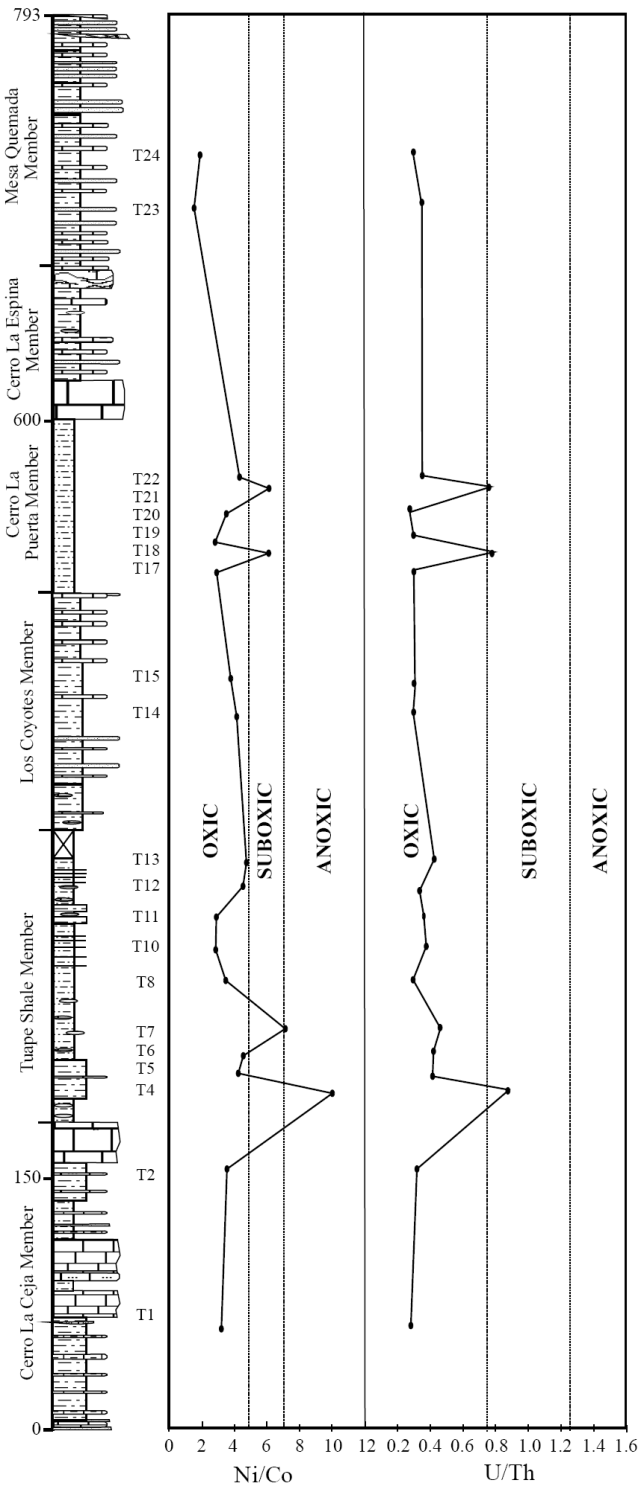
Figure 9 Ni/Co and U/Th variations in the shale samples from the Tuape section of the Mural Limestone.
The Ni/Co ratio has been considered to be a redox indicator by several researchers (Dypvik, 1984; Dill, 1986; Jones and Manning, 1994). Ni/Co ratios below 5 suggest oxic environments, whereas ratios above 5 suggest suboxic and anoxic environments (Jones and Manning, 1994). Significant variations in nickel and cobalt contents are observed in the shale samples of the different members of the Mural Limestone (Table 6). The CLC, LC and MQ members show low Ni/ Co values (3.06 - 3.64; 3.90 - 4.23; 1.60 - 2.08, respectively; Figure 9) whereas the TS and CLP members show low to high Ni/Co content (2.90 - 9.94; 2.97 - 6.17, respectively; Figure 9). The lower part of the TS Member (7.13 to 9.94) and the lower and middle parts of the CLP Member (6.12 - 6.17) show higher values of the Ni/Co ratio (> 5). It suggests that the fluctuation in Ni/Co ratio was controlled mainly by the oxygenation level in the depositional basin (oxic to anoxic conditions).
The shale samples show large variations in Mo, U and V contents and Ni/Co and U/Th ratios. The combined use of trace elements and their ratios may allow to distinguish the various depositional environments, i.e. oxic-anoxic-euxinic. The CLC, LC and MQ members show relatively low contents of TOC, TN, Mo, U and V and low Ni/Co and U/Th ratios, suggesting that these shales were deposited under oxic conditions. The relatively low to moderate contents of TOC, TN, Mo, U and V, and elemental ratios of the TS and CLP members suggest that the depositional basin experienced large fluctuation in oxygen level during the deposition of these members, which resulted in the varying depositional conditions (oxic suboxic anoxic).
CONCLUSIONS
The clay mineralogical assemblages (illite-chlorite-kaolinitesmectite) of the Tuape section have provided information on the climatic conditions and environment of deposition that prevailed during late Aptian-early Albian age. Illite and smectite are the dominant clay minerals identified in the CLC Member suggesting that the source area experienced a warm climate with alternating wet and dry seasons during the late Aptian. The lower part of the TS, LC, upper part of the CLP and MQ members are rich in rock-derived illite and chlorite, suggesting the predominance of physical weathering over chemical weathering, and the source region experienced arid or semiarid climatic conditions. The upper part of the TS and lower part of the CLP members show both rock (illite and chlorite) and soil derived (kaolinite) clay minerals that suggests a warm and humid (seasonal) sub-tropical climate.
The chondrite-normalized REE patterns of the shales are characterized by enriched LREE, relatively flat HREE and significant negative Eu anomalies. The shale samples from CLC, TS, LC, CLP and MQ members show small variations in CIA values: 69 - 70; 62 - 68; 63 - 64; 60 - 65; 59 - 65, respectively, which are higher than the average NASC value of 57 (Gromet et al., 1984) and slightly lower than the typical shale PAAS values : 70 - 75 (Taylor and McLennan, 1985). The CIA and PIA values and positions of samples in the A-CN-K diagram indicate that these shale samples were generated from a source rocks of the upper continental crust affected by moderate intensity of chemical weathering. The shale samples show large variations in Mo, U and V contents and Ni/Co and U/Th ratios. The low contents of TOC, TN, Mo, U and V and low Ni/Co and U/Th ratios in the CLC, LC and MQ members suggest that these shales have been deposited under oxic conditions. On the other hand, the TS and CLP members show relatively low to moderate contents of redox sensitive elements and their ratios suggest that the depositional basin experienced large oscillations in oxygen level during the deposition of these shales that resulted in the unstable depositional conditions (oxic suboxic anoxic).


 nueva página del texto (beta)


